

0 引言
随着全球城市化进程的加快,城市群已经成为人类定居和经济发展的核心[1]。在人地关系矛盾日益加重的背景下,社会经济与生态环境作为城市群可持续发展的重点一直深受关注[2]。目前我国城市群发展取得了显著成就[3],但伴随而来的是大气污染[4]、热岛效应加强[5]和生态用地被城市用地大规模侵占[6]等一系列的生态环境问题,制约了城市群的可持续发展[7]。针对上述问题,许多学者开展了相关研究,对城市群社会经济与生态环境发展现状进行评价,如梁龙武等[8]、李平星等[9]和王渊等[10]分别针对京津冀、长三角和珠三角开展相关研究。已有研究多聚焦于探究上述一线城市群[11]生态环境质量,但随着国内新型城市群的飞速崛起,长株潭、山东半岛和呼包鄂榆等城市群为我国经济发展提供巨大贡献,因此掌握此类城市群的生态环境质量对可持续性发展同样具有指导意义。
目前评价生态环境质量的方法主要有: “压力—状态—响应”(pressure-state-response)模型[12⇓-14]以及生态环境状况指数[15,16](ecological index)。上述评价方法涉及的大量指标体系和数据,在地市级以下尺度获取难度大。其次,上述评价结果多为数值形式,难以体现空间分布状况,不利于后续开展针对性治理。相比于上述方法,徐涵秋[17]提出的遥感生态指数(remote sensing ecological index, RSEI),充分利用遥感技术,克服了地市级以下尺度数据获取难的问题,同时能够实现数据的空间化和可视化展示,从而动态观测生态环境变化。自此,RSEI指数被广泛运用。宋慧敏等[18]、李妍等[19]、王士远等[20]采用Landsat卫星数据,分别对城市、乡镇、自然保护区3个级别地区测算RSEI,证明了RSEI在不同尺度的可靠性。但RSEI应用于较大区域时,面临庞大数据量带来的繁杂数据预处理和指标计算工作[21]。Google Earth Engine(GEE)云平台是近年来全球使用高频的云处理平台[22],该平台处理遥感影像能将时间与空间分辨率更好结合,在长时序遥感监测中优势突出。郑子豪等[23]和张华等[24]基于GEE云平台,结合RSEI进行了长三角城市群生态环境质量和祁连山国家公园生态环境评价与分析。结果表明,GEE作为大区域范围的生态质量评价与监测的遥感计算平台,可以改善遥感数据缺失、色差和时间不一致的问题[25]; 同时可以避免如辐射校正、大气校正、正射校正等数据预处理工作[26]。因此本文将RSEI引入GEE平台评价城市群生态环境质量。
以往研究分析了研究区生态环境质量及其变化[18,27-28],事实上,找出这些原因对于了解生态环境变化机制、采取切实措施保护和修复生态环境具有重要意义[29]。生态环境质量影响因素的研究方法主要分为定性和定量分析。定性分析方法仅能表征生态环境质量与各影响因素的关系及发展趋势,难以明晰各因素对生态环境质量的影响程度; 定量方法主要是相关性分析、多元回归模型等,此类方法仅定量分析单项影响因素对生态环境质量的影响,未能定量分析多影响因素在生态环境质量中的交互作用,且自然与人文要素间的多因素交互作用对生态环境质量的影响研究相对较少。地理探测器是探测空间分异及揭示其背后影响因子的统计学方法,它在度量空间分异度的同时,定量分析各影响因素之间的相对重要性和各影响因素交互作用对生态环境质量的影响[30]。因此,本文引入地理探测器进一步分析城市群生态环境质量变化的影响因素。
鉴于此,在快速城镇化背景下,针对新型城市群生态环境质量评价匮乏,及其影响因素的空间异质性和交互性不清晰等问题,本文借助GEE平台,利用长时序Landsat卫星数据计算长株潭城市群RSEI,分析1990—2020年长株潭城市群生态环境质量时空格局,运用Sen斜率估计和Mann-Kendall(MK)检验进行长株潭城市群生态环境质量的变化趋势分析,并利用地理探测器定性分析影响因素与生态环境质量的发展趋势,定量分析影响因素间交互作用对长株潭城市群生态环境质量的影响。本文旨在为推进长株潭城市群一体化高质量发展提供科学依据,同时也为其他同类型城市群相关研究提供参考。
1 研究区概况及数据源
1.1 研究区概况
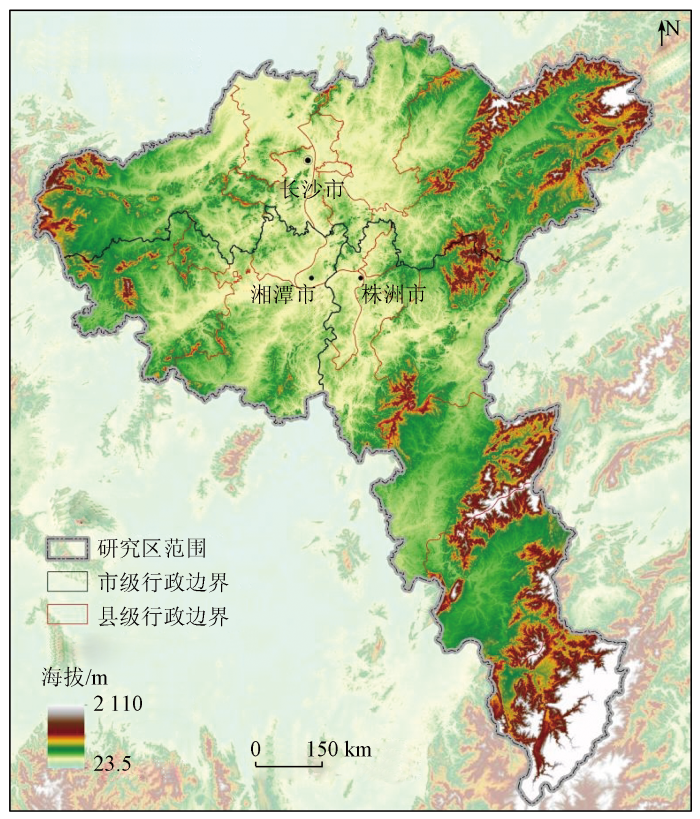
长株潭城市群地处于湖南省中东部,包括长沙、株洲、湘潭三市行政下辖23个县区(图1)。地理位置位于E111°58'38″~114°13'20″,N26°18'19″~28°41'22″之间,总面积2.8×10⁴ km2,属亚热带季风气候区,年平均降水约1 400 mm,年均气温16~18 ℃; 境内地貌包括平原、岗、丘、山地等类型。长株潭城市群是湖南省的政治、经济和文化的核心经济区域以及城镇化进程较快的典型区域[31],是中国第一个自觉开展区域经济一体化实验的城市群。作为长江中游城市群的重要组成部分,长株潭城市群被列为培育新型城镇化战略格局的重点城市群之一[32],在城市化快速发展背景下城市扩展与生态环境质量之间的矛盾突出,具有一定代表性。
图1
1.2 数据源及其预处理
本文所用数据如表1所示,Landsat遥感数据以1990年、1995年、2000年、2005年、2010年、2015年和2020年为中心年份,选取当年及前后年份生长季(4—10月)云量较少且影像质量较好的Landsat5 TM 和 Landsat8 OLI作为主要数据,并基于GEE云平台在完成去云和去水掩模等预处理后进行RSEI计算。本文采用土地利用数据、人口密度数据、夜间灯光数据、降水数据、气温数据以及DEM数据表征研究区自然、社会发展情况,并作为影响因子参与地理探测器计算。其中2020年人口密度缺失,故采用2019年人口密度数据代替2020年人口密度数据,降水和气温数据为逐月数据集,为使数据时相保持一致,故选取4—10月的平均值作为代替值。各数据源在分辨率、投影和空间范围等方面存在不一致,因此在开展研究之前,根据研究区范围统一进行投影转换和裁剪。考虑到各数据分辨率的不同,最终采用最邻近法生成100 m×100 m分辨率数据。
表1 数据来源及预处理
Tab.1
| 数据名称 | 时间 | 分辨率 | 数据来源 |
|---|---|---|---|
| 影像数据 | 以1990年、1995年、2000年、2005年、2010年、2015年、2020年为中心年份(4—10月) | 30 m | Landsat5/8(Google Earth Engine) |
| 土地利用数据 | 1990年、1995年、2000年、2005年、2010年、2015年、2020年 | 30 m | CNLUCC ( |
| 人口密度数据 | 1990年、1995年、2000年、2005年、2010年、2015年、2019年 | 1 km | 中国人口空间分布公里网格数据集( |
| 夜间灯光数据 | 1990年、1995年、2000年、2005年、2010年、2015年、2020年 | 1 km | 中国长时间序列逐年人造夜间灯光数据集( |
| 降水数据 | 1990年、1995年、2000年、2005年、2010年、2015年、2020年 | 1 km | 中国1 km分辨率逐月降水量数据集( |
| 气温数据 | 1990年、1995年、2000年、2005年、2010年、2015年、2020年 | 1 km | 中国1 km分辨率逐月平均气温数据集( |
| DEM数据 | — | 30 m | ASTER GDEM V2( |
2 研究方法
2.1 RSEI的计算
式中: Bi 为 Landsat 波段的地表反射率; SI为土壤指数; IBI为建筑指数。由于4个指标的量纲不统一,为减小对研究结果的影响,将各指标进行归一化处理,使量纲在0~1之间。计算公式为:
式中: NI为归一化指标; I为原始指标; Imin为指标I的最小值; Imax为指标I的最大值。
经过归一化的4个指标通过主成分分析方法进行合成,并选取得到的第一主成分作为RSEI,值越大表示生态环境质量越好,计算公式为:
2.2 Sen斜率估计和MK检验的趋势分析
Sen斜率估计的计算公式为:
式中: β为时间序列数据的趋势变化; RSEIj和RSEIi为时间序列的RSEI值,1<i<j<n; β>0,表示生态环境质量呈现提升趋势,反之退化。
MK检验统计量S的计算公式为:
根据时间序列长度n值的不同,显著性检验统计量的选择也对应发生改变。当n≥10时,统计量S近似服从标准正态分布,此时用检验统计量Z趋势检验,Z值的计算如下:
采用显著性水平α=0.05进行显著性检验。生态环境质量变化等级如表2所示。
表2 生态环境质量变化等级
Tab.2
| β | 趋势 | Z | 显著性 | 趋势特征 |
|---|---|---|---|---|
| β>0 | 提升 | Z>1.96 | 显著 | 显著提升 |
| 0<Z≤1.96 | 不显著 | 不显著提升 | ||
| β=0 | 无变化 | Z | — | 无变化 |
| β<0 | 退化 | 0<Z≤1.96 | 不显著 | 不显著退化 |
| Z>1.96 | 显著 | 显著退化 |
2.3 地理探测器影响因素分析
地理探测器是探测和利用空间分异性的工具,包括分异及因子探测、交互作用探测、风险区探测和生态探测[37]。本文主要采用分异及因子探测和交互作用探测来揭示不同因素及其相互作用对长株潭城市群生态环境质量的影响。
1)分异及因子探测。探测因变量Y的空间分异性,以及自变量X对因变量Y影响程度q的空间分异。本文中,q为单因子对生态环境质量的影响程度,计算公式为:
式中: L为因变量Y的分类数; Nh和N分别为分类h和全局的样本数;
表3 交互作用q值与单因子q值对比关系表
Tab.3
| 交互关系 | 与单因子 q值相比 | 单因子 较小值 | 单因子 较大值 | 两因子 之和 |
|---|---|---|---|---|
| 非线性减弱 | 交互作用q值 | < | < | < |
| 单因子非线性减弱 | 交互作用q值 | > | < | < |
| 双因子增强 | 交互作用q值 | > | > | < |
| 独立 | 交互作用q值 | > | > | = |
| 非线性增强 | 交互作用q值 | > | > | > |
结合数据的可获取性原则,从人文(土地利用、人口密度和夜间灯光)和自然(DEM、降水量和温度)2个角度,选取6个影响因素作为自变量X,将RSEI作为因变量Y。为客观准确获取因子探测分析结果,运用ArcGIS 10.7软件,将上述自变量X转化为栅格数据,运用自然断点法进行分级赋值,综合考虑研究区面积和空间特征等因素,创建研究区范围内3 km×3 km格网,以格网中心点为样本点,共计3 122个,通过格网中心点分别匹配RSEI值与6个影响因素值,利用地理探测器进行分异及因子探测和交互作用探测,揭示不同影响因素的空间分布及其因素间交互作用对生态环境质量的影响。
3 结果与分析
3.1 长株潭城市群生态环境质量空间格局
RSEI值从0~1表示生态环境质量由差到好,本研究RSEI数据主要集中在0.3~0.8之间,尤其在0.4~0.7之间分布密集,符合正态分布。为表述清晰且便于计算,采用自然断点法对7期RSEI结果进行分级,计算各级平均值后进行取整处理,以此作为长株潭生态环境质量最终分级标准[38]。将生态环境质量等级划分为5类,分别为“差”[0,0.40)、“较差”[0.40,0.55)、“中等”[0.55,0.65)、“良”[0.65,0.70)、“优”[0.70,1]。1990—2020年长株潭城市群生态环境质量分类结果如图2所示。长株潭城市群生态环境质量的空间分布总体上遵循“边缘地区较好,核心区较差”的格局。生态环境质量“优”和“良”的地区主要分布在长株潭城市群的东北部和东南部边缘区,如浏阳市东部、攸县东部、茶陵县北部和东南部以及炎陵县的大部分地区。生态环境质量“差”和“较差”的地区不断增加,主要集中在开福区、芙蓉区、雨花区和雨湖区等城市群中部核心区。
图2
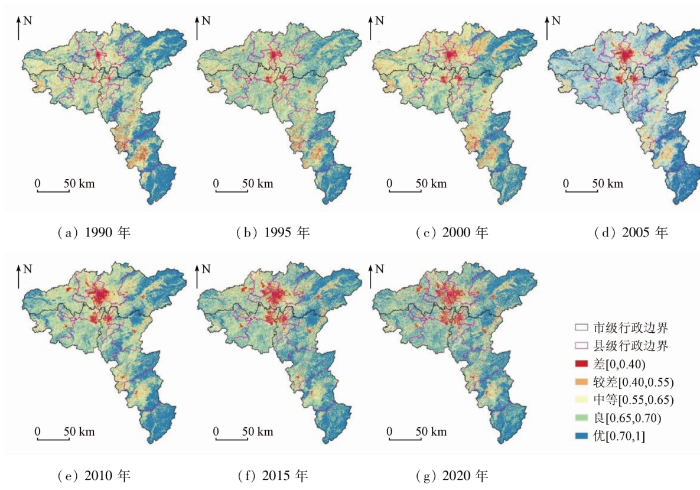
图2
长株潭城市群生态环境质量空间分布
Fig.2
Spatial distribution of ecological environment quality in Changsha-Zhuzhou-Xiangtan urban agglomeration
生态环境质量分类的面积和百分比如图3所示。1990—2000年RSEI值呈现下降趋势,2000—2020年RSEI值呈现上升趋势。1990—2020年30 a间生态环境质量“优”和“良”面积平均占比大于60%,长株潭城市群生态环境质量整体向好。生态环境质量等级“优”和“良”上下浮动的面积占比在10%~15%之间,2020年“优”和“良”的面积占比最大。1990—2020年生态环境质量“差”的面积占比总体呈上升趋势。总体而言,1990—2020年长株潭城市群生态环境质量整体呈现上升趋势。
图3
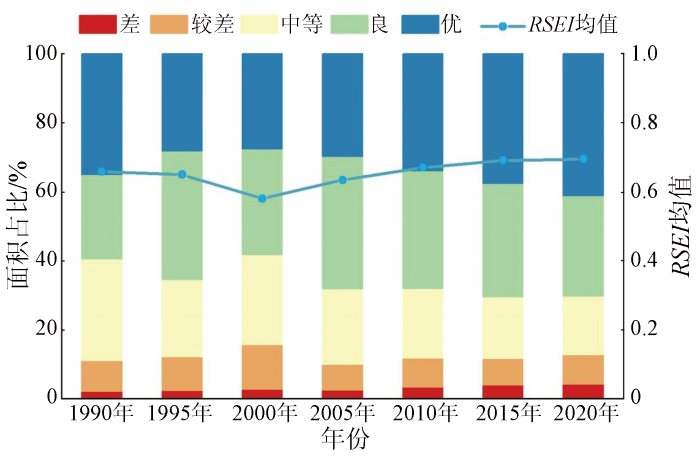
图3
生态环境质量分类的面积占比
Fig.3
The proportion of area classified by ecological environment quality
3.2 长株潭城市群生态环境质量变化趋势
采用Sen斜率估计和MK检验得到1990—2020年长株潭城市群生态环境质量时空变化趋势图,并依据2.2.2中生态环境质量变化等级进行分类,结果如图4所示。“显著退化”地区主要位于研究区中部核心地区,城市建成区急剧扩张,城市建设面积不断扩大造成生态环境质量不断恶化。“不显著退化”地区主要位于炎陵县中部、攸县和茶陵县交界处、浏阳市西北部。“无变化”地区主要位于河流和湖泊。“不显著提升”地区在整个研究区内分布较为分散。“显著提升”地区主要位于研究区茶陵县西南部、攸县西部、湘潭县和湘乡市。1990—2020年长株潭城市群生态环境质量“显著提升”面积为4 168.22 km2,占比为14.82%,“不显著提升”面积为18 150.14 km2,占比为64.55%; “无变化”面积为511.28 km2,占比为1.82%; “不显著退化”面积为4 742.69 km2,占比为16.87%,“显著退化”面积为545.93 km2,占比为1.94%。长株潭城市群生态环境质量显著提升。
图4
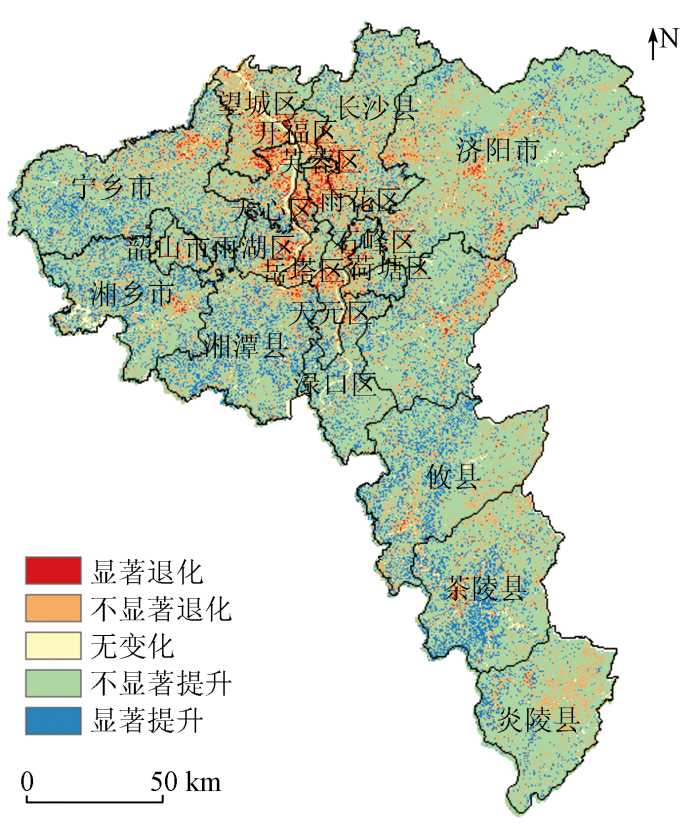
图4
长株潭城市群生态环境质量变化趋势空间分布
Fig.4
Spatial distribution of ecological environment quality change trend in Changsha-Zhuzhou-Xiangtan urban agglomeration
1990—2020年长株潭城市群县区生态环境质量变化情况如图5所示,其中,退化=显著退化+不显著退化,提升=显著提升+不显著提升; 中心城区为雨湖区、岳塘区、芙蓉区、开福区、天心区、望城区、岳麓区、荷塘区、芦淞区、渌口区、石峰区和天元区,不同县区的空间分布和生态质量变化百分比呈现出不同的变化趋势。总体而言,长株潭城市群的中心城区呈现出明显的退化趋势,且“不显著提升”的地区主要分布在边缘县区。芙蓉区、天心区和开福区生态环境质量退化面积占比较大,分别占城市总面积的58.99%,57.84%和52.30%。湘潭县、湘乡市、浏阳市、宁乡市、茶陵县、醴陵市、渌口区、炎陵县、攸县生态环境质量提升面积占比大于80%。
图5
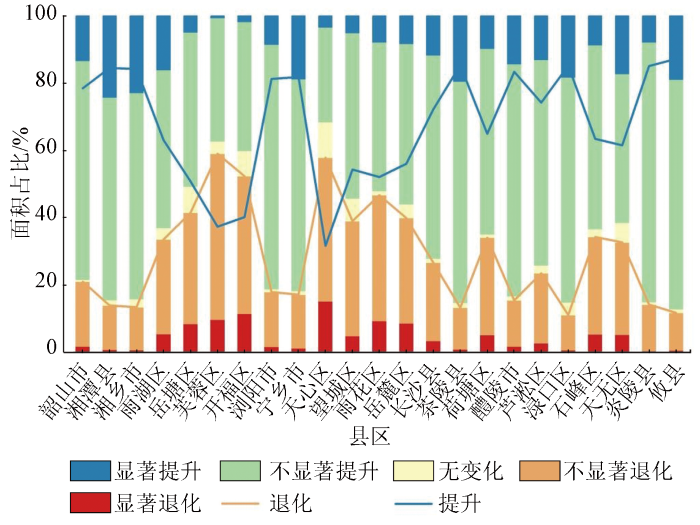
图5
1990—2020年长株潭城市群县区生态环境质量变化情况
Fig.5
Changes in ecological and environmental quality of counties and districts in Changsha-Zhuzhou-Xiangtan urban agglomeration from 1990 to 2020
3.3 长株潭城市群生态环境质量影响因素
地理探测器各因子空间分布如图6所示。土地利用类型中城乡、工矿、居民用地较集中出现在中部核心地区,林地分布在东北部和东南部地区。人口密度和夜间灯光的空间分布大体一致,均呈现中部核心建成区数值较高,东北部和东南部地区山区数值较低。海拔表现为东北部和东南部山区到中部平原放缓的空间形态。降水量呈现由中部向四周逐渐增加的趋势。温度呈现由中部向四周逐渐降低的趋势。
图6
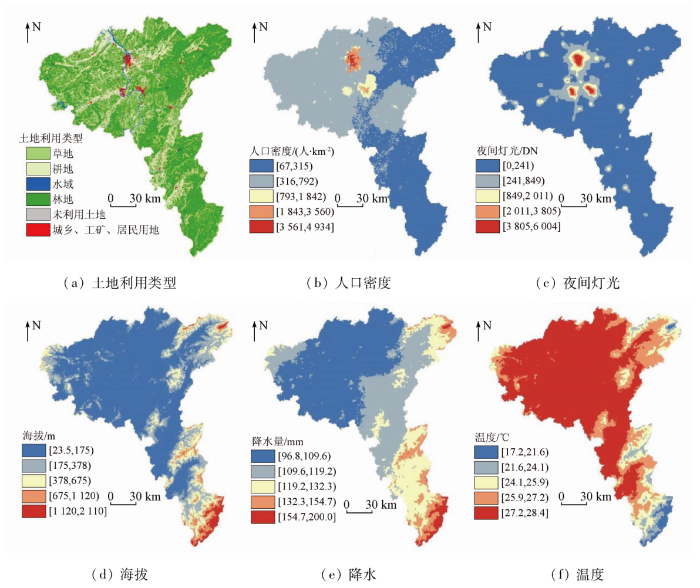
图6
1990年生态环境质量影响因子空间分布
Fig.6
Spatial distribution of factors affecting ecological environment quality in 1990
3.3.1 分异及因子探测结果分析
根据地理探测器模型的分异及因子探测结果(表4)所示,所有影响因子的显著性检验P值均<0.01,表明所选因子均对长株潭城市群生态环境质量的空间分布具有显著影响。1990—2020年间q值排名第一依次为DEM(0.296 1)、DEM(0.217 7)、土地利用(0.291 6)、夜间灯光(0.293 5)、土地利用(0.367 9)、夜间灯光(0.335 1)和土地利用(0.339 7)。1990—1995年间,DEM和温度对生态环境质量的影响排名前二,而土地利用和夜间灯光对生态环境质量的影响位于末尾阶段。2000年土地利用对生态环境质量的影响排名第一,DEM对生态环境质量的影响降至第二,但温度和降水要高于夜间灯光和人口密度对生态环境质量的影响。2000年对生态环境质量的影响由自然因素向人文因素的过渡。2005—2020年间,土地利用和夜间灯光对生态环境质量的影响排名前二,而降水和温度等自然因素对研究区的生态环境质量影响位于末尾阶段。综合来看,1990—2000年间自然因素>人文因素的影响,2005—2020年人文因素>自然因素的影响。
表4 分异及因子探测结果的q值①
Tab.4
| 年份 | 土地利用(X1) | 人口密度(X2) | 夜间灯光(X3) | 海拔(X4) | 降水(X5) | 温度(X6) |
|---|---|---|---|---|---|---|
| 1990年 | 0.112 3*** | 0.105 3*** | 0.082 4*** | 0.296 1*** | 0.168 2*** | 0.277 7*** |
| [4] | [5] | [6] | [1] | [3] | [2] | |
| 1995年 | 0.164 0*** | 0.172 0*** | 0.142 6*** | 0.217 7*** | 0.092 9*** | 0.190 4*** |
| [4] | [3] | [5] | [1] | [6] | [2] | |
| 2000年 | 0.291 6*** | 0.136 0*** | 0.164 1*** | 0.267 9*** | 0.171 7*** | 0.239 4*** |
| [1] | [6] | [5] | [2] | [4] | [3] | |
| 2005年 | 0.283 8*** | 0.205 0*** | 0.293 5*** | 0.257 6*** | 0.156 8*** | 0.211 2*** |
| [2] | [5] | [1] | [3] | [6] | [4] | |
| 2010年 | 0.367 9*** | 0.226 5*** | 0.324 0 | 0.254 6 | 0.154 1 | 0.220 3 |
| [1] | [4] | [2] | [3] | [6] | [5] | |
| 2015年 | 0.292 3*** | 0.179 3*** | 0.335 1*** | 0.191 1*** | 0.138 7*** | 0.169 8*** |
| [2] | [4] | [1] | [3] | [6] | [5] | |
| 2020年 | 0.339 7*** | 0.142 6*** | 0.274 4*** | 0.176 1*** | 0.088 8*** | 0.162 8*** |
| [1] | [5] | [2] | [3] | [6] | [4] |
①*,**,***分别表示P<0.1,P<0.05,P<0.01; []内数字代表对应因子在当期的影响因素排名。
3.3.2 交互作用探测结果分析
分别对1990年、1995年、2000年、2005年、2010年、2015年和2020年7期因子交互作用结果进行排序,将交互作用影响排名前10的因子组合整理得到表5。1990—2020年间各因素间的交互作用表现出对生态环境质量的影响具有小范围波动,呈现先增强后减弱趋势。1990—2010年q值排名第一的为土地利用∩海拔,分别为0.349 6,0.329 1,0.426 6,0.437 5和0.520 7; 2015—2020年q值排名第一的为土地利用∩夜间灯光0.427 2和0.410 5,与分异及因子探测结果相比q值提升程度在5%~15%之间。1990—2010年交互作用q值在不断升高,从0.349 6到0.502 7,2020年跌落至0.410 5。排名前十的影响因素中多以土地利用、夜间灯光、DEM和人口密度两两组合。在2010年以前土地利用和DEM对生态环境质量表现出较突出的影响作用,说明2010年以前人文和自然因素都对生态环境质量产生影响。在2015年后土地利用和夜间灯光对生态环境质量表现出较突出的影响作用,说明2015年以后人文因素成为生态环境质量主要的影响因素。结果显示,各因子在交互作用下对生态环境的影响度均比单因子大,说明长株潭城市群生态环境质量并不仅仅是单因子作用的结果,而是各因子交互后增强的结果。
表5 因子交互作用探测结果的q值
Tab.5
| 年份 | 交互因子 | |||||||||
|---|---|---|---|---|---|---|---|---|---|---|
| 1990年 | 0.349 6 | 0.338 2 | 0.337 1 | 0.324 8 | 0.321 1 | 0.309 0 | 0.306 1 | 0.305 6 | 0.302 3 | 0.296 2 |
| X1∩X4 | X3∩X4 | X1∩X6 | X2∩X4 | X3∩X6 | X4∩X5 | X2∩X6 | X4∩X6 | X5∩X6 | X1∩X2 | |
| 1995年 | 0.329 1 | 0.310 3 | 0.308 3 | 0.289 9 | 0.285 7 | 0.281 1 | 0.258 1 | 0.256 7 | 0.242 5 | 0.236 3 |
| X1∩X4 | X1∩X6 | X3∩X4 | X1∩X2 | X2∩X4 | X3∩X6 | X1∩X5 | X2∩X6 | X2∩X5 | X3∩X5 | |
| 2000年 | 0.426 6 | 0.415 2 | 0.389 1 | 0.362 6 | 0.356 0 | 0.349 3 | 0.323 3 | 0.320 0 | 0.291 1 | 0.284 4 |
| X1∩X4 | X1∩X6 | X1∩X5 | X1∩X2 | X1∩X3 | X3∩X4 | X2∩X4 | X3∩X6 | X2∩X6 | X4∩X5 | |
| 2005年 | 0.437 5 | 0.434 6 | 0.420 4 | 0.412 8 | 0.393 6 | 0.386 0 | 0.383 6 | 0.377 3 | 0.369 5 | 0.334 3 |
| X1∩X4 | X3∩X4 | X1∩X3 | X1∩X6 | X3∩X6 | X1∩X5 | X1∩X2 | X2∩X4 | X3∩X5 | X2∩X6 | |
| 2010年 | 0.502 7 | 0.482 2 | 0.477 2 | 0.463 9 | 0.449 7 | 0.445 5 | 0.428 3 | 0.412 4 | 0.385 7 | 0.351 3 |
| X1∩X4 | X1∩X6 | X1∩X3 | X3∩X4 | X1∩X5 | X1∩X2 | X3∩X6 | X3∩X5 | X2∩X4 | X2∩X6 | |
| 2015年 | 0.427 2 | 0.411 6 | 0.393 9 | 0.387 5 | 0.377 1 | 0.368 5 | 0.363 5 | 0.349 6 | 0.348 5 | 0.335 2 |
| X1∩X3 | X3∩X4 | X3∩X6 | X1∩X4 | X1∩X6 | X3∩X5 | X1∩X5 | X1∩X2 | X2∩X3 | X2∩X4 | |
| 2020年 | 0.410 5 | 0.404 7 | 0.410 5 | 0.382 6 | 0.369 3 | 0.354 1 | 0.342 8 | 0.339 7 | 0.321 6 | 0.293 3 |
| X1∩X3 | X1∩X6 | X1∩X4 | X1∩X5 | X1∩X2 | X3∩X4 | X3∩X6 | X2∩X6 | X3∩X5 | X2∩X3 | |
综合地理探测器的分析结果,长株潭城市群的生态环境质量空间分异性不仅是单一影响因子直接、独立作用的结果,而是人文因子和自然因子等影响因素交互后互相增强的综合作用导致的。分异及因子探测和交互探测结果的差异反映出,对于长株潭城市群生态环境质量的空间分异性的影响,大部分影响因子通过与其他因子的协同作用可以比单独作用更好地体现出来。
4 讨论与结论
4.1 讨论
长株潭城市群生态环境质量变化主要受到自然因素和人文因素的双重作用。1990—2000年自然因素>人文因素对生态环境质量的影响,2000—2020年人文因素>自然因素对生态环境质量的影响。1990—2000年,长株潭城市群呈现自然式发展,人为干预因素少,使该时期内自然因素对生态环境质量的影响较大。2000—2020年,长株潭城市群实施《长株潭城市群资源节约型和环境友好型社会建设综合配套改革试验总体方案》《长株潭城市群生态绿心地区总体规划》和《长株潭城市群生态绿心地区保护条例》等保护和管理措施,开始建立区域性生态环境补偿机制,提出“一核三带”发展战略,增强了长株潭城市群向周边的辐射能力,更加突出长株潭城市群生态绿心的优先定位。随着生态文明建设理念的不断推进与落实,城市群发展更加注重向绿色转型,生态环境质量明显变好。这一系列的理念和管理措施使得人文因素的影响迅速提升。
本文通过GEE平台极大地提高了影像处理的效率,同时结合地理探测器定量分析了影响因素交互作用对生态环境质量的影响。本研究可为未来新兴城市群可持续发展提供相关参考。然而,本文仍存在一定局限性。首先,本文仅确定了城市群尺度上生态环境质量的主导因素,缺乏对更加精细尺度下生态环境质量的影响因素分析,下一步考虑利用其他地理空间模型,如时间地理加权回归模型,在县区级、格网级等精细尺度上探究生态环境质量与影响因素的时空关系。此外,对于自然和人文因素之间交互作用的复杂机理探讨不够深入,未来可纳入能反映区域自然和人文发展状况的多源大数据,探索新时代生态环境与社会经济协调发展模式,利用网络分析等方法探究区域生态环境质量影响因素之间的关系。
4.2 结论
本文运用GEE计算1990—2020年长株潭城市群的RSEI,首次揭示长株潭城市群生态环境质量的时空分布特征,利用Sen斜率估计和MK检验分析长株潭城市群生态环境质量的时空变化,并运用地理探测器进一步定量解析影响生态环境质量的影响因素及各因素的交互影响,得出以下主要结论:
1)长株潭城市群生态环境质量总体较好,空间分布总体上遵循“边缘地区较好,核心区较差”的格局。长株潭城市群生态环境质量等级为“优”和“良”的面积平均占比超过60%。可持续发展理念转变了长株潭城市群城市无序扩张的发展模式,使得城市群RSEI总体上呈现先下降后上升趋势,并在2000年出现拐点。
2)虽然城市群RSEI总体呈上升趋势,但中心城区生态环境质量退化严重,非中心城区生态环境质量变化以提升为主。生态环境质量“显著提升”的县区分布在南部、西部和北部地区(茶陵县、湘潭县、湘乡市和宁乡市等); “显著退化”的县区主要分布在中部核心城区(岳塘区、芙蓉区、开福区等)。
3)1990—2020年30 a间DEM、土地利用和夜间灯光对长株潭城市群生态环境质量影响较强,人口密度、降水和温度的影响作用较弱。1990—2000年间自然因素大于人文因素的影响,2005—2020年人文因素大于自然因素的影响。分异及因子探测和交互作用探测表明,交互作用相比单因子,对生态环境质量的影响提升5%~15%。2010年前人文因素和自然因素间的交互作用对生态环境影响较强,而2015年后人文因素间的交互作用对生态环境质量影响较强。
参考文献
Scenario modeling of urbanization development and water scarcity based on system dynamics:A case study of Beijing-Tianjin-Hebei urban agglomeration,China
[J].
DOI:10.3390/ijerph16203834
URL
[本文引用: 1]

Due to the accelerated process of urbanization in China, urban agglomerations have become the core areas for human settlement and economic development. High population and economic density has brought great pressure on water supply. Water scarcity is increasingly becoming one of the most important issues for the sustainable and healthy development of China’s urban agglomerations. In this paper, a system dynamics model was constructed to simulate the current conditions and future scenarios of urbanization development and water scarcity in the Beijing–Tianjin–Hebei (BTH) urban agglomeration in 2000–2030, by examining the interaction and feedback between the six major subsystems: water supply, water demand, water pollution, population urbanization, economic urbanization, and land urbanization. It is found that the South-to-North Water Diversion Project and the improved Reclaimed Water Reuse System may greatly increase the water supply. However, the speed of population urbanization and economic growth, the spatial structure of urban agglomeration and the water consumption pattern may determine the water demand. Although all scenarios may risk water scarcity in the future at some point, we could detect a comprehensive and relatively rational scenario to balance water scarcity, regional equity, and efficiency. It might help to synthetically understand the coordinated development mode between urbanization and water resources in Beijing–Tianjin–Hebei (BTH) urban agglomeration, and provide a useful analytical and decision support tool for scientists and policy-makers to achieve the sustainable urbanization development and water resource management.
Measurement of coupling coordination degree and spatio-temporal characteristics of the social economy and ecological environment in the Chengdu-Chongqing urban agglomeration under high-quality development
[J].
DOI:10.3390/ijerph182111629
URL
[本文引用: 1]
With rapid urbanization and industrialization, ecological disorders and environmental degradation have become serious, and the promotion of the coordinated development of the social economy and ecological environment is not only a pressing problem to be solved, but also an important step towards sustainable development. The coordinated development of the social economy and eco-environment is conducive to sustainable development. Considering the Chengdu–Chongqing urban agglomeration as a case study, this paper adopts panel data and establishes an index system to evaluate the coupling coordination degree (CCD) between the social economy and ecological environment based on the concept of high-quality development. From the perspective of time and space, the changing laws and characteristics of the CCD are analyzed, and the key factors affecting it are determined using regression analysis. The results show the following: (1) the CCD between the social economy and ecological environment of the Chengdu–Chongqing urban agglomeration presents a low level overall; (2) the CCD in more developed regions is significantly higher than that in less developed regions; thus, the characteristics of spatial differences are obvious; (3) the urbanization rate, ratio of actual use of foreign capital and GDP, ratio of total export-import volume and GDP, proportion of days with good air quality, and per capita public green space area are the main factors affecting the coordinated development of the social economy and ecological environment in the Chengdu–Chongqing urban agglomeration; and (4) Chongqing has obvious endogeneity. Finally, corresponding policy recommendations are provided aimed at promoting rapid economic development in the Chengdu–Chongqing urban agglomeration while focusing on environmental protection and promoting high-quality economic development with ecological environmental protection, while putting forward decision-making suggestions for high-quality development of urban agglomerations.
中国城市群高质量发展与科技协同创新共同体建设
[J].
DOI:10.11821/dlxb202112003
[本文引用: 1]
中国城市群是国家新型城镇化的主体区、国家高质量发展的战略核心区与碳中和的责任区,科技创新驱动对实现城市群的上述主体目标发挥着不可替代的重要作用。如何在新发展格局下依靠科技创新驱动促进中国城市群实现高质量发展和生态环境高水平保护,并逐步建成世界级城市群,是摆在我们面前亟待解决的现实问题。基于这一问题,在第23届中国科学技术协会年会期间,以“科技创新驱动世界级城市群发展与中国城市群高质量崛起”为主题,专门设立了“区域协同发展论坛暨第二届中国城市群发展论坛”,通过应邀的国内外50多位有关城市群及科技协同创新知名专家的系统研讨,普遍认为:全球城市群的发展已进入21世纪的中国新时代,中国城市群高质量发展地位被提升到了前所未有的战略高度,但城市群发展及规划实施中存在着一系列现实问题不容忽视,未来中国城市群高质量发展必须依靠科技创新驱动,把建设创新驱动的智慧型、碳中和型、双循环型和城乡融合型城市群作为中国城市群高质量发展的基本方向。进一步创新研究工作机制,建立协同创新共同体,逐步把中国城市群建成为高水平开放、高质量发展、高品质生活和高效能治理的世界级城市群。
High-quality development of urban agglomerations in China and construction of science and technology collaborative innovation community
[J].
DOI:10.11821/dlxb202112003
[本文引用: 1]
China's urban agglomerations are the main area of national new urbanization, the strategic core area of national high-quality development and the responsibility area of carbon neutrality. The science and technology innovation plays an irreplaceable role in realizing the above main goals of urban agglomerations. How to promote China's urban agglomeration to achieve high-quality development and high-level protection of the ecological environment under the new development pattern, and gradually build a world-class urban agglomeration is a realistic problem to be solved. Based on this issue, during the 23rd Annual Conference of the Chinese Association of Science and Technology, with the theme of "Science and technology innovation driving the development of world-class urban agglomerations and the high-quality rise of China's urban agglomerations", the "Regional Collaborative Development Forum and the Second China Urban Agglomeration Development Forum" was specially set up, through systematic discussions of more than 50 well-known experts at home and abroad on urban agglomerations and science and technology collaborative innovation, it is generally believed that the development of global urban agglomerations of China has entered a new era in the 21st century, and the high-quality development of China's urban agglomerations has been promoted to an unprecedented strategic level. However, there are a series of practical problems in the development and planning implementation of urban agglomerations. In the future, the high-quality development of China's urban agglomerations must rely on scientific and technological innovation, and the construction of innovation-driven intelligence, carbon-neutrality, dual circulation and urban-rural integrated urban agglomerations should be the basic direction of high-quality development of China's urban agglomerations. We should further innovate the research work mechanism, establish a collaborative innovation community, and gradually build China's urban agglomerations into world-class urban agglomerations with high-quality development, high-level openness, high-quality life and efficient governance.
京津冀城市群大气污染治理效率及影响因素研究
[J].
The research of air pollution treatment efficiency and its influencing factors in the Beijing-Tianjin-Hebei urban agglomeration
[J].
Effects of landscape composition and pattern on land surface temperature:An urban heat island study in the megacities of Southeast Asia
[J].DOI:10.1016/j.scitotenv.2016.10.195 URL [本文引用: 1]
中国城市群城市用地扩张时空动态特征
[J].
DOI:10.11821/dlxb202003010
[本文引用: 1]
认识城市群城市用地扩张特征、扩张质量及景观生态效应等综合信息将有助于城市群空间高质量发展规划与决策。选取10个不同发育等级的城市群作为研究对象,综合运用城市用地扩张强度指数、城市用地扩张强度差异指数、景观扩张指数、景观格局指数,分析1990—2015年期间城市群城市用地扩张时空特征及景观生态效应,并构建人口、经济与城市用地协同发展指数,据此分析城市用地扩张中“人—地”关系协同程度。结果表明:① 1990—2015年,各个城市群城市用地面积持续增加,建成区的范围不断扩大,扩张强度呈现“上升—下降”的趋势;在2010年之前成熟型城市群的扩张强度最高,2010年之后培育型城市群成为扩张强度最高的类型。② 城市群城市用地扩张总体上呈现不均衡布局的趋势,高速扩张区域主要分布在沿海地区。从全国视角来看,东部高于中、西、东北部,整体城市群快速扩张的中心由东向西移动。③ 城市群城市用地空间扩张模式表现出边缘式和飞地式两种空间扩张模式并存,不同发育等级之间具有明显差异性,成熟型城市群的空间结构较为稳定,其他两种类型的城市群空间结构初具雏形或尚未形成。④ 城市群城市用地扩张“吞没”了郊区和农村地区,破碎化程度、形状的复杂程度较高,景观格局表现出不稳定。⑤ 城市群“人口—土地”协同程度逐步增强,“经济—土地”协同程度整体较高,整体上表现出城市用地扩张质量有所提升。新时期城市群城市用地应严格控制扩张规模,加快中小城市的发展,促进城市群城市用地扩张均衡发展,为城市群国土空间高质量发展提供重要参考。
Spatio-temporal characteristics of urban land expansion in Chinese urban agglomerations
[J].
DOI:10.11821/dlxb202003010
[本文引用: 1]
Comprehensive analysis of the characteristics, quality, and ecological effects of urban land expansion would be extremely valuable in high-quality development planning and decision-making. Using data of ten urban agglomerations of China from 1990 to 2015 at varying levels of urban development, this study analyzed the degree of urban land expansion based on the "human-land" synergistic relationship and examined the spatio-temporal characteristics and landscape ecological effects of urban development. Various development indexes for population, economy, and urban land were evaluated, including the urban land expansion intensity index, the intensity differentiation index, the landscape expansion index, and the pattern index. The results of the study are as follows: (1) From 1990 to 2015, the built-up areas in the urban agglomerations expanded continuously, while the expansion intensity showed a fluctuating trend. The highest values of expansion intensity for developed urban agglomerations appeared before 2010, while for the developing areas, the highest values came after 2010. (2) Overall, there was an asymmetrical urban growth among the agglomerations, and the areas with high urban expansion were mainly distributed along the coastal zones. At the national level, the epicenter of rapid urban growth moved from east to west, with the urban expansion in eastern China being much faster compared with the central, western, and northeastern regions. (3) The evolution in urban land use displayed two main spatial patterns, namely edge expansion and outlying, which varied based on the level of urban development. The spatial pattern in the developed urban clusters was more stable, while in the developing areas, the spatial structure started to take shape but have yet to be formed. (4) Urban expansion sprawling over suburban and rural areas resulted in relatively high degrees of fragmentation and structural complexity and instability of the landscape pattern. (5) The man-land synergy in these urban agglomerations increased gradually over time while the economy-land interaction was generally high, indicating an improvement in the overall quality of urban growth. The results of this study highlight the need to have stricter supervision of urban expansion particularly in the early stages of city development, to foster the development of small and middle-sized cities, and to propose a more balanced approach in urban land expansion. The findings here provide valuable lessons for high-quality development of land use in urban agglomerations of China.
Spatiotemporal change and landscape pattern variation of eco-environmental quality in Jing-Jin-Ji urban agglomeration from 2001 to 2015
[J].DOI:10.1109/Access.6287639 URL [本文引用: 1]
京津冀城市群城市化与生态环境时空分异及协同发展格局
[J].
Spatiotemporal differentiation and coordinated development pattern of urbanization and the ecological environment of the Bejjing-Tianjin-Hebei urban agglomeration
[J].
基于一体化生态空间格局的土地利用/覆被变化及其生态环境效应——以长三角为例
[J].
Eco-environmental effect of land use/cover change (LUCC) based on integrated ecological space:A case of Yangtze River Delta
[J].
基于Google Earth Engine云计算的城市群生态质量长时序动态监测——以粤港澳大湾区为例
[J].
Dynamic monitoring of long time series of ecological quality in urban agglomerations using Google Earth Engine cloud computing:A case study of the Guangdong-Hong Kong-Macao Greater Bay Area,China
[J].
中国城市群结构体系的组成与空间分异格局
[J].
The formation,development and spatial heterogeneity patterns for the structures system of urban agglomerations in China
[J].
基于PSR模型的陕西省土地生态系统健康评价
[J].
DOI:10.13287/j.1001-9332.202105.013
[本文引用: 1]
基于“压力-状态-响应”(PSR)模型和熵值法对陕西省十市一区的土地生态系统健康状况进行诊断,分析了2009—2017年间土地生态系统健康等级时空变化趋势,以及影响土地生态系统健康变化的驱动因素。结果表明: 2009—2017年间,陕西省土地生态系统健康水平整体提升,其中,2009—2014年间土地生态系统健康程度较低,2014年后健康状况得到明显改善。西安市、宝鸡市、渭南市和汉中市土地生态系统健康等级高且变化幅度大,延安市、榆林市、安康市土地生态系统健康等级较低且变化幅度小,整体呈陕南地区>关中地区>陕北地区。总体来看,陕西省土地生态系统的压力、状态和响应指数均有所增长,但增速趋缓,2014年以后基本趋于平缓,表明在2014—2017年陕西省土地生态系统处于稳定的健康状态。人口增长、城市化水平、单位耕地化肥负荷、森林覆盖率、工业废水排放达标率和工业固体废物综合利用率是影响陕西省土地生态系统健康变化的主要驱动因素。控制化肥农药使用量、优化土地利用结构和提高土地利用效率是陕西省推进生态文明建设、落实生态保护红线的必要措施。
Evaluation of land ecosystem health in Shaanxi Province,Northwest China based on PSR Model
[J].
中国农村生态环境质量动态评价及未来发展趋势预测
[J].
DOI:10.11849/zrzyxb.20160555
[本文引用: 1]
客观评价和预测我国农村生态环境质量状况及发展趋势,对于保障粮食安全、实现农村经济可持续发展具有重要的理论和现实意义。论文基于压力-状态-响应(PSR)模型框架,构建了我国农村生态环境质量评价指标体系,分析了2000—2015年我国农村生态环境质量的动态变化。基于GM(1,1)模型,预测了“十三五”期间我国农村生态环境质量的发展态势。研究结果表明:2000—2015年我国农村生态环境质量的综合评价得分从0.669下降到0.387,农村生态环境质量总体呈现恶化趋势,农村生态环境承受的污染排放压力越来越大,环境治理投入较少,尚未形成对农村生态环境恶化情形的逆转。如果继续延续过去农业经济发展模式,2020年我国农村生态环境质量状况将会持续恶化,与“十三五”绿色发展的良好愿景目标相差甚远。
Dynamic assessment and trend prediction of rural eco-environmental quality in China
[J].
基于PSR模型的城市多灾种风险评估及规划响应
[J].
Urban multi-hazard risk assessment and planning response based on PSR model
[J].
基于MODIS遥感数据和GIS的山东省生态环境状况评价
[J].
Evaluation of the ecological environment of Shandong Province using MODIS data and GIS platform urban agglomeration
[J].
基于RS和GIS的土地生态环境状况评价及其动态变化
[J].
Dynamic changes and evaluation of land ecological environment status based on RS and GIS technique
[J].
城市遥感生态指数的创建及其应用
[J].
A remote sensing urban ecological index and its application
[J].
基于遥感生态指数模型的渭南市生态环境质量动态监测与分析
[J].
DOI:10.13287/j.1001-9332.201612.024
[本文引用: 2]
本文基于1995和2015年的Landsat系列遥感影像,利用主成分分析法确定绿度、湿度、干度、热度4个指标的权重,采用遥感生态指数(RSEI)评价模型,对渭南市1995—2015年的生态环境质量进行监测与分析.结果表明: 1995—2015年,渭南市的生态环境质量总体呈上升趋势,RSEI均值由0.489上升至0.556;生态环境改善的地区主要分布在渭南市中部,占总面积的49.6%;生态环境退化的地区主要分布在韩城市部分矿区和渭南市南部区县(秦岭北麓渭南段),仅占总面积的15.4%.研究区生态环境质量受城市规划建设影响较大,但总体上其生态环境质量有所改善,得益于近年来该市对生态环境的关注与投入.
Dynamic monitoring and analysis of ecological environment in Weinan City,Northwest China based on RSEI model
[J].
乡镇遥感生态指数时空变化及影响因子研究——以天津市蓟州区为例
[J].
The spatiotemporal changes of remote sensing ecological index in towns and the influencing factors:A case study of Jizhou District,Tianjin
[J].
长白山自然保护区生态环境质量的遥感评价
[J].
DOI:10.18306/dlkxjz.2016.10.010
[本文引用: 1]
人类的生存质量与生态环境密切相关,利用遥感技术可快速地进行生态环境质量评价,为区域生态环境的治理、改善以及发展规划提供重要参考。本文以长白山自然保护区为例,选取1995、2007年Landsat5 TM影像和2015年Landsat8 OLI影像,反演得到能反映生态环境的绿度、湿度、热度和干度等指标,利用主成分分析法,依据新型遥感生态指数RSEI对长白山自然保护区1995-2015年的生态环境进行评价,结果表明:①绿度、湿度指标对区域生态环境起正向作用,热度、干度指标对区域生态环境起负向作用,且湿度对生态环境影响较大;②该区域1995、2007、2015年生态指数优良等级所占比例依次为49.520%、66.508%、76.189%,同时RSEI等级变差、不变、变好的比例分别为3.945%、55.598%、40.457%。生态环境质量整体不断改善,说明长白山自然保护区的天然林资源保护工程以及一系列生态保育措施起到了一定作用;而天池周边生态环境质量有所下降可能与旅游活动的快速发展有关;③逐步回归分析的结果表明,所选的各指标均为指示生态环境质量的关键指标;而裸露、干化地表的治理则是改善生态环境质量的关键。
Assessment of ecological environment quality in the Changbai Mountain Nature Reserve based on remote sensing technology
[J].
DOI:10.18306/dlkxjz.2016.10.010
[本文引用: 1]
The well-being of the human race is closely related to the ecological environment. In the past few decades, indicators retrieved from remote sensing data have been increasingly more widely applied to ecological environment evaluation for their advantages of spatial visualization, and remote sensing technology offers important reference to regional ecological environment management, improvement, and development planning by quickly assessing regional ecological environment quality. Remote sensing ecological index (RSEI), constructed by four indicators including green degree, humidity degree, heat degree, and dry degree retrieved from remote sensing images, can reflect ecological environment status. RSEI is based on real-time remote sensing images and accordingly more capable of quick evaluation of temporal and spatial changes of ecological environment quality. In this article, Landsat5 TM images from 1995 and 2007 and Landsat8 OLI images from 2015 were used as data source to retrieve values of the four indicators to construct the RSEI by the principal component analysis method, and Changbai Mountain Nature Reserve ecological environment quality from 1995 to 2015 was evaluated using the RSEI. The result shows: (1) The green degree and humidity degree have an positive effect on promoting the ecological environment quality of the region while the heat degree and dry degree have a restraining effect on the regional ecological environment quality, and the humidity degree is more significant than the other three indicators. (2) In this region, the proportion of excellent and good RSEI classes accounted for 49.5%, 66.5%, and 76.2% of the total area in 1995, 2007, and 2015. Meanwhile, the degenerated, unchanged, and improved RSEI classes were 3.9%, 55.6%, and 40.5% of the total area respectively, indicating that the overall ecological environment quality has gradually improved. To some extent this is attributed to the Natural Forest Resources Protection Project and a series of ecological conservation measures taken in the Changbai Mountain Nature Reserve area. Although the overall ecological environment quality of the study area has gradually improved, the ecological environment quality around Tianchi has declined. This area has a relatively fragile ecological environment and suffers from high intensity of tourism activities. The decline in ecological environment quality may be attributed to the increasingly intense tourism activities. (3) The stepwise regression analysis results show that each of the selected indicators is key to indicating the ecological environment quality, and the model prediction result reveals that the control of barren and dry surfaces is a critical step for improving the ecological environment quality.
2000年来中国生态状况时空变化格局
[J].
DOI:10.31497/zrzyxb.20210507
[本文引用: 1]
21世纪以来,我国在经济快速发展的同时高度重视生态环境保护,一系列生态修复工程和空间管控措施使生态状况发生了巨大变化;然而目前对于全国生态状况宏观格局的认识仍十分有限。借助 Google Earth Engine(GEE)遥感云计算平台,采用主成分分析方法和MODIS数据构建的绿度NDVI、热度LST、湿度WET和干度NDSI四个指标,生成长时间序列的遥感生态指数RSEI数据集,完整刻画了中国2000年来生态状况的时空连续变化格局。研究发现:在空间格局上,东南沿海地区生态状况优于西北地区;变化趋势上,全国生态状况除上海、西藏和澳门之外均显著改善,RSEI增长最多的三个省份为山西、陕西和河北。进一步采用遥感云计算定量评价了2000年来生态状况变化的宏观格局,以期为国土空间管控和生态保护提供科学支持。
Spatio-temporal changes in remote sensing-based ecological index in China since 2000
[J].DOI:10.31497/zrzyxb.20210507 URL [本文引用: 1]
遥感云计算平台发展及地球科学应用
[J].
Remote sensing cloud computing platform development and earth science application laborative innovation community
[J].DOI:10.11834/jrs.20210447 URL [本文引用: 1]
基于Google Earth Engine的长三角城市群生态环境变化与城市化特征分析
[J].
Analyzing the ecological environment and urbanization characteristics of the Yangtze River Delta Urban Agglomeration based on Google Earth Engine
[J].
基于GEE的祁连山国家公园生态环境质量评价及成因分析
[J].
Eco-environmental quality assessment and cause analysis of Qilian Mountain National Park based on GEE
[J].
Monitoring the effects of land consolidation on the ecological environmental quality based on remote sensing:A case study of Chaohu Lake Basin,China
[J].DOI:10.1016/j.landusepol.2020.104569 URL [本文引用: 1]
Ecological environment quality assessment based on remote sensing data for land consolidation
[J].DOI:10.1016/j.jclepro.2019.118126 URL [本文引用: 1]
Eco-environmental quality assessment in China's 35 Major Cities based on remote sensing ecological index
[J].DOI:10.1109/Access.6287639 URL [本文引用: 1]
基于遥感生态指数的雄安新区生态质量评估
[J].
Ecological quality assessment of Xiongan New Area based on remote sensing ecological index
[J].
基于RSEI模型的生态质量评估及城镇化影响——以南京市为例
[J].
DOI:10.13287/j.1001-9332.202001.030
[本文引用: 1]
利用2000和2017年Landsat5/TM和Landsat8/OLI影像,基于遥感生态指数(RSEI)模型,结合2000—2017年南京市气象观测数据和社会经济数据,对南京及其特色生态区域的生态环境变化进行分析与评估,结果表明: 2000—2017年,南京市RSEI平均值由0.626降至0.618;将RSEI值分成差、较差、一般、良和优5个等级,良好以上面积占比由61.0%降至57.1%,较差以下等级面积占比略有上升;与2000年相比,2017年南京市生态质量变好的面积占比为34.5%,变差的为34.7%,30.8%的面积基本不变,其中,主城区的生态质量明显好转,生态质量好转的面积超过了变差的面积,而新城区和郊区生态质量明显恶化,生态质量变差的面积超过了好转的面积;在3个生态保护区中,紫金山生态质量明显好于老山和江心洲;城镇化率与RSEI呈极显著负相关关系,相关系数达-0.91。城市化进程总体上会对生态环境产生负面影响,但严格的保护和管理措施可以使良好的生态环境得以保持甚至改善。
Ecological quality assessment and the impact of urbanization based on RSEI model for Nanjing,Jiangsu Province,China
[J].
地理探测器:原理与展望
[J].
DOI:10.11821/dlxb201701010
[本文引用: 2]
空间分异是自然和社会经济过程的空间表现,也是自亚里士多德以来人类认识自然的重要途径。地理探测器是探测空间分异性,以及揭示其背后驱动因子的一种新的统计学方法,此方法无线性假设,具有优雅的形式和明确的物理含义。基本思想是:假设研究区分为若干子区域,如果子区域的方差之和小于区域总方差,则存在空间分异性;如果两变量的空间分布趋于一致,则两者存在统计关联性。地理探测器q统计量,可用以度量空间分异性、探测解释因子、分析变量之间交互关系,已经在自然和社会科学多领域应用。本文阐述地理探测器的原理,并对其特点及应用进行了归纳总结,以利于读者方便灵活地使用地理探测器来认识、挖掘和利用空间分异性。
Geodetector:Principle and prospective
[J].
基于生态系统服务和生态系统健康的生态风险评价——以长株潭城市群为例
[J].
Incorporating ecosystem services with ecosystem health for ecological risk assessment:Case study in Changsha-Zhuzhou-Xiangtan urban agglomeration,China
[J].
Spatial pattern and drivers of urbanization in China’s mid-level developing urban agglomeration:A case study of Chang-Zhu-Tan
[J].DOI:10.1016/j.regsus.2020.12.001 URL [本文引用: 1]
经济快速增长区建筑用地变化及其对生态质量的影响——以福建晋江为例
[J].
DOI:10.13287/j.1001-9332.201704.014
[本文引用: 1]
改革开放以来,中国经济增长促进了建筑用地的快速增加,并在很大程度上影响着区域生态质量.本文以东南沿海经济快速增长的福建省晋江市为例,利用遥感技术重点研究经济快速增长导致的建筑用地变化及其对区域生态质量的影响.基于晋江市1996和2015年的Landsat遥感影像,利用建筑用地指数(IBI)提取建筑用地信息,并进行建筑用地变化分析;同时利用遥感生态指数(RSEI)对生态质量进行评价,定量分析城镇建筑用地变化与生态质量变化之间的关系.结果表明: 1996—2015年,晋江市建筑用地面积共增加68.54 km<sup>2</sup>,增幅达45%,建筑用地扩展强度为0.55.建筑用地的增加导致该市生态质量总体下降,RSEI均值从1996年的0.532下降到2015年的0.460,降幅达13.5%;生态优良等级所占面积的比例从1996年的39%下降到 2015年的21%.建筑用地扩展强度与生态质量呈显著负相关关系.
Built-up land change and its impact on ecological quality in a fast-growing economic zone:Jinjiang County,Fujian Province,China
[J].
Detecting ecological changes with a remote sensing based ecological index (RSEI) produced time series and change vector analysis
[J].
DOI:10.3390/rs11202345
URL
[本文引用: 1]
Increasing human activities have caused significant global ecosystem disturbances at various scales. There is an increasing need for effective techniques to quantify and detect ecological changes. Remote sensing can serve as a measurement surrogate of spatial changes in ecological conditions. This study has improved a newly-proposed remote sensing based ecological index (RSEI) with a sharpened land surface temperature image and then used the improved index to produce the time series of ecological-status images. The Mann–Kendall test and Theil–Sen estimator were employed to evaluate the significance of the trend of the RSEI time series and the direction of change. The change vector analysis (CVA) was employed to detect ecological changes based on the image series. This RSEI-CVA approach was applied to Fujian province, China to quantify and detect the ecological changes of the province in a period from 2002 to 2017 using Moderate Resolution Imaging Spectroradiometer (MODIS) data. The result shows that the RSEI-CVA method can effectively quantify and detect spatiotemporal changes in ecological conditions of the province, which reveals an ecological improvement in the province during the study period. This is indicated by the rise of mean RSEI scores from 0.794 to 0.852 due to an increase in forest area by 7078 km2. Nevertheless, CVA-based change detection has detected ecological declines in the eastern coastal areas of the province. This study shows that the RSEI-CVA approach would serve as a prototype method to quantify and detect ecological changes and hence promote ecological change detection at various scales.
Rainfall trend analysis using Mann-Kendall and Sen’s slope estimator test in West Kalimantan
[J].
DOI:10.1088/1755-1315/893/1/012006
[本文引用: 1]
Climate change has been a prominent issue in the last decade. Climate change on a global scale does not necessarily have the same effect in different regions. Rainfall is a crucial weather element related to climate change. Rainfall trends analysis is an appropriate step in assessing the impact of climate change on water availability and food security. This study examines rainfall variations and changes at West Kalimantan, focusing on Mempawah and Kubu Raya from 2000-2019. The Mann-Kendall (MK) and Sen's Slope estimator test, which can determine rainfall variability and long-term monotonic trends, were utilized to analyze 12 rainfall stations. The findings revealed that the annual rainfall pattern prevailed in all locations. Mempawah region tends to experience a downward trend, while Kubu Raya had an upward trend. However, a significant trend (at 95% confidence level) was identified in Sungai Kunyit with a slope value of -33.20 mm/year. This trend indicates that Sungai Kunyit will become drier in the future. The results of monthly rainfall analysis showed that significant upward and downward trends were detected in eight locations. Rainfall trends indicate that climate change has occurred in this region.
增暖背景下中国东北地区极端降水事件的演变特征
[J].
Evolvement of precipitation extremes in Northeast China on the background of climate warming
[J].
DOI:10.13249/j.cnki.sgs.2008.02.224
[本文引用: 1]
Determination of the threshold by Gamma distribution function and study on spatial and temporal change of precipitation extremes are based on the daily precipitation data of 93 stations during the period 1959-2002 in Northeast China. The main results are summarized as follows: The precipitation extremes’ thresholds decreased gradually from the southeast littoral areas to the northwestern inland. Precipitation extremes were concentrated in June-September, and the increasing was a catastrophe during the period 1985-2002. The probability of the precipitation extremes successively occurred was greater, in which the neighbouring extremes separated by a time gap of 1-5 days was 23.7%. The total extremes increased especially in the lower reaches of the Songhua River and the Mudanjiang River,and the upper reaches of the Liaohe River,as the same with the precipitantion extreme with the time gap of 1-5 days.
Geographical detectors-based health risk assessment and its application in the neural tube defects study of the Heshun Region,China
[J].DOI:10.1080/13658810802443457 URL [本文引用: 1]
拉萨城市圈1994—2017年生态质量的时空动态监测及驱动力分析
[J].
DOI:10.18306/dlkxjz.2022.03.007
[本文引用: 1]
拉萨城市圈是西藏自治区生态环境与城镇化作用突出的区域,近年来已经出现草场退化、土壤沙化等生态环境问题,对该区域生态质量状况的监测迫在眉睫,但目前又缺少对该区域精细尺度的生态质量状况研究。鉴于此,论文利用Google Earth Engine遥感大数据平台的并行计算优势,基于Landsat TM/ETM+卫星影像,通过遥感生态指数(remote sensing ecological index,RSEI)方法监测了拉萨城市圈1994—2017年生态质量的时空变化,深入分析了生态质量变化的气候驱动因子和土地利用转移因子,探索了气候综合驱动的时空分布特征及其变化。结果表明:① 在1994—2017年期间,拉萨城市圈的生态质量良好,在空间上呈现自西南向东北逐渐降低趋势,生态质量整体有改善趋势,改善比重为45.98%;② 热度是RSEI的内部主控因素,对RSEI产生负向影响,体现了气候变暖对研究区生态质量的抑制作用;③ 蒸汽压亏缺、气候水分亏缺是生态质量变化的主要气候驱动因子,草地向其他用地的转移是主要的土地利用驱动因子;④ 气候综合驱动在研究期间整体有减弱趋势,分布格局自西南向东北逐渐增强。论文对拉萨城市圈生态质量状况的监测及其驱动力的深入研究,能够为高原生态环境的保护和西藏地区城镇化的健康发展提供科学指引。
Spatiotemporal dynamics and driving factor analysis of ecological quality change in the Lhasa urban circle from 1994 to 2017
[J].
DOI:10.18306/dlkxjz.2022.03.007
[本文引用: 1]
The Lhasa urban circle is a prominent area of ecological environment change and urbanization in the Tibet Autonomous Region. In recent years, there have been ecological and environmental problems such as grassland degradation and soil desertification. The monitoring of the ecological quality of the region is urgent, but currently there is a lack of fine-scale monitoring of ecological quality status in the area. In view of this gap, by taking advantage of the parallel computing capacity of the Google Earth Engine remote sensing big data platform and based on Landsat TM/ETM+ satellite imagery, this study used the remote sensing ecological index method to monitor the temporal and spatial changes of the ecological quality of the Lhasa urban circle from 1994 to 2017, analyzed the climatic and land use transfer factors of ecological quality changes, and explored the temporal and spatial distribution characteristics of comprehensive climate driven ecological quality changes. The results show that: 1) During 1994-2017, the ecological quality of the Lhasa urban circle was good, showing a gradual decrease in space from the southwest to the northeast, and the overall ecological quality showed an improving trend, with an improvement proportion of 45.98%. 2) Heat has been the main internal controlling factor of ecological quality changes, which had a negative impact. 3) Vapor pressure deficit and climate water deficit have been the main climatic driving factors of ecological quality changes, and the transfer of grassland has been the main driving factor of land use. 4) Comprehensive climatic driving force has weakened in the past 20 years, and the impact has gradually increased from the southwest to the northeast. The in-depth analysis of this study may provide a scientific guidance for the protection of the plateau ecological environment and the healthy development of urbanization in Tibet.
