Spatio-temporal evolution and influencing factors of ecological environment quality in the Changsha-Zhuzhou-Xiangtan urban agglomeration
LI Guangzhe1,2(), WANG Hao1,2(), CAO Yinxuan2, ZHANG Xiaoyu2, NING Xiaogang1,2
1. College of Geodesy and Geomatics, Shandong University of Science and Technology, Qingdao 266590, China 2. Chinese Academy of Surveying & Mapping, Beijing 100036, China
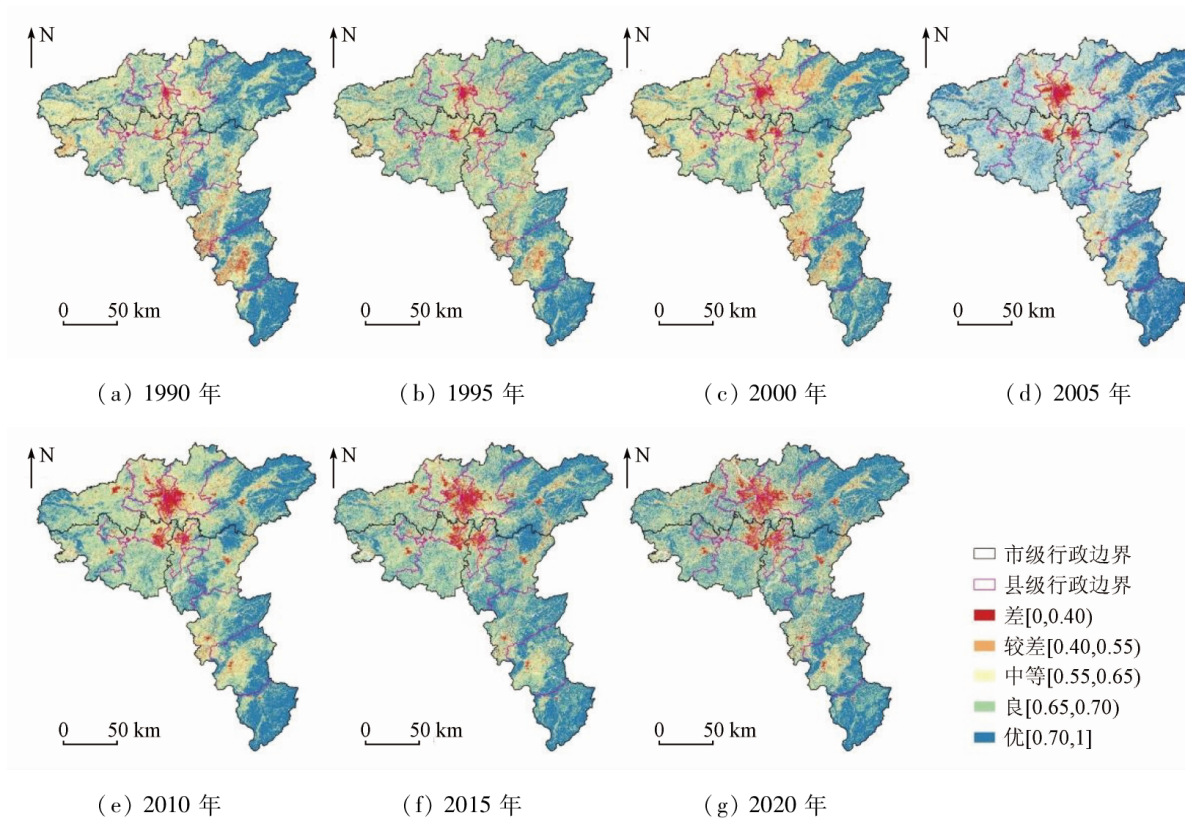
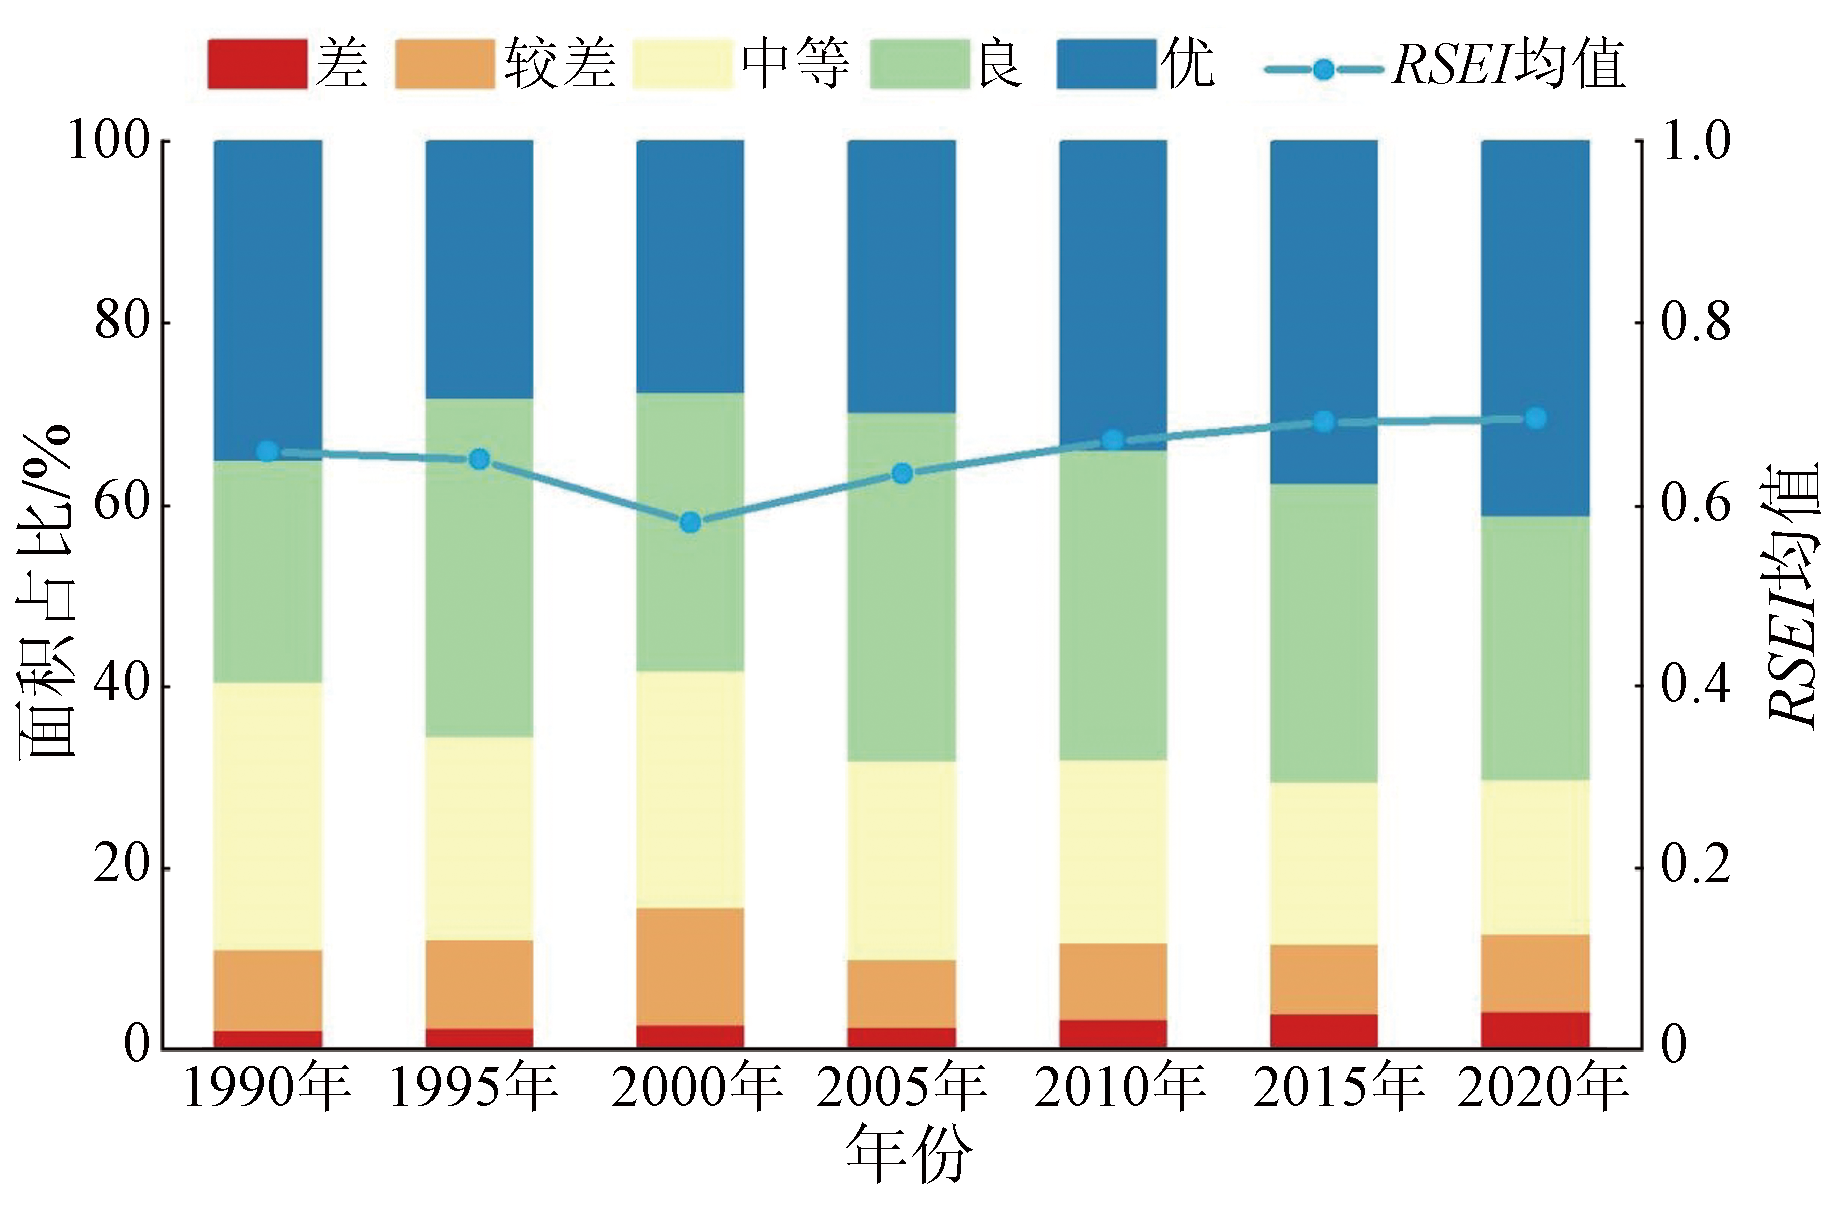
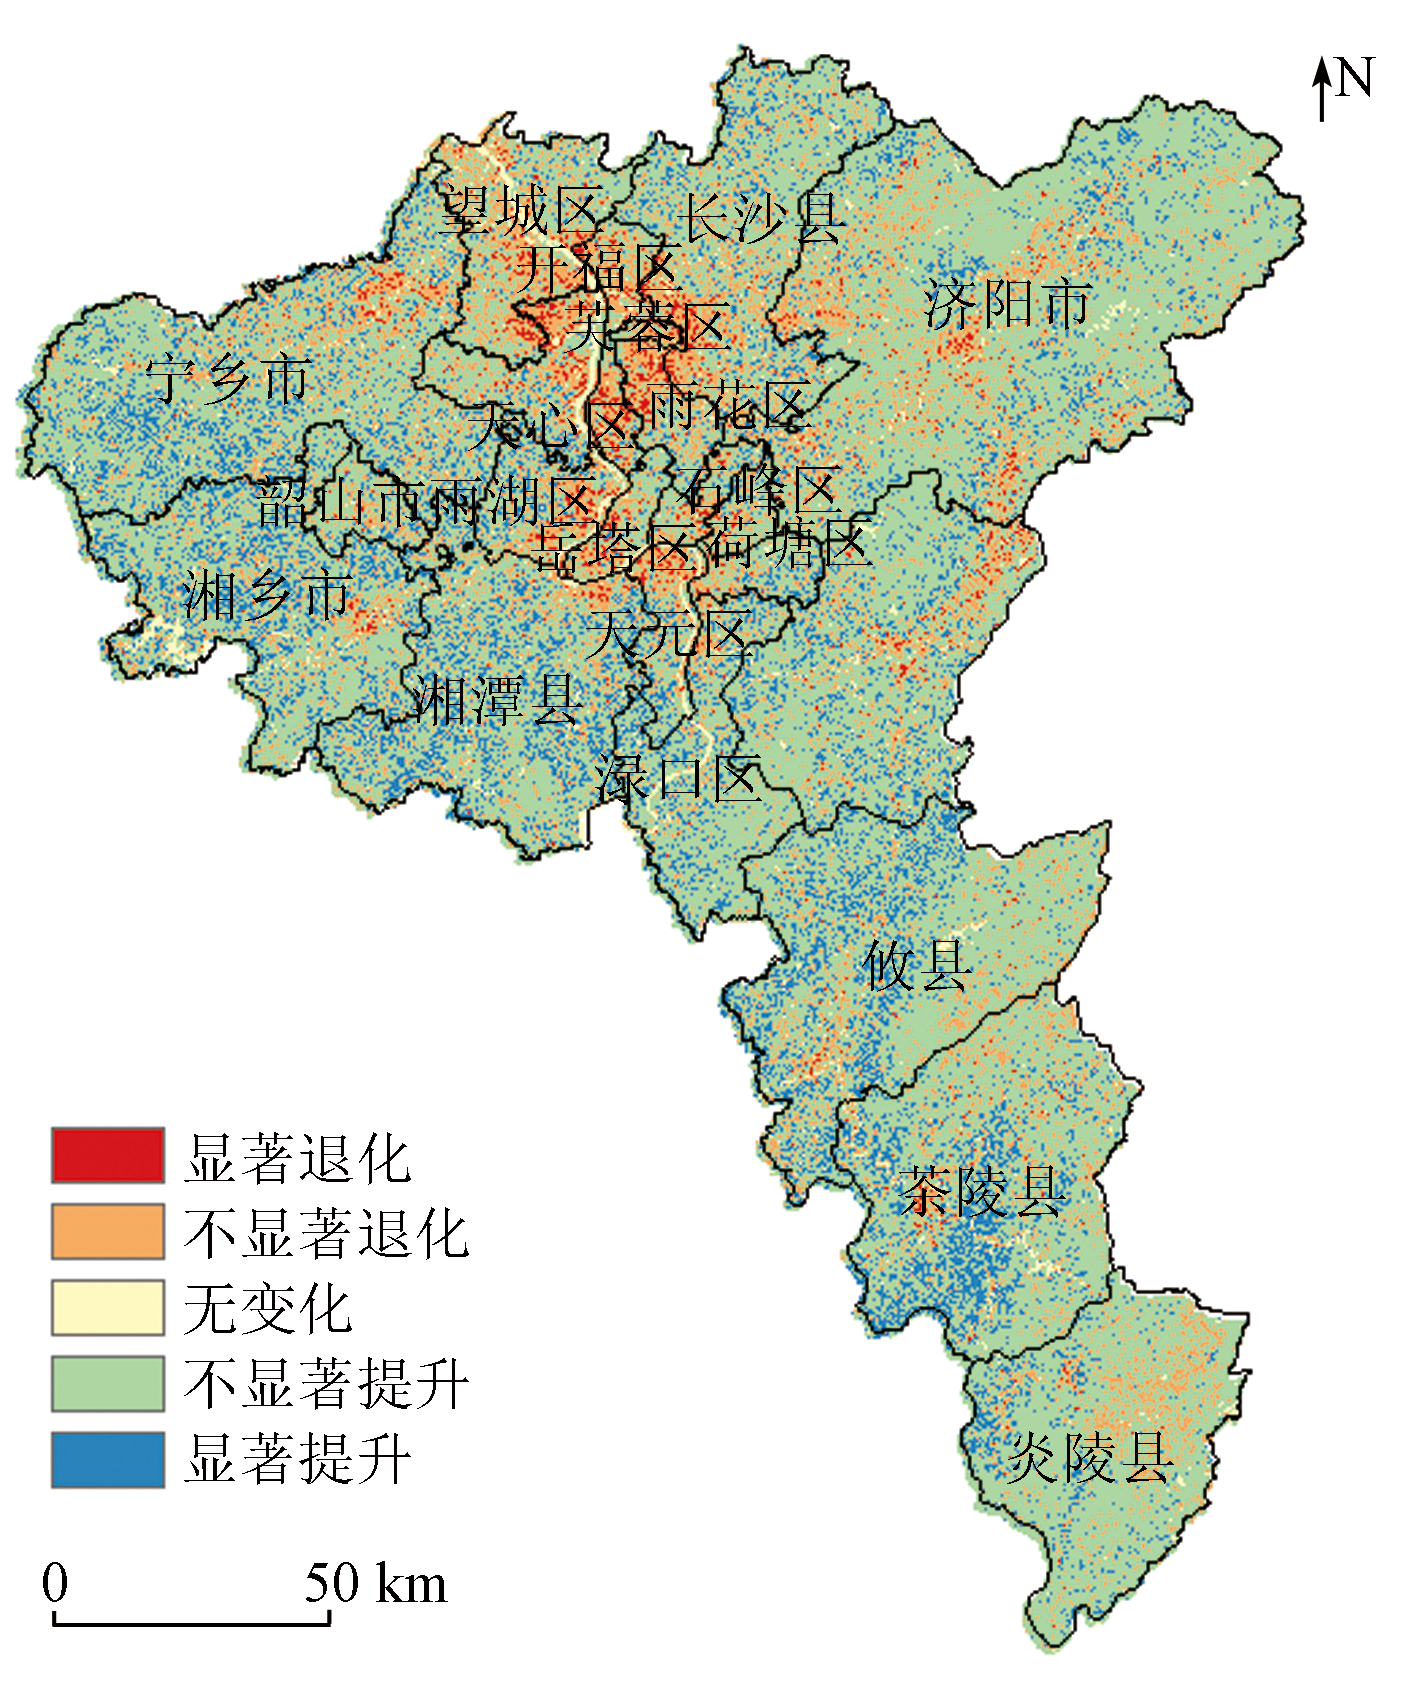
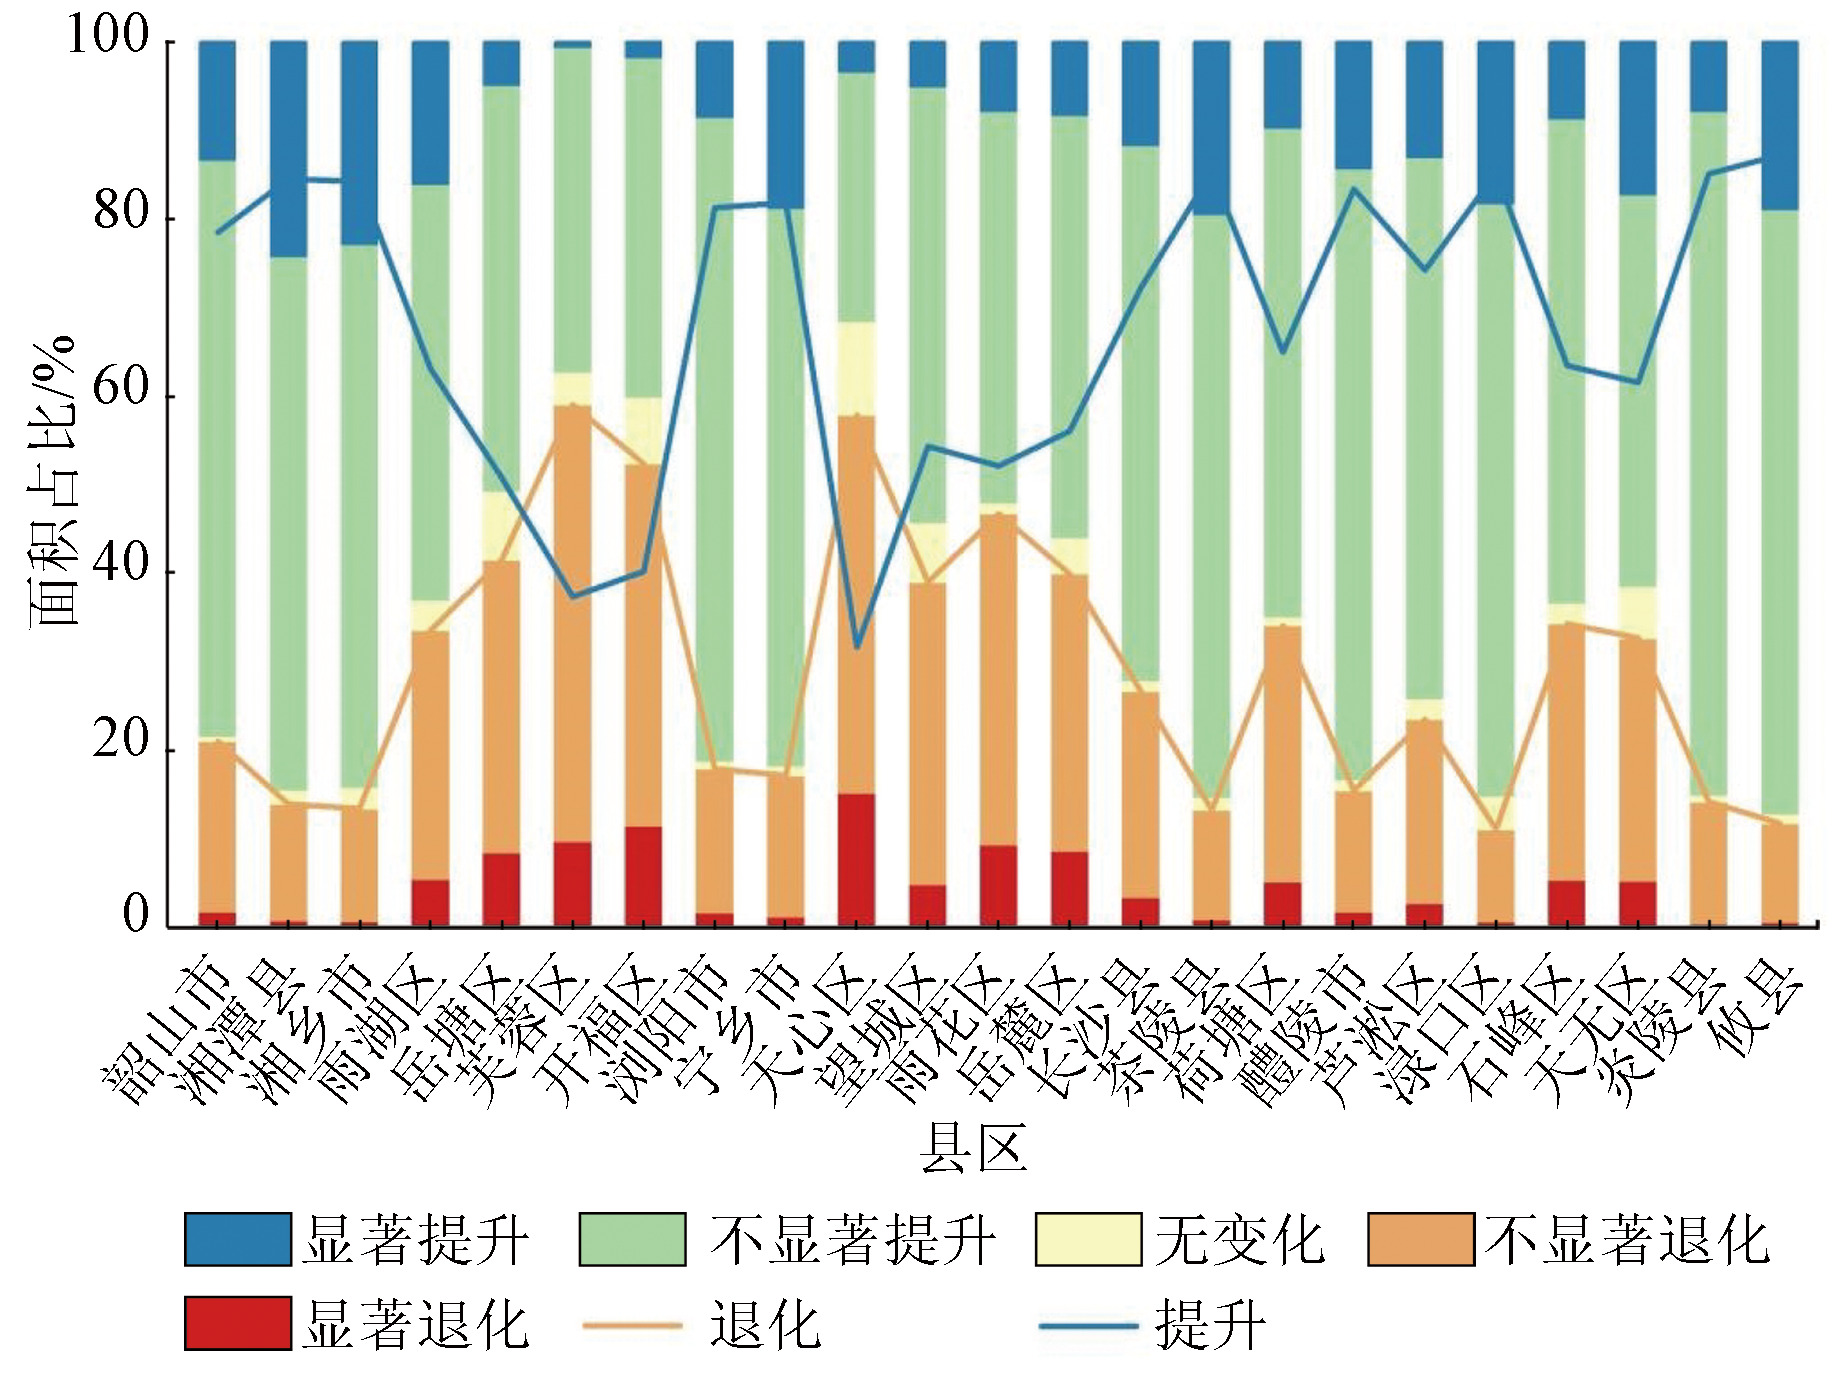
Accurately identifying the evolutionary trend and influencing factors of ecological environment quality in new urban agglomerations holds crucial significance for scientifically guiding urbanization and achieving sustainable development. Existing research on the spatio-temporal evolutionary characteristics of ecological environment quality in new urban agglomerations ignored the interactions of multiple factors on ecological environment quality. Based on the Google Earth Engine (GEE) platform, and long-time-series Landsat TM/OLI remote sensing images as the fundamental data source, this study delved into the spatio-temporal variations of ecological environment quality in the Changsha-Zhuzhou-Xiangtan urban agglomeration from 1990 to 2020 using methods including the remote sensing ecological index (RSEI), Sen’s slope estimator, and Mann-Kendall test. Moreover, the geographical detector was employed to quantitatively measure the effects of various factors on the urban agglomeration’s spatial heterogeneity. The results indicate that the Changsha-Zhuzhou-Xiangtan urban agglomeration exhibited generally high ecological environment quality, with a spatial distribution pattern of higher quality in marginal areas and lower quality in core areas. The average proportion of areas with ecological environment quality graded as “excellent” and “good” exceeds 60% in the urban agglomeration. The sustainable development strategy altered the urban sprawl in this urban agglomeration, leading to a decline followed by an increase in RSEI, with an inflection point in 2000. From 1990 to 2020, the ecological environment quality significantly deteriorated in central urban areas while improvement was observed in non-central urban areas. Physical and geographical conditions significantly influenced the ecological environment quality of the urban agglomeration in the early stages. With socio-economic progression, the influence of socio-economic factors like nighttime lighting on ecological environment quality gradually intensified, assuming a dominant role over time. Besides, the interactions among factors significantly enhanced the effects of individual factors on ecological environment quality. Before 2010, the interactions between human and natural factors exerted considerable influences on the ecological environment. After 2015, the interactions among human factors yielded more pronounced effects on ecological environment quality. These findings serve as a foundational guide for the integrated high-quality development of the Changsha-Zhuzhou-Xiangtan urban agglomeration and a reference for the advancement of other comparable urban agglomerations.
李光哲, 王浩, 曹银璇, 张晓宇, 宁晓刚. 长株潭城市群生态环境质量时空演变及影响因素分析[J]. 自然资源遥感, 2023, 35(4): 244-254.
LI Guangzhe, WANG Hao, CAO Yinxuan, ZHANG Xiaoyu, NING Xiaogang. Spatio-temporal evolution and influencing factors of ecological environment quality in the Changsha-Zhuzhou-Xiangtan urban agglomeration. Remote Sensing for Natural Resources, 2023, 35(4): 244-254.
Bao C, He D M. Scenario modeling of urbanization development and water scarcity based on system dynamics:A case study of Beijing-Tianjin-Hebei urban agglomeration,China[J]. International Journal of Environmental Research and Public Health, 2019, 16(20):3834.
doi: 10.3390/ijerph16203834
[2]
Wan J J, Li Y X, Ma C C, et al. Measurement of coupling coordination degree and spatio-temporal characteristics of the social economy and ecological environment in the Chengdu-Chongqing urban agglomeration under high-quality development[J]. International Journal of Environmental Research and Public Health, 2021, 18(21):11629.
doi: 10.3390/ijerph182111629
Fang C L, Zhang G Y, Xue D S. High-quality development of urban agglomerations in China and construction of science and technology collaborative innovation community[J]. Acta Geographica Sinica, 2021, 76(12):2898-2908.
doi: 10.11821/dlxb202112003
Li Q, Yao H Q. The research of air pollution treatment efficiency and its influencing factors in the Beijing-Tianjin-Hebei urban agglomeration[J]. Ecological Economy, 2018, 34(8):188-192.
[5]
Estoque R C, Murayama Y, Myint S W. Effects of landscape composition and pattern on land surface temperature:An urban heat island study in the megacities of Southeast Asia[J]. Science of the Total Environment, 2017, 577:349-359.
doi: 10.1016/j.scitotenv.2016.10.195
Ouyang X, Zhu X. Spatio-temporal characteristics of urban land expansion in Chinese urban agglomerations[J]. Acta Geographica Sinica, 2020, 75(3):571-588.
doi: 10.11821/dlxb202003010
[7]
Ji J W, Wang S X, Zhou Y, et al. Spatiotemporal change and landscape pattern variation of eco-environmental quality in Jing-Jin-Ji urban agglomeration from 2001 to 2015[J]. IEEE Access, 2020, 8:125534-125548.
doi: 10.1109/Access.6287639
Liang L W, Wang Z B, Fang C L, et al. Spatiotemporal differentiation and coordinated development pattern of urbanization and the ecological environment of the Bejjing-Tianjin-Hebei urban agglomeration[J]. Acta Ecologica Sinica, 2019,39:(4) 1212-1225.
Li P X, Chen W, Zou L, et al. Eco-environmental effect of land use/cover change (LUCC) based on integrated ecological space:A case of Yangtze River Delta[J]. Acta Scientiae Circumstantiae, 2021. 41(10):3905-3915.
Wang Y, Zhao Y H, Wu J S. Dynamic monitoring of long time series of ecological quality in urban agglomerations using Google Earth Engine cloud computing:A case study of the Guangdong-Hong Kong-Macao Greater Bay Area,China[J]. Acta Ecologica Sinica, 2020, 40(23):8461-8473.
Fang C L, Song J T, Zhang Q, et al. The formation,development and spatial heterogeneity patterns for the structures system of urban agglomerations in China[J]. Acta Geographica Sinica, 2005, 60(5):827-840.
Wang T D, Cao J X, Zhao Y H, et al. Evaluation of land ecosystem health in Shaanxi Province,Northwest China based on PSR Model[J]. Chinese Journal of Applied Ecology, 2021, 32(5):1563-1572.
Wang X J, Wu J X, Jiang H P. Dynamic assessment and trend prediction of rural eco-environmental quality in China[J]. Journal of Natural Resources, 2017, 32(5):864-876.
Niu Y H, Jiao S, Cao T T, et al. Urban multi-hazard risk assessment and planning response based on PSR model[J]. Urban Development Studies, 2022, 29(4):39-48.
Meng Y, Zhao G X, Cheng J N, et al. Evaluation of the ecological environment of Shandong Province using MODIS data and GIS platform urban agglomeration[J]. Chinese Journal of Eco-Agriculture, 2008(4):1020-1024.
Cheng J N, Zhao G X, Li H, et al. Dynamic changes and evaluation of land ecological environment status based on RS and GIS technique[J]. Transactions of the Chinese Society of Agricultural Engineering, 2008, 24(11):83-88.
Song H M, Xue L. Dynamic monitoring and analysis of ecological environment in Weinan City,Northwest China based on RSEI model[J]. Chinese Journal of Applied Ecology, 2016, 27(12):3913-3919.
Li Y, Zhang G Q, Lin T, et al. The spatiotemporal changes of remote sensing ecological index in towns and the influencing factors:A case study of Jizhou District,Tianjin[J]. Acta Ecologica Sinica, 2022, 42(2):474-486.
Wang S Y, Zhang X X, Zhu T, et al. Assessment of ecological environment quality in the Changbai Mountain Nature Reserve based on remote sensing technology[J]. Progress in Geography, 2016, 35(10):1269-1278.
doi: 10.18306/dlkxjz.2016.10.010
He Y L, You N S, Cui Y P, et al. Spatio-temporal changes in remote sensing-based ecological index in China since 2000[J]. Journal of Natural Resources, 2021, 36(5):1176-1185.
doi: 10.31497/zrzyxb.20210507
Fu D J, Xiao H, Su F Z, et al. Remote sensing cloud computing platform development and earth science application laborative innovation community[J]. National Remote Sensing Bulletin, 2021, 25(1):220-230.
doi: 10.11834/jrs.20210447
Zheng Z H, Wu Z F, Chen Y B, et al. Analyzing the ecological environment and urbanization characteristics of the Yangtze River Delta Urban Agglomeration based on Google Earth Engine[J]. Acta Ecologica Sinica, 2021, 41(2):717-729.
Zhang H, Song J Y, Li M, et al. Eco-environmental quality assessment and cause analysis of Qilian Mountain National Park based on GEE[J]. Chinese Journal of Ecology, 2021, 40(6):1883-1894.
[25]
Guo B B, Fang Y L, Jin X B, et al. Monitoring the effects of land consolidation on the ecological environmental quality based on remote sensing:A case study of Chaohu Lake Basin,China[J]. Land Use Policy, 2020, 95(C):104569.
doi: 10.1016/j.landusepol.2020.104569
[26]
Shan W, Jin X B, Ren J, et al. Ecological environment quality assessment based on remote sensing data for land consolidation[J]. Journal of Cleaner Production, 2019, 239:118126.
doi: 10.1016/j.jclepro.2019.118126
[27]
Yue H, Liu Y, Li Y, et al. Eco-environmental quality assessment in China's 35 Major Cities based on remote sensing ecological index[J]. IEEE Access, 2019, 7:51295-51311.
doi: 10.1109/Access.6287639
Yang J Y, Wu T, Pan X Y, et al. Ecological quality assessment of Xiongan New Area based on remote sensing ecological index[J]. Chinese Journal of Applied Ecology, 2019, 30(1):277-284.
Hang X, Luo X C, Cao Y, et al. Ecological quality assessment and the impact of urbanization based on RSEI model for Nanjing,Jiangsu Province,China[J]. Chinese Journal of Applied Ecology, 2020, 31(1):219-229.
Ouyang X, Zhu X, He Q Y. Incorporating ecosystem services with ecosystem health for ecological risk assessment:Case study in Changsha-Zhuzhou-Xiangtan urban agglomeration,China[J]. Acta Ecologica Sinica, 2020, 40(16):5478-5489.
[32]
He Y H, Lin Y, Zhou G H, et al. Spatial pattern and drivers of urbanization in China’s mid-level developing urban agglomeration:A case study of Chang-Zhu-Tan[J]. Regional Sustainability, 2021, 2(1):83-97.
doi: 10.1016/j.regsus.2020.12.001
Shi T T, Xu H Q, Tang F. Built-up land change and its impact on ecological quality in a fast-growing economic zone:Jinjiang County,Fujian Province,China[J]. Chinese Journal of Applied Ecology, 2017, 28(4):1317-1325.
[34]
Xu H Q, Wang Y F, Guan H D, et al. Detecting ecological changes with a remote sensing based ecological index (RSEI) produced time series and change vector analysis[J]. Remote Sensing, 2019, 11(20):2345.
doi: 10.3390/rs11202345
[35]
Aditya F, Gusmayanti E, Sudrajat J. Rainfall trend analysis using Mann-Kendall and Sen’s slope estimator test in West Kalimantan[J]. IOP Conference Series:Earth and Environmental Science, 2021, 893(1):012006.
doi: 10.1088/1755-1315/893/1/012006
Yang S Y, Sun F H, Ma J Z. Evolvement of precipitation extremes in Northeast China on the background of climate warming[J]. Scientia Geographica Sinica, 2008, 28(2):224-228.
doi: 10.13249/j.cnki.sgs.2008.02.224
[37]
Wang J F, Li X H, Christakos G, et al. Geographical detectors-based health risk assessment and its application in the neural tube defects study of the Heshun Region,China[J]. International Journal of Geographical Information Science, 2010, 24(1):107-127.
doi: 10.1080/13658810802443457
Kong L L, Feng X F, Wu S, et al. Spatiotemporal dynamics and driving factor analysis of ecological quality change in the Lhasa urban circle from 1994 to 2017[J]. Progress in Geography, 2022, 41(3):437-450.
doi: 10.18306/dlkxjz.2022.03.007
 2023, Vol. 35
  ), 王浩1,2(