

0 引言
获取NPP的方法有很多: 站点实测法、遥感数据产品以及模型模拟等。建立实测站点受研究区域条件影响较大并且只适用于小范围研究区域,人力耗费较大。MODIS 的NPP产品(MOD17A3)目前是广泛被认可和应用的数据产品,但是此产品时间分辨率为1 a,不适合研究较小时间尺度上的NPP情况,且空间分辨率为500 m×500 m,数据缺失像元较多,对于小流域尺度的NPP空间异质性分析适用性不强。随着遥感技术的不断发展,遥感资料覆盖范围广,更新速度快,遥感数据结合生态模型进行NPP的估算成为当前的研究热点之一,例如BEPS-Terrainlab模型[4]、InIEC模型[5]、BIOME-BGC[6]模型等。其中BEPS-Terrainlab模型是BEPS生态模型[7]和Terrainlab分布式水文模型[8]的耦合,是遥感驱动的生态过程模型,在实践运用的过程中形成了不同的版本[9]。BEPS-Terrainlab V2.0在模拟水文循环过程时不仅考虑了地表覆盖、植被结构、土壤特性等地理因素,同时还引入太阳辐射、降水等气候因素对结果的影响; 另外考虑到地形因素以及阴阳叶对生态水文循环的影响,输出数据的空间分辨率为30 m×30 m,以日为时间步长,对于小流域尺度生态水文参数(如NPP,ET等)的时空演变分析更具有适用性。
犟河流域是南水北调水源保护的核心区域,本文在进行模型模拟精度分析的基础上,基于BEPS-Terrainlab V2.0模型对流域1986—2017年NPP的时空分布特征进行模拟,获得流域高分辨率的NPP分布数据,并探讨NPP时空演变特征及其对地形、土地覆盖、气候变化等因子的环境响应,模拟结果对流域植被保护、生态恢复以及碳循环特征等均具有重要的借鉴意义。
1 研究区概况
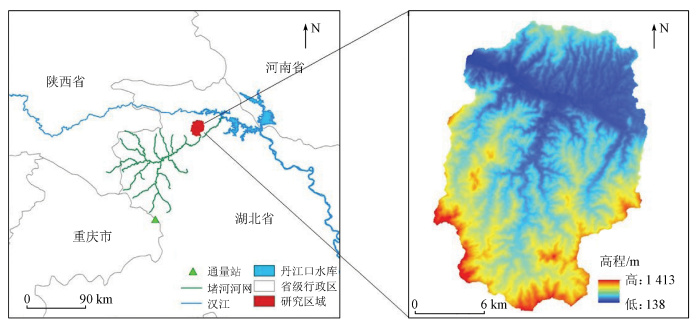
犟河是堵河的一级支流,河流总长50 km,发源于张家湾区的花果街道,共有大小支流22条,于黄龙镇东湾村处与堵河进行交汇,随堵河一起流入丹江口水库。犟河流域(图1)位于湖北省十堰市城区西部,地理坐标为E110°33'50″~110°42'9″,N32°27'27″~32°42'60″,流域面积326 km2,整体地势西南高、东北低,流域海拔范围为139~1 441 m。流域位于亚热带季风区,降雨以每年6—9月为主,年降雨量800~1 000 m。植被覆盖度较高,森林覆盖范围较广,主要植被类型有暖温带落叶阔叶林、暖温带常绿针叶林、针阔混交林等。
图1
2 数据与方法
2.1 BEPS-TerrainlabV2.0模型原理
1)将冠层分为阳叶与阴叶分别计算植被冠层叶面积指数,公式为:
式中: LAI为叶面积指数;
2)计算植被冠层总初级生产力
式中:
3)计算NPP,NPP通过GPP扣除植物自养呼吸(
式中:
2.2 数据源及其预处理
1)高程数据。数据源自地理空间数据云(
2)遥感数据。数据源自美国地质调查局官网(
在ENVI中使用波段运算得到RVI,再通过此方程计算LAI 。
3)气象数据。获取到的十堰市气象数据包括1986—2017逐年间日尺度的最高温、最低温、平均气温以及降水。使用Magnus-Tentens近似法将缺少的露点温度补充完整。研究区域所属地级市无太阳辐射数据,使用反距离加权法将研究区域周围4个方向的城市气象站(安康、侯马、南阳、宜昌)的太阳辐射数据进行加权平均,得到的数据来代替研究区域的辐射数据输入模型。
4)土壤数据。野外采集土壤样品,通过马尔文3000高分辨激光粒度仪测量土壤粒度,在ArcGIS中通过克里金插值绘制研究区域内每种粒度的分布图,在ENVI中通过波段运算将砂土、壤质砂土、砂质壤土和粉砂壤土4种不同土壤质地像元分别赋值为10,20,30和40。
2.3 研究方法
2.3.1 一元线性回归分析法
本研究采用一元线性回归分析法逐像元对犟河流域植被净初级生产力在1986—2017年间变化趋势进行分析,计算公式[13]为:
式中:
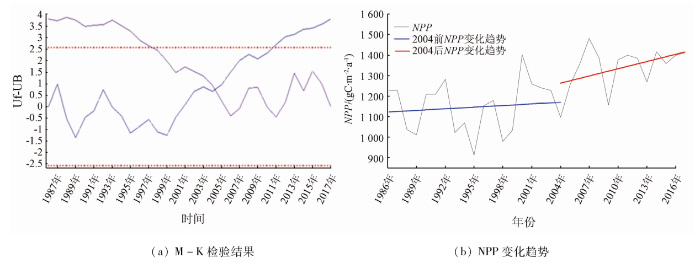
2.3.2 M-K突变检验
M-K检测可判定时间序列中有无突变,若有,则判定突变发生的时间[14]。通过定义UF,UB这2个统计量来分析样本时间序列的变化趋势,UF>0说明变化趋势持续增长,UF与UB相交于置信区间 [-1.96,1.96]内,说明该交点对应年份的相关数据在变化趋势上产生突变情况。
2.3.3 线性回归分析
线性回归的过程就是把各个自变量和因变量的值建立回归方程后,通过逐步迭代与拟合,找出回归方程式中的各个系数,构造出一个函数式,使用线性回归参数判断自变量和因变量的关系,由于本研究自变量较多,故而使用偏相关系数来进行相关性分析,能够在一定程度上减少自变量直接的相关性对分析结果的影响。
3 结果与分析
3.1 模型精度分析
3.1.1 通量站数据验证
图2
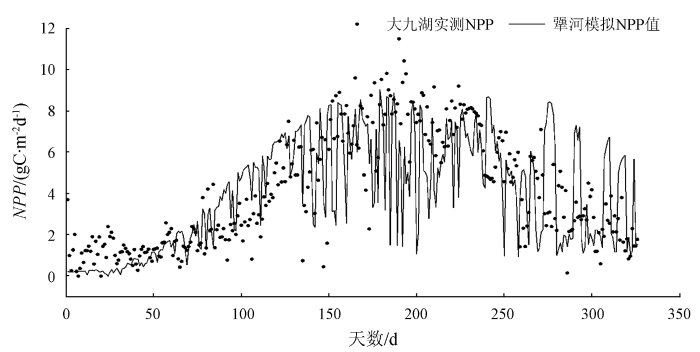
图2
犟河流域模拟NPP与大九湖实测NPP数据对比图
Fig.2
Comparison of simulated NPP data in the Jianghe River basin and measured NPP data in Dajiuhu
3.1.2 NPP产品数据交叉验证
图3
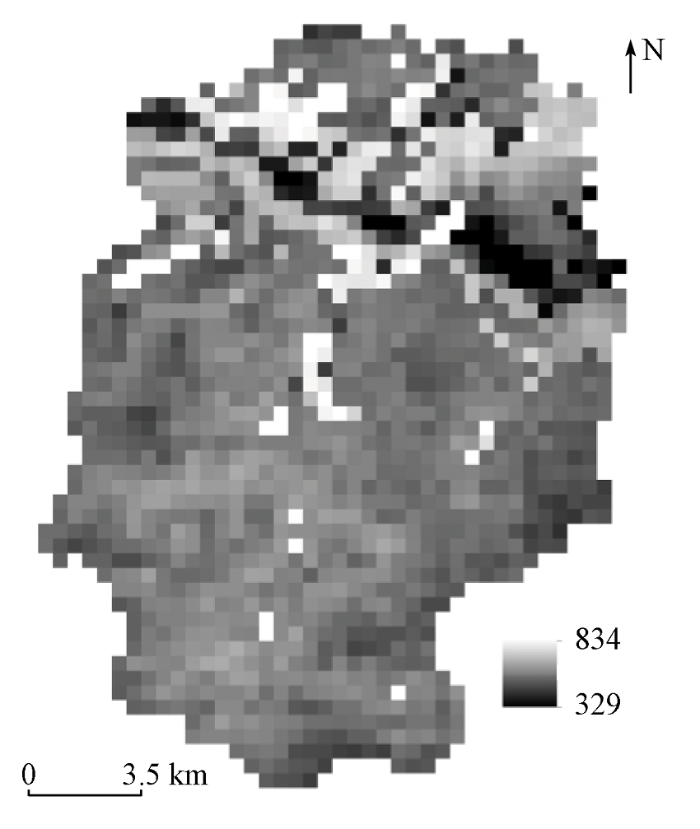
表1 BEPS-Terrainlab V2.0模型模拟土地覆盖类型NPP数据与其他模拟或实测值对比
Tab.1
3.2 时间变化规律
3.2.1 时间分析
模型运行输出后得到的是1986—2017年间日尺度的NPP数据,依据不同的时间单位,可以从年尺度和日尺度上2个方面上对NPP进行时间变化的分析。以日为时间尺度,用来描述NPP在一年内的变化,将具体年份的年内变化进行汇总得到NPP年内变化的多年平均值,见图4。
图4
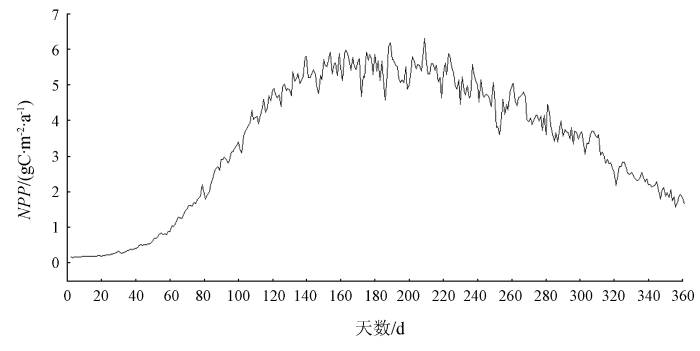
图4
犟河流域NPP年内多年平均变化
Fig.4
Multi-year average change of NPP in the Jiang River Basin
可以发现NPP年内多年平均随时间变化的走向呈单峰式变化,先升后降。冬季(1—60天、330—365天)值最低,春季(60—150天)呈上升的趋势,夏季(150—240天)时达到了峰值,也是NPP数值最高的阶段,秋季(240—330天)NPP呈缓慢下降的趋势。从NPP变化的趋势可以看出,在夏季(150—240天)内有突然下降的波动,并且在秋季(240—330天)存在短暂波动较大的情况。
以年为时间尺度,统计1986—2017多年年总NPP,反映多年来研究区域NPP变化的情况,见图5。
图5
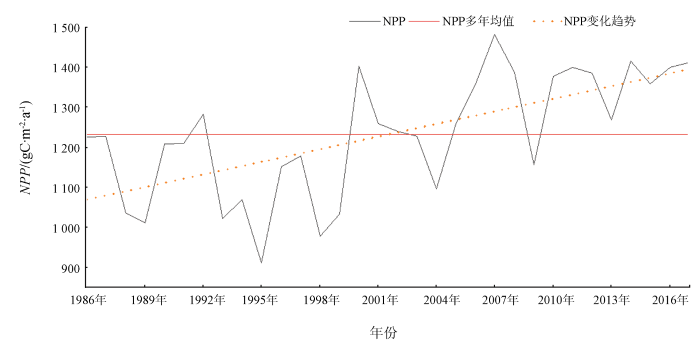
由图5可知,年总NPP大体变化趋势为波动上升,最低值出现在1995年,NPP值为911.86 gC·m-2·a-1,最高值出现在2007年,值为1 482.28 gC·m-2·a-1,1986—2017年间NPP的多年平均值为1 232.70 gC·m-2·a-1。
3.2.2 突变检验
图6
3.3 空间变化规律
图7
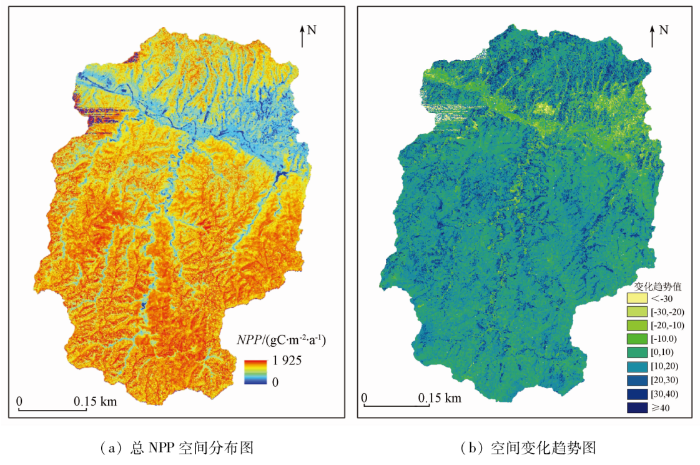
图7
犟河流域多年年总NPP空间分析
Fig.7
Spatial analysis of multi-year annual total NPP in the Jianghe River basin
多年NPP在空间上分布呈现南高北低的分布,南部最高可达到1 925 gC·m-2·a-1,在主流域附近NPP的值最低,受地势及不同土地覆盖类型的影响,NPP的分布在空间上呈现差异性,图7(b)为1986—2017年NPP值在空间上变化的趋势,在大部分区域NPP值都呈现增加的趋势,在河流区域变化不大。
3.4 环境影响因子分析
3.4.1 土地覆盖因子
图8
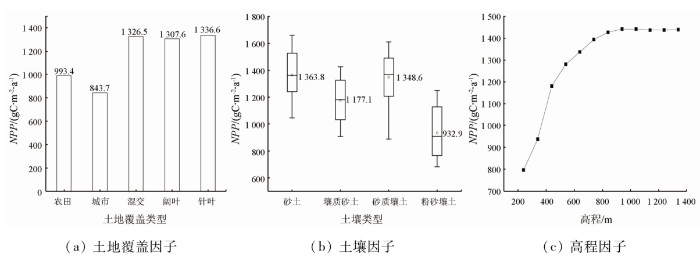
图8
不同环境因子的NPP分布情况
Fig.8
Distribution of NPP for different environmental factors
3.4.2 土壤因子
将研究区NPP分布按照不同土壤质地进行划分,绘制箱线图如图8(b),犟河流域不同土壤类型平均NPP按大小排序为: 砂土(1 363.8 gC·m-2·a-1)>砂质壤土(1 177.1 gC·m-2·a-1)>壤质砂土(1 348.6 gC·m-2·a-1)>粉砂壤土(932.9 gC·m-2·a-1)。
3.4.3 地形因子
将研究区NPP分布按照不同高程进行划分如图8(c),得到年总NPP随高程每增加100 m的变化趋势,NPP随着海拔的上升而增加,在100~900 m呈上升趋势,在高程为900 m时达到最大值而后变化趋势逐渐趋于平稳,这与植被的垂直分布有关,在高程为900~1 300 m时,土地覆盖类型为针叶林和混交林,根据前文中已知混交林和针叶林的NPP值较高于其他土地覆盖类型。
3.4.4 气象因子
影响NPP的变化的气象因素有很多,诸如温度、辐射以及降水等,采用线性回归分析分析来探讨NPP与这些气象因子的相关性,可以进行较长尺度下的气象影响因素的分析。在SPSS中添加因变量年内NPP以及年际NPP数据和自变量气温、降水、辐射、风速、LAI等自变量数据,对这些数据进行线性回归分析,由于自变量间可能存在互相影响,探讨各自变量对于因变量的影响力大小时,选择以偏相关系数大小为判断依据,以标准化回归系数作为参考(表2)。
表2 日尺度NPP线性回归方程参数
Tab.2
| 日尺度 NPP | 回归系数 (Beta) | 标准化回 归系数 | 显著性 (P值) | 偏相关 系数 |
|---|---|---|---|---|
| 温度 | 0.135 | 0.496 | <0.001 | 0.637 |
| 降水 | -0.004 | -0.011 | 0.035 | -0.020 |
| 辐射 | <0.001 | 0.522 | <0.001 | 0.647 |
| 风速 | -0.009 | -0.003 | 0.589 | -0.005 |
| 常量 | -0.269 | — | <0.001 | — |
表3 年尺度NPP线性回归方程参数
Tab.3
| 年尺度 GPP | 回归系 数(Beta) | 标准化回 归系数 | 显著性 (P值) | 偏相关 系数 |
|---|---|---|---|---|
| 温度 | 26.587 | 0.094 | 0.515 | 0.134 |
| 降水 | 36.627 | 0.131 | 0.130 | 0.305 |
| 辐射 | 0.014 | 0.094 | 0.382 | 0.179 |
| 风速 | 14.530 | 0.041 | 0.720 | 0.074 |
| LAI | 224.511 | 0.814 | <0.001 | 0.874 |
| 常量 | -136.813 | — | 0.728 | — |
由表3可知,偏相关系数最高的是LAI,P值小于0.001,属于极显著正相关,降水偏相关系数为0.305,影响力有所提升; 温度对年尺度NPP的影响显著降低,其他因素对年尺度NPP的影响都较小,偏相关系数较低且P值较大。
4 结论
本研究基于遥感以及气象等数据结合BEPS-TerrainlabV2.0模型对湖北省十堰市犟河流域1986—2017年NPP进行分析,讨论了其时空分布以及与环境因子的相关性分析,结果表明:
1)与相近地区通量站数据以及MODIS数据进行分析,验证了该模型对于较小空间尺度的适用性,同时与其他数据产品进行交叉验证,证实了模型结果的可用性。
2)犟河流域NPP的年际变化具有波动性,空间上总体分布南高北低,不同植被类型的NPP模拟值为阔叶>混交>针叶>农田>城市; 不同土壤类型NPP值为砂土>砂质壤土>壤质砂土>粉砂壤土,同时NPP值随着海拔的上升而增加,在海拔为900 m以上时,增加的趋势逐渐趋于平缓。
3)日尺度上,气象因素对NPP影响较大,太阳辐射和温度与NPP的偏相关系数达到0.6左右,较长时间尺度上NPP对LAI的反响最强。
同时由于选取区域较小,无通量站观测数据,且目前国内存在的NPP数据产品大多是500 m分辨率,在对模型结果精度验证上有一定的局限性,考虑在后续的实验中进一步改进模型结果的验证准确性。
参考文献
Primary production of the biosphere:Integrating terrestrial and oceanic components
[J].
DOI:10.1126/science.281.5374.237
PMID:9657713
[本文引用: 1]

Integrating conceptually similar models of the growth of marine and terrestrial primary producers yielded an estimated global net primary production (NPP) of 104.9 petagrams of carbon per year, with roughly equal contributions from land and oceans. Approaches based on satellite indices of absorbed solar radiation indicate marked heterogeneity in NPP for both land and oceans, reflecting the influence of physical and ecological processes. The spatial and temporal distributions of ocean NPP are consistent with primary limitation by light, nutrients, and temperature. On land, water limitation imposes additional constraints. On land and ocean, progressive changes in NPP can result in altered carbon storage, although contrasts in mechanisms of carbon storage and rates of organic matter turnover result in a range of relations between carbon storage and changes in NPP.
生物生产力的“4P”概念、估算及其相互关系
[J].
Implications and estimations of four terrestrial productivity parameters
[J].
The terrestrial carbon cycle:Implications for the Kyoto Protocol
[J].DOI:10.1126/science.280.5368.1393 URL [本文引用: 1]
A spatially explicit hydro-ecological modeling framework (BEPS-TerrainLab V2.0):Model description and test in a boreal ecosystem in Eastern North America
[J].DOI:10.1016/j.jhydrol.2009.01.006 URL [本文引用: 1]
遥感水文耦合模型的研究进展
[J].
Advances in the coupled model of remote sensing and hydrology
[J].
Impact of climate change on net primary production (NPP) in south Iran
[J].
DOI:10.1007/s10661-020-08389-w
PMID:32488356
[本文引用: 1]
Climate change is a natural hazard which threatens the sustainable development of human health, food security, economic well-being, and natural resources. It also affects photosynthesis, plant respiration, and decomposition of organic matter that contribute to atmospheric carbon flow. The net primary production (NPP) is one of the main components of carbon balance. This study investigated the impact of climatic change on the net production in the Hormozgan county in south Iran. To obtain NPP, MODIS NPP product (MOD17A3) was used and future temperature and precipitation values were obtained using the HadGEM2-ES model under the RCP4.5 scenario. These values were downscaled using the LARSWG 6 statistical model, and precipitation and temperature were simulated for the RCP4.5 scenario. For further analysis, NPP was simulated based on the BIOME-BGC model and compared with the NPP data obtained from the MODIS images. Comparison of the climatic parameters of the basic (2001-2015) and future (2016-2030) periods indicated an increase in precipitation, minimum temperature, and maximum temperature of the study area and subsequently an increase in the NPP value in all biomes (averagely 17.73%) in the future. The highest NPP values were observed in the central and western parts of the region in biomes 4 (mangrove forest cover), 10 (broadleaf forest vegetation), and 6, 5, and 1 (rangeland vegetation), respectively, and the lowest values were observed in the eastern parts. Results showed that the increase in future NPP could be due to the increase in precipitation.
Net primary productivity distribution in the BOREAS region from a process model using satellite and surface data
[J].
DOI:10.1029/1999JD900768
URL
[本文引用: 1]
The purpose of this paper is to upscale tower measurements of net primary productivity (NPP) to the Boreal Ecosystem‐Atmosphere Study (BOREAS) study region by means of remote sensing and modeling. The Boreal Ecosystem Productivity Simulator (BEPS) with a new daily canopy photosynthesis model was first tested in one coniferous and one deciduous site. The simultaneous CO2 flux measurements above and below the tree canopy made it possible to isolate daily net primary productivity of the tree canopy for model validation. Soil water holding capacity and gridded daily meteorological data for the region were used as inputs to BEPS, in addition to 1 km resolution land cover and leaf area index (LAI) maps derived from the advanced very high resolution radiometer (AVHRR) data. NPP statistics for the various cover types in the BOREAS region and in the southern study area (SSA) and the northern study area (NSA) are presented. Strong dependence of NPP on LAI was found for the three major cover types: coniferous forest, deciduous forest and cropland. Since BEPS can compute total photosynthetically active radiation absorbed by the canopy in each pixel, light use efficiencies for NPP and gross primary productivity could also be analyzed. From the model results, the following area‐averaged statistics were obtained for 1994: (1) mean NPP for the BOREAS region of 217 g C m−2 yr−1; (2) mean NPP of forests (excluding burnt areas in the region) equal to 234 g C m−2 yr−1; (3) mean NPP for the SSA and the NSA of 297 and 238 g C m−2 yr−1, respectively; and (4) mean light use efficiency for NPP equal to 0.40, 0.20, and 0.33 g C (MJ APAR)−1 for deciduous forest, coniferous forest, and crops, respectively.
Distributed hydrological model for mapping evapotranspiration using remote sensing inputs
[J].DOI:10.1016/j.jhydrol.2004.08.029 URL [本文引用: 1]
Spatially explicit simulation of peatland hydrology and carbon dioxide exchange:Influence of mesoscale topography
[J].
基于BEPS生态模型对亚洲东部地区蒸散量的模拟
[J].
DOI:10.11849/zrzyxb.2010.09.019
[本文引用: 1]
气候变化和人类活动的加剧导致亚洲东部地区陆地生态系统的碳水循环过程发生显著的变化,成为全球变化研究最关注的对象之一。实际蒸散 (ET) 是陆地生态系统碳水循环的重要组成部分,但对该地区ET特征的研究尚不够深入。论文利用遥感、气象和土壤等资料驱动生态过程模型BEPS对亚洲东部地区1982—2006年间的ET进行了模拟分析。利用6个站的通量实测数据验证表明,BEPS模型能够解释ET 的81.23%的年变化和86.4%的10 d变化。模拟结果表明:亚洲东部的ET呈现出从东南向西北和西南沙漠地区逐渐减少的分布特征,最小值位于中国的西北沙漠地区;ET与降水量之比从东南和东北地区向西北内陆和西南沙漠地区逐渐增加,其中在中国长江以南的亚洲东部地区,平均值为0.4,而在沙漠地区接近1.0。在1982至2006年期间,研究区年ET总量的平均值为12 045×10<sup>9</sup> m<sup>3</sup>/a,其中,中国、泛东南亚和印度的ET总量占整个研究区的62.4%; 研究区的单位面积ET均值为401 mm/a,在泛东南亚地区最大 (1 100 mm/a),在蒙古最小(134 mm/a)。在所有的地表覆盖类型中,常绿阔叶林的ET总量和平均值都为最大,城镇地区的ET总量和平均值都为最小。研究区的ET总量呈增加趋势,草地、稀树草原、裸地和城镇的ET明显上升,其它地表覆盖类型的ET变化不明显。
Studyon evapotranspiration in east Asia using the BEPS ecological model
[J].
利用BEPS模型估算城区植被净初级生产力的时空变化
[J].
Spatio-temporal variation of net primary productivity estimated with BEPS model in the urban area
[J].
区域净初级生产力动态及其与气象因子的关系
[J].
Relationship of regional net primary productivity and related meteorological factors
[J].
M-K和滑动T确定穆棱河流域径流变化突变时间
[J].
Ensure the abrupt runoff change time in Muling river by M-K and sliding T method
[J].
Simulation of Evapotranspiration Based on BEPS-TerrainLab V2.0 from 1990 to 2018 in the Dajiuhu Basin
[J].DOI:10.1007/s11769-020-1160-x [本文引用: 1]
大气CO2浓度增加对生物组织结构与功能的可能影响Ⅱ植物种群、群落、生态系统结构和生产力对大气CO2浓度增加的响应
[J].
DOI:10.11821/xb1996S1015
[本文引用: 1]
本文系统综述大气CO2浓度增加对植物种群生长与竞争:群落结构与生产力;生态系统功能的影响以及它们与大气CO2和水汽通量交换测定和模拟预测的最新研究成果。特别强调了实验研究与建模预测相结合的重要性,分析了气候变化对植物和生态系统影响研究的未来发展趋势。
Likely Impacts of Rising Atmospheric CO2 Concentration on Plants and Ecosystems Ⅱ.Responses of Plant Population,Community and Forest Ecosystem to Atmospheric CO2 Enrichment
[J].
中国陆地植被净初级生产力遥感估算
[J].
DOI:10.17521/cjpe.2007.0050
[本文引用: 1]
该文在综合分析已有光能利用率模型的基础上,构建了一个净初级生产力(NPP)遥感估算模型,该模型体现了3方面的特色:1)将植被覆盖分类引入模型,并考虑植被覆盖分类精度对 NPP 估算的影响,由它们共同决定不同植被覆盖类型的归一化植被指数(NDVI)最大值;2)根据误差最小的原则,利用中国的NPP实测数据,模拟出各植被类型的最大光能利用率,使之更符合中国的实际情况;3)根据区域蒸散模型来模拟水分胁迫因子,与土壤水分子模型相比,这在一定程度上对有关参数实行了简化,使其实际的可操作性得到加强。模拟结果表明,1989~1993年中国陆地植被NPP平均值为3.12 Pg C (1 Pg=10<sup>15</sup> g),NPP模拟值与观测值比较接近,690个实测点的平均相对误差为4.5%;进一步与其它模型模拟结果以及前人研究结果的比较表明,该文所构建的NPP遥感估算模型具有一定的可靠性,说明在区域及全球尺度上,利用地 理信息系统技术将遥感数据和各种观测数据集成在一起,并对NPP模型进行参数校正, 基本上可以实现全球范围不同生态系统NPP的动态监测。
Estimation of net primary productivity of Chinese terrestrial vegetation based on remote sensing
[J].
中国东北地区植被NPP模拟与时空变化分析
[J].
Simulation and spatio-temporal variation analysis of net primary productivity in Northeast China
[J].
