

0 引言
目前自然资源调查监测中,遥感技术逐渐取代传统的监测方法,成为一种研究热点。高光谱遥感为当前遥感技术的前沿领域,高光谱遥感影像信息提取已成为矿物测绘、农业、环境、林业等领域实时应用的主要来源[4-5],为相关应用的数据分析提供了重要的支撑[6]。深度学习具有较强的泛化能力和高效的特征表达能力[7],可以对海量原始数据自动执行分层特征提取,减少人类对特征规则的定义、降低人工成本[8-9]。深度学习方法可以从高光谱影像中自动提取从低级到高层次的抽象特征,并实现准确的分类。目前,较多的深度学习方法采用2D-CNN提取高光谱影像的光谱和空间信息[10-11],这些方法在图像预处理过程中易造成光谱信息丢失。为了有效利用高光谱影像丰富的光谱和空间信息,越来越多的研究[12-13]引入3D-CNN提取光谱和空间特征,提升高光谱影像分类的性能。Li等[13]提出一种轻量级高光谱影像3D-CNN分类方法,与2D-CNN相比提高了分类精度,说明3D卷积模块可同时提取光谱和空间特征,结合高光谱影像具有较好的应用。遥感技术具有实时、快速、大范围等优点,已深入应用于自然资源分析评估中。自然资源分析评估目的是整体上发现自然资源的现状与变化态势,为生态开发、保护、治理提供支撑。2015年原环境保护部发布修订后的《生态环境状况评价技术规范》(HJ 192—2015)[14],规范中定义了反映区域内整体生态环境状态的生态指数(ecological index,EI)。该指数体系包括生物丰富度指数(biological richness index,BRI)、归一化植被指数(normalized difference vegetation index, NDVI)、水网密度指数(water-network-density index,WNDI)、土地应力指数(land-stress index,LSI)、污染负荷指数(pollution load index,PLI)和环境约束指数(environment regulation index,ERI),这6个子指标分别反映了评价区域内生物丰富度、植被覆盖度、水网密度、土地胁迫强度、污染物压力和环境限制情况。在基于遥感的生态评价研究中,学者们在各个方面都取得了丰硕的成果[15],目前研究重点已从单一的用于生态环境监测的遥感信息发展为对各种遥感信息的综合分析[16]。将卫星遥感数据与社会统计相结合,纳入生态评价模式,也有助于挖掘驱动力,促进生态环境改善,落实生态文明建设行动[17]。
综上所述,本研究为实现自然资源监测、评估的体系研究,以北京市北部部分区域为研究区,以珠海一号高光谱影像为数据源,在HRNet网络中引入3D卷积模块,提出3D-HRNet网络构建用于自然资源调查监测的语义分割模型,并对比说明3D-HRNet网络提取高光谱影像的自然资源的能力; 同时基于《生态环境状况评价技术规范》的EI指数结合遥感数据构建EI生态评价模型,与《生态环境状况公报》进行对比,探究遥感结合EI生态评价模型的可行性。
1 研究区概况和数据源
1.1 研究区概况
北京地处我国的华北地区,是我国的首都、直辖市、国家中心城市、超大城市[18]。北京中心位于E116°20',N39°56',总面积16 410.54 m2,常住人口2 188.6万人。北京市的地形以平原、丘陵、山地为主,主要呈西北高、东北低的地势,西、北和东北方向群山环绕,东南方向是缓缓向渤海倾斜的大平原。北京市怀柔区、密云区、顺义区和延庆区区域内有平原、丘陵、山地等多种地形,同时包含大型水库、河流、建设用地、耕地等多种土地利用类型。
本研究为了更好地研究基于深度学习的高光谱智能识别模型以及生态分析研究,以北京市北部怀柔区、密云区、顺义区和延庆区的部分区域为研究区(图1),利用珠海一号高光谱影像数据构建用于自然资源调查监测的深度学习语义分割模型、并进行遥感生态分析研究。
图1

1.2 数据源及其预处理
图2
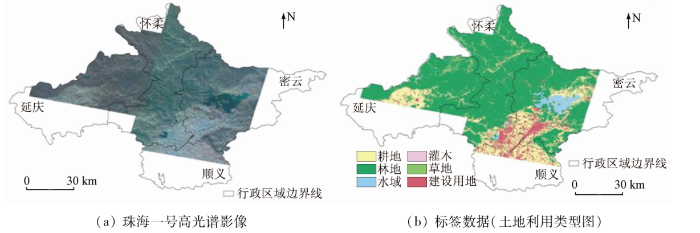
为了构建用于自然资源调查监测的3D-HRNet语义分割模型,本研究整合武汉大学遥感信息工程学院的中国30 m土地覆盖及其变化1985—2019年数据集[20]、中国科学院空天信息研究院2020年全球30 m地表覆盖类型产品[21]、谷歌公司10 m全球土地利用数据集[22]3种数据集制作训练标签数据集,标签数据类型包含耕地、林地、灌木、草地、水域和建设用地6类土地利用类型,如图2(b)所示。利用3种覆盖数据集在本研究区域地物类别进行归类合并确定本区域的地物类别,然后将中国30 m土地覆盖及其变化1985—2019年数据集和2020年全球30 m地表覆盖类型产品重采样为10 m空间分辨率,利用投票法对3种数据进行叠加处理,最后制作成训练标签数据集。
2 方法与流程
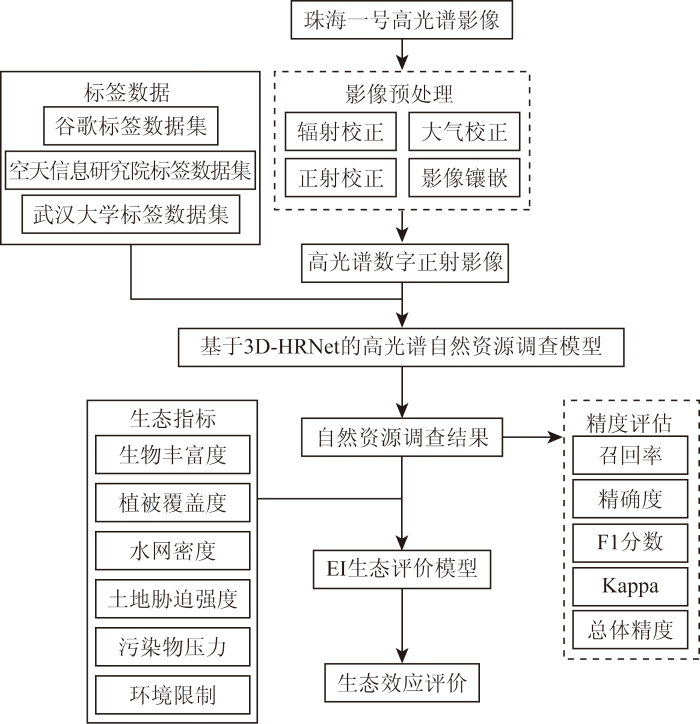
研究流程如图3所示。
图3
2.1 构建3D-HRNet自然资源监测模型
2.1.1 3D-HRNet网络
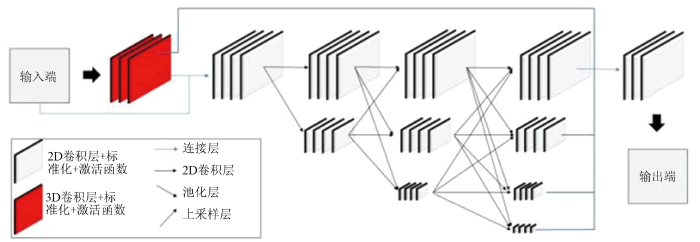
因此,本研究结合HRNet网络的特点并在网络框架中引入3D卷积模块[27],提出了适用于自然资源监测的高光谱遥感影像深度学习语义分割模型,即3D-HRNet(图4为网络结构)。以北京市北部部分区域为研究区域,并与HRNet卷积网络进行实验对比,验证了该网络的有效性。3D-HRNet网络的改进如下: 编码器中,3D卷积模块嵌入输入端后,将3D卷积模块提取的特征与输入端数据相连接至HRNet网络的编码器,主要利用3D卷积层建立高光谱影像不同光谱之间的关系并提取有效的特征信息,同时连接输入端从而减少原始信息的缺漏; 解码器中,将编码器中3D卷积模块输出特征与HRNet编码器输出特征相连接,接入HRNet网络的解码器中最后输出结果,连接3D卷积模块结果可保持网络输出结果的高分辨率。
图4
2.1.2 实验环境和参数设置
实验环境为Intel Core i7-12700F 2.1GHz 12核处理器、配备16G内存和Nvidia GeForce RTX 3060Ti; 软件环境方面,使用Windows 11专业版64位操作系统,编程语言是Python 3.6,模型构建工具是Tensorflow2.0,图形处理单元(graphic processing unit,GPU)计算平台是CUDA 11.0。
在模型训练过程中,批量(Batch)大小设置为16、初始学习速率(learning rate,LR)设置为0.001、优化器使用具有权重衰减的Adam(权重衰减系数为0.001)、迭代(epoch)为100次,并且选择损失函数较低、验证集精度最高的对应模型参数作为最终模型参数。
此外,将影像随机切割成尺寸为256像素×256像素的图片,并进行了水平翻转、垂直翻转、对角翻转和90°旋转的数据增强[28]操作,构建10万张相关数据集,同时在模型训练拟合阶段对数据集以8∶2比例随机划分训练数据集和验证数据集。
2.1.3 精度评估
本研究使用召回率(Recall)、精确度(Precision)、F1分数、总体精度(Accuracy)和Kappa系数5个指标来评估自然资源提取精度,并定量评价所提方法在提取自然资源时的性能。
召回率也称查全率,即研究区域内正确预测的一类自然资源像素数量与实际该类自然资源像素数量的比列,侧重评估提取结果是否遗漏。精确度也称查准率,即研究区域内正确预测的一类自然资源像素数量与预测结果中该类自然资源像素数量的比列,侧重评估提取结果是否被误判。F1分数结合了精确度和召回率的结果,是精确度和召回率的谐波平均值。总体精度是指对每一个随机样本,所分类的结果与检验数据类型相一致的概率。Kappa系数是一种衡量分类精度的指标,既用于一致性检验,也可用于衡量分类精度,代表着分类与完全随机的分类产生错误减少的比例。各指标计算公式为:
式中: TP为预测的结果中被正确标识的数量; FP为预测的结果中被错误地识别为其他类型的数量; TN为预测的其他类型中被正确标识为其他类型的数量; FN为真实类型被错误地识别为其他类型的数量; P0为每一类正确分类的样本数量之和除以总样本数; Pe为真实样本和预测样本在给定样本上随机一致性的概率。
2.2 EI生态评价模型构建
EI生态指数是评价生态环境的综合指数,包含生物丰富度、植被覆盖度、水网密度、土地胁迫、污染负荷、环境限制等子指数。生物丰富度用BRI表示,公式为:
式中: A1为区域内林地面积; A2为区域内草地面积; A3为区域内水域面积; A4为区域内草地面积; A5为区域内建设用地面积; A6为区域内灌木面积; A为区域面积。《区域生物多样性评价标准》(HJ 623—2011)中规定BRI的由栖息地质量指数(habitat-quality index,HQ)和生物多样性指数(biodiversity index,BI)决定,而本研究的研究区域无生物多样性变化,BRI仅与栖息地质量相关,因此公式中系数为0.5。
植被覆盖度用NDVI表示,公式为:
式中: Pi为每个像素的NDVI值; n为区域像素个数。
水网密度情况用WNDI表示,公式为:
式中W为水域面积。
土地胁迫强度用LSI表示,公式为:
式中: A7为区域内严重流失面积; A8为区域内中度流失面积; A9为区域内其他用地面积。根据《水土流失分类分级标准》规定,由土地覆盖类型、坡度、覆盖面非耕作林草3个指标确定,植被覆盖率、坡度与侵蚀程度如表1所示。
表1 植被覆盖率、坡度与侵蚀程度关系表
Tab.1
| 植被覆 盖率/% | 坡度/(°) | |||||
|---|---|---|---|---|---|---|
| <5 | [5,8) | [8,15) | [15,25) | [25,35] | >35 | |
| <30 | 轻微 | 温和 | 中度 | 严重 | 极度严重 | 剧烈 |
| [30,45) | 轻微 | 温和 | 中度 | 中度 | 严重 | 极度严重 |
| [45,60) | 轻微 | 温和 | 温和 | 中度 | 中度 | 严重 |
| [60,75] | 轻微 | 温和 | 温和 | 温和 | 中度 | 中度 |
| >75 | 轻微 | 轻微 | 轻微 | 轻微 | 轻微 | 轻微 |
参照生态环境部发布的《生态环境状况评价技术规范》(HJ 192—2015),得出每个评价指标权重,最终计算区域内的EI生态指数值,其计算公式为:
由于本研究区内近10 a未发生重大、极端的环境污染事件,PLI和ERI设值为0。
3 结果分析与讨论
3.1 基于3D-HRNet网络的自然资源监测研究
本研究基于HRNet网络引入3D卷积模块提出3D-HRNet模型,以珠海一号高光谱遥感影像为数据集,构建用于自然资源调查监测的高光谱语分割模型,探究高光谱数据在自然资源调查监测中的应用。为了更全面地比较模型提取自然资源调查监测的性能,本研究选取山区(区域一)、平原(区域二)2种地势的区域进行综合比较,并分别利用HRNet模型、3D-CNN模型和3D-HRNet模型提取自然资源。
表2为监测结果对比,由表2可知,HRNet,3D-CNN和3D-HRNet这3种模型都具有较好的提取结果,能保持自然资源的边界完整、清晰,但细节有一定差别。区域一主要为北京北部区域的山区,主要类型包含耕地、林地、水域、草地等。在区域一的HRNet模型预测结果中,耕地类型能完整地提取,出现误判建设用地、漏提水域类型的问题; 3D-HRNet模型预测结果不仅完整提取水域类型,同时对建设用地、耕地这2种类型能相对准确地提取; 而3D-CNN表现介于HRNet模型和3D-HRNet模型之中,说明3D卷积能更好地识别高光谱遥感数据对地物的影响,同时表明3D-HRNet模型比3D-CNN模型识别自然资源能力更好。区域二主要为北京北部地区的平原地区,主要类型包含耕地、草地、大型水库、建设用地等类型。在区域二的结果中,3D-HRNet模型、3D-CNN模型与HRNet模型识别结果相近,对平原地区的耕地、林地等自然资源提取具有较好的结果,但3D-HRNet模型在水域东北部区域错误提取成林地。从区域二真彩色影像可知,水域东北部区域出现与其他区域不同的颜色,疑似区域水体叶绿素较高造成与林地的光谱特性相似。根据结果,3D-HRNet模型提取自然资源优于3D-CNN模型、HRNet模型。
表2 自然资源监测结果对比
Tab.2
| 类别 | 区域一 | 区域二 |
|---|---|---|
| 真彩色影像 | 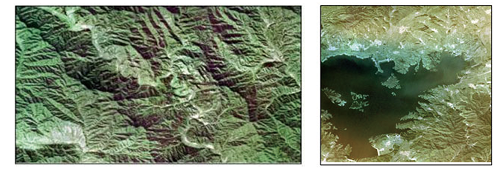 | |
| 标签数据 | 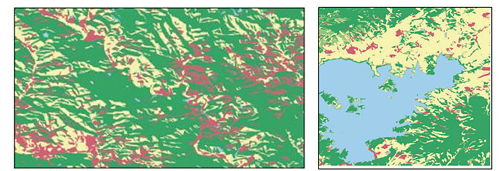 | |
| HRNet模型预测结果 | 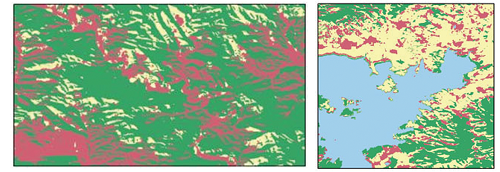 | |
| 3D-CNN模型预测结果 | 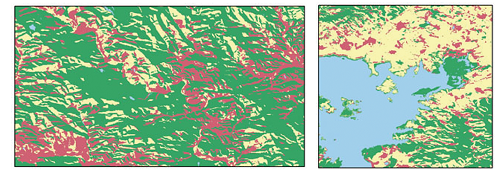 | |
| 3D-HRNet模型预测结果 | 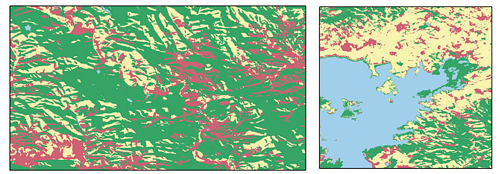 | |
| 图例 |  | |
模型的精度如表3所示。由表3可知,3D-HRNet模型提取区域一的自然资源结果总体精度、F1分数和Kappa系数分别为0.86,0.86和0.75,区域二结果总体精度、F1分数和Kappa系数分别为0.79,0.79和0.75,平均总体精度为0.83、平均F1分数为0.82、平均Kappa系数为0.73,定量结果表明3D-HRNet模型可有效提取高光谱影像中的自然资源结果。同时与HRNet模型定量结果对比,总体精度高0.04、F1分数高0.04、Kappa系数高0.06; 比3D-CNN模型总体精度高0.04、F1分数高0.05、Kappa系数高0.06,表明3D-HRNet模型提取高光谱影像的自然资源结果更好,3D卷积模块能更好地利用高光谱特性识别自然资源。
表3 模型精度对比表
Tab.3
| 模型 | 指标 | 区域一 | 区域二 | 平均 |
|---|---|---|---|---|
| HRNet模型 | 召回率 | 0.78 | 0.80 | 0.79 |
| 准确率 | 0.53 | 0.56 | 0.55 | |
| F1分数 | 0.77 | 0.81 | 0.79 | |
| 总体精度 | 0.78 | 0.80 | 0.79 | |
| Kappa系数 | 0.61 | 0.73 | 0.67 | |
| 3D-CNN模型 | 召回率 | 0.79 | 0.78 | 0.78 |
| 准确率 | 0.44 | 0.55 | 0.49 | |
| F1分数 | 0.79 | 0.78 | 0.78 | |
| 总体精度 | 0.80 | 0.78 | 0.79 | |
| Kappa系数 | 0.64 | 0.69 | 0.67 | |
| 3D-HRNet模型 | 召回率 | 0.86 | 0.79 | 0.82 |
| 准确率 | 0.65 | 0.55 | 0.60 | |
| F1分数 | 0.86 | 0.79 | 0.82 | |
| 总体精度 | 0.86 | 0.79 | 0.83 | |
| Kappa系数 | 0.75 | 0.71 | 0.73 |
3.2 北京市北部部分区域的生态分析研究
本研究采用50 m×50 m的格网作为评价单元,利用高光谱影像提取生态环境评价因子,统计每个格网内的指标,从而反映研究区域的生态环境空间分布与差异性,最终计算得到各指标和EI结果图。
北京市北部部分区域的生物丰富度、植被覆盖度、水网密度、土地胁迫强度等结果分布图如图5所示。
图5
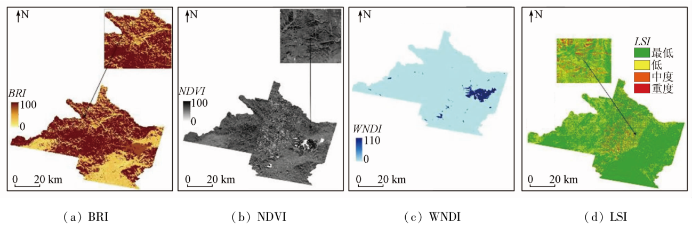
1)统计计算得出,2020年研究区的平均BRI为75.0,表明研究区的生态环境整体较好; 由图5(a)中可知,在研究区的中部山区BRI较高、南部城市发展区生物丰富度较低。
2)2020年研究区的平均NDVI为78.9,由图5(b)可知其分布与BRI相似,研究区的中部山区NDVI较高、南部城市发展区NDVI低,说明生物丰富度与NDVI呈正相关。
3)WNDI范围为0~100,颜色越深、水网越密。由于研究区大部分为山区和城市建设区,WNDI分布大部分为0值。2020年研究区的平均WNDI为10.9,由图5(c)可知,水网分布在密云水库、怀柔水库等区域。
4)由坡度与植被覆情况确定侵蚀程度,图中绿色表示侵蚀程度最低,其次为黄色,橙色表示中度侵蚀,红色表示严重侵蚀。2020年研究区的平均LSI为81.6,由图5(d)可见,研究范围内大多数区域侵蚀程度较轻。
图6
4 结论
以2020年珠海一号高光谱影像为数据源,构建用于自然资源调查监测的3D-HRNet深度学习语义分割模型提取北京市北部部分区域2020年自然资源分类结果,同时采用基于生物丰富度、植被覆盖度、水网密度、土地胁迫强度、污染物压力、环境限制等指数的EI生态评价模型对2020年研究区进行生态状况评价。结果表明:
1)基于HRNet网络引入3D卷积模块提出3D-HRNet模型,提取自然资源具有较好的效果,总体精度为0.83,F1分数为0.83,Kappa系数为0.73。
2)3D-HRNet模型提取自然资源结果比HRNet模型的总体精度高0.04、F1分数高0.04、Kappa系数高0.06,比3D-CNN模型总体精度高0.04、F1分数高0.05、Kappa系数高0.06,说明3D卷积模块对提取高光谱影像中的自然资源有一定提升,3D-HRNet模型提取能力比3D-CNN模型高。
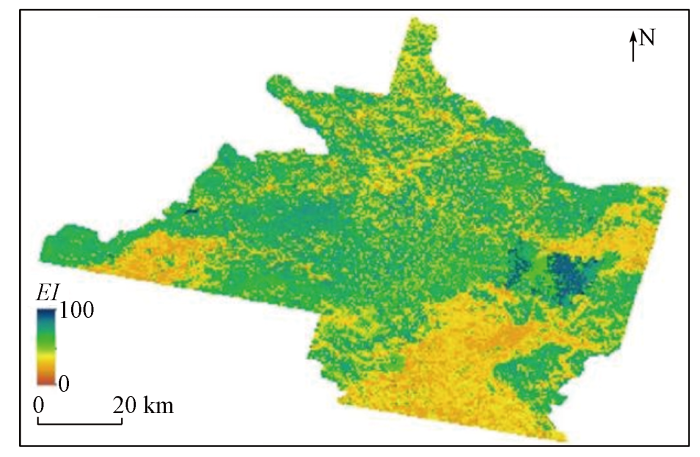
3)EI生态评价模型由遥感数据提取的6个分项指标组成,是反映生态质量指标的良好整合,可以全面反映研究区生态环境质量。2020年研究区的平均EI值为68.2,等级为良好,与北京市生态环境状况公报结论接近。
本研究提出3D-HRNet网络应用于高光谱影像提取自然资源结果,3D卷积模块能较好地识别各地物的光谱特性,但存在光谱特性相似的地物出现错误提取,例如水体中叶绿素较高区域错误识别成林地,后续将继续优化网络模型同时考虑同谱异物现象。同时利用遥感卫星数据构建EI生态评价模型,可快速、全面对生态环境进行评价,本次研究的EI生态评价模型具有较好的表现,与政府环境状况公报结果相近。遥感卫星数据的时序长、范围大等优点以及用于EI生态评价模型的有效性,为北京市生态状况的时空分析奠定基础,为北京市改善生态环境、促进绿色发展研究提供了数据支撑。
志谢
本实验的高光谱影像数据由珠海欧比特宇航科技股份有限公司提供,同时标签数据参考武汉大学遥感信息工程学院的中国30 m土地覆盖及其变化1985—2019年数据集、中国科学院空天信息创新研究院2020年全球30 m地表覆盖类型产品、谷歌公司10 m全球土地利用数据集,在此表示感谢。
参考文献
ESSIMAGE:A tool for the assessment of the agroecological performance of agricultural production systems
[J].
DOI:10.1007/s11356-019-04387-9
[本文引用: 1]

Over the last few years, intensive agriculture has often been denounced as a source of negative effects, particularly at the environmental and health level (overexploitation of natural resources, degradation of their quality, appearance and development of several diseases, etc.). Reducing the excessive use of agricultural inputs for the protection of the environment and the preservation of human and animal health is a social requirement nowadays. Investing in more sustainable agricultural models which make it possible to reduce, or even eliminate the risks, has become urgent. A possible solution may be to resort to agroecological systems. In order to be sustainable, these new systems must be performant at the agronomic, economic, social, and environmental levels. There is a multitude of tools for assessing the sustainability of agricultural systems. These tools are inappropriate for organic and agroecological systems, and do not make it possible to measure the agroecological transition performance of farms (Trabelsi et al. Environ Sci Pollut Res 23:139-156, 2016; Trabelsi 2017). This research project aims to design a decision support tool in order to help farms throughout the agroecological transition process, to assess the performance of this transition, and to put forward improvement scenarios. Contrary to other assessment methods, ESSIMAGE (Evaluation and Simulation of Agroecological Systems) is based on both pressure and impact indicators, and takes the specificities of agricultural production systems into account. It is a dynamic tool which not only makes it possible to assess farm performance at the present moment but also to consider the future by putting forward possible alternative improvement scenarios and by simulating their consequences at a later stage. ESSIMAGE is based on the interaction of two elements: agro-environmental, social, and economic indicators, and the GIS (Geographic Information System) software. This tool has been tested as part of a CASDAR "Post-MAET Gimone" (agriculture.gouv.fr/ministere/mobilisation-collective-pour-lagroecologie.) project on the subject of "Collective mobilization for agroecology" by using farm data, most of the farms having been involved in an agro-environmental measure for the progressive reduction of phytosanitary treatments since 2008. It has made it possible to compare the agroecological performances of these farms with an optimal situation, as well as with each other. Considering the research objectives and the approaches discussed, this study is an original step in the development of agricultural management strategies in favor of agroecology.
Contribution of agroecological farming systems to the delivery of ecosystem services
[J].DOI:10.1016/j.jenvman.2019.109576 URL [本文引用: 1]
Implementing ecological intensification in fish farming:Definition and principles from contrasting experiences
[J].
DOI:10.1111/raq.12231
[本文引用: 1]
Ecological intensification is a new concept in agriculture that addresses the double challenge of maintaining a level of production sufficient to support needs of human populations and respecting the environment in order to conserve the natural world and human quality of life. This article adapts this concept to fish farming using agroecological principles and the ecosystem services framework. The method was developed from the study of published literature and applications at four study sites chosen for their differences in production intensity: polyculture ponds in France, integrated pig and pond polyculture in Brazil, the culture of striped catfish in Indonesia and a recirculating salmon aquaculture system in France. The study of stakeholders' perceptions of ecosystem services combined with environmental assessment through Life Cycle Assessment and Emergy accounting allowed development of an assessment tool that was used as a basis for co-building evolution scenarios. From this experience, ecological intensification of aquaculture was defined as the use of ecological processes and functions to increase productivity, strengthen ecosystem services and decrease disservices. It is based on aquaecosystem and biodiversity management and the use of local and traditional knowledge. Expected consequences for farming systems consist of greater autonomy, efficiency and better integration into their surrounding territories. Ecological intensification requires territorial governance and helps improve it from a sustainable development perspective.
Spatial-spectral fusion based on conditional random fields for the fine classification of crops in UAV-borne hyperspectral remote sensing imagery
[J].
DOI:10.3390/rs11070780
URL
[本文引用: 1]
The fine classification of crops is critical for food security and agricultural management. There are many different species of crops, some of which have similar spectral curves. As a result, the precise classification of crops is a difficult task. Although the classification methods that incorporate spatial information can reduce the noise and improve the classification accuracy, to a certain extent, the problem is far from solved. Therefore, in this paper, the method of spatial–spectral fusion based on conditional random fields (SSF-CRF) for the fine classification of crops in UAV-borne hyperspectral remote sensing imagery is presented. The proposed method designs suitable potential functions in a pairwise conditional random field model, fusing the spectral and spatial features to reduce the spectral variation within the homogenous regions and accurately identify the crops. The experiments on hyperspectral datasets of the cities of Hanchuan and Honghu in China showed that, compared with the traditional methods, the proposed classification method can effectively improve the classification accuracy, protect the edges and shapes of the features, and relieve excessive smoothing, while retaining detailed information. This method has important significance for the fine classification of crops in hyperspectral remote sensing imagery.
PCA-based feature reduction for hyperspectral remote sensing image classification
[J].DOI:10.1080/02564602.2020.1740615 URL [本文引用: 1]
Monitoring invasive plant species using hyperspectral remote sensing data
[J].
DOI:10.3390/land10010029
URL
[本文引用: 1]
The species richness and biodiversity of vegetation in Hungary are increasingly threatened by invasive plant species brought in from other continents and foreign ecosystems. These invasive plant species have spread aggressively in the natural and semi-natural habitats of Europe. Common milkweed (Asclepias syriaca) is one of the species that pose the greatest ecological menace. Therefore, the primary purpose of the present study is to map and monitor the spread of common milkweed, the most common invasive plant species in Europe. Furthermore, the possibilities to detect and validate this special invasive plant by analyzing hyperspectral remote sensing data were investigated. In combination with field reference data, high-resolution hyperspectral aerial images acquired by an unmanned aerial vehicle (UAV) platform in 138 spectral bands in areas infected by common milkweed were examined. Then, support vector machine (SVM) and artificial neural network (ANN) classification algorithms were applied to the highly accurate field reference data. As a result, common milkweed individuals were distinguished in hyperspectral images, achieving an overall accuracy of 92.95% in the case of supervised SVM classification. Using the ANN model, an overall accuracy of 99.61% was achieved. To evaluate the proposed approach, two experimental tests were conducted, and in both cases, we managed to distinguish the individual specimens within the large variety of spreading invasive species in a study area of 2 ha, based on centimeter spatial resolution hyperspectral UAV imagery.
Faster R-CNN:Towards real-time object detection with region proposal networks
[J].DOI:10.1109/TPAMI.2016.2577031 URL [本文引用: 1]
DE-net:Deep encoding network for building extraction from high-resolution remote sensing imagery
[J].
DOI:10.3390/rs11202380
URL
[本文引用: 1]
Deep convolutional neural networks have promoted significant progress in building extraction from high-resolution remote sensing imagery. Although most of such work focuses on modifying existing image segmentation networks in computer vision, we propose a new network in this paper, Deep Encoding Network (DE-Net), that is designed for the very problem based on many lately introduced techniques in image segmentation. Four modules are used to construct DE-Net: the inceptionstyle downsampling modules combining a striding convolution layer and a max-pooling layer, the encoding modules comprising six linear residual blocks with a scaled exponential linear unit (SELU) activation function, the compressing modules reducing the feature channels, and a densely upsampling module that enables the network to encode spatial information inside feature maps. Thus, DE-Net achieves stateoftheart performance on the WHU Building Dataset in recall, F1-Score, and intersection over union (IoU) metrics without pretraining. It also outperformed several segmentation networks in our self-built Suzhou Satellite Building Dataset. The experimental results validate the effectiveness of DE-Net on building extraction from aerial imagery and satellite imagery. It also suggests that given enough training data, designing and training a network from scratch may excel fine-tuning models pre-trained on datasets unrelated to building extraction.
MAP-net:Multiple attending path neural network for building footprint extraction from remote sensed imagery
[J].DOI:10.1109/TGRS.2020.3026051 URL [本文引用: 1]
BASS net:Band-adaptive spectral-spatial feature learning neural network for hyperspectral image classification
[J].DOI:10.1109/TGRS.2017.2705073 URL [本文引用: 1]
R-VCANet:A new deep-learning-based hyperspectral image classification method
[J].DOI:10.1109/JSTARS.4609443 URL [本文引用: 1]
Deep feature extraction and classification of hyperspectral images based on convolutional neural networks
[J].DOI:10.1109/TGRS.2016.2584107 URL [本文引用: 1]
Spectral-spatial classification of hyperspectral imagery with 3D convolutional neural network
[J].DOI:10.3390/rs9010067 URL [本文引用: 2]
Review:An integrated graphical tool for analysing impacts and services provided by livestock farming
[J].
DOI:10.1017/S1751731119000351
PMID:30827290
[本文引用: 1]
Livestock farming is criticized for negatively impacting the environment, concerns about animal welfare and the impact of excessive meat consumption on human health. However, livestock farming provides other underappreciated and poorly communicated benefits to society in terms of employment, product quality, cultural landscapes and carbon storage by grasslands. Few attempts have been made so far to simultaneously consider the services and impacts provided by livestock production. Here, we propose an integrated graphical tool, called the 'barn' to explicitly summarize the synergies and trade-offs between services and impacts provided by livestock farming. It illustrates livestock farming interacting with its physical, economic and social environment along five interfaces: (i) Markets, (ii) Work and employment, (iii) Inputs, (iv) Environment and climate, (v) Social and cultural factors. This graphical tool was then applied by comparing two contrasting livestock production areas (high livestock density v. grassland-based), and the dominant v. a niche system within a crop-livestock area. We showed the barn could be used for cross-comparisons of services and impacts across livestock production areas, and for multi-level analysis of services and impacts of livestock farming within a given area. The barn graphically summarizes the ecological and socio-economic aspects of livestock farming by explicitly representing multiple services and impacts of different systems in a simple yet informative way. Information for the five interfaces relies on available quantitative assessments from the literature or data sets, and on expert-knowledge for more qualitative factors, such as social and cultural ones. The 'barn' can also inform local stakeholders or policy-makers about potential opportunities and threats to the future of livestock farming in specific production areas. It has already been used as a pedagogical tool for teaching the diversity of services and impacts of livestock systems across Europe and is currently developed as a serious game for encouraging knowledge exchange and sharing different viewpoints between stakeholders.
区域生态环境变化的遥感评价指数
[J].
A remote sensing index for assessment of regional ecological changes
[J].
Agroecological efficiency evaluation based on multi-source remote sensing data in a typical county of the Tibetan Plateau
[J].
DOI:10.3390/land11040561
URL
[本文引用: 1]
Evaluating agricultural ecology can help us to understand regional environmental status and contribute to the sustainable development of agricultural ecosystems. Furthermore, the results of eco-environmental assessment can provide data support for policy-making and agricultural production. The application of multi-source remote-sensing technology has the advantages of being fast, accurate and wide ranging. It can reveal the status of regional ecological environments, and is of great significance to monitoring their quality. In this paper, an agroecological efficiency evaluation model was constructed by combining remote sensing data and ecological index (EI). Multi-source remote-sensing data were used to obtain the evaluation index. Indicators collected from satellites, such as biological richness, vegetation cover, water network density, land stress, and pollution load, were used to quantitatively evaluate the agroecological efficiency of Rangtang County in the Tibetan Plateau. The results showed that the EI of Rangtang County increased from 61.77 to 65.10 during 2000–2020, which means that the eco-environmental quality of this area was good, and it has shown an obviously improving trend over the past 20 years. Rangtang County has converted more than 30 km²of grassland into woodland over the past 20 years. Climate change and human activities have had combined effects on the ecological environment of this area. The change in ecological environment quality is greatly affected by human disturbance. Policymakers should continue setting up nature reserves and should implement the policy of returning farmland to forests. Unreasonable grazing and rational allocation of land resources are still critical points of concern for future ecological environment construction. EI, combined with remote sensing and statistical data, is proven to be able to reasonably represent changes in ecological environment in Rangtang County, thus providing more possibilities for ecological evaluation on the Tibetan Plateau, and even the whole world.
2015—2017年北京及近周边平房燃煤散烧及其污染排放遥感测算
[J].
Estimation of coal consumption and the emission of related contaminants in the plain area around Beijing during 2015—2017
[J].
基于珠海一号高光谱卫星的巢湖叶绿素a浓度反演
[J].
Remote sensing retrieval of chlorophyll-a concentration in Lake Chaohu based on Zhuhai-1 hyperspectral satellite
[J].
The 30 m annual land cover dataset and its dynamics in China from 1990 to 2019
[J].
DOI:10.5194/essd-13-3907-2021
URL
[本文引用: 1]
. Land cover (LC) determines the energy exchange, water and carbon cycle between Earth's spheres. Accurate LC information is a fundamental parameter for the environment and climate studies. Considering that the LC in China has been altered dramatically with the economic development in the past few decades, sequential and fine-scale LC monitoring is in urgent need. However, currently, fine-resolution annual LC dataset produced by the observational images is generally unavailable for China due to the lack of sufficient training samples and computational capabilities. To deal with this issue, we produced the first Landsat-derived annual China land cover dataset (CLCD) on the Google Earth Engine (GEE) platform, which contains 30 m annual LC and its dynamics in China from 1990 to 2019. We first collected the training samples by combining stable samples extracted from China's land-use/cover datasets (CLUDs) and visually interpreted samples from satellite time-series data, Google Earth and Google Maps. Using 335 709 Landsat images on the GEE, several temporal metrics were constructed and fed to the random forest classifier to obtain classification results. We then proposed a post-processing method incorporating spatial–temporal filtering and logical reasoning to further improve the spatial–temporal consistency of CLCD. Finally, the overall accuracy of CLCD reached 79.31 % based on 5463 visually interpreted samples. A further assessment based on 5131 third-party test samples showed that the overall accuracy of CLCD outperforms that of MCD12Q1, ESACCI_LC, FROM_GLC and GlobeLand30. Besides, we intercompared the CLCD with several Landsat-derived thematic products, which exhibited good consistencies with the Global Forest Change, the Global Surface Water, and three impervious surface products. Based on the CLCD, the trends and patterns of China's LC changes during 1985 and 2019 were revealed, such as expansion of impervious surface (+148.71 %) and water (+18.39 %), decrease in cropland (−4.85 %) and grassland (−3.29 %), and increase in forest (+4.34 %). In general, CLCD reflected the rapid urbanization and a series of ecological projects (e.g. Gain for Green) in China and revealed the anthropogenic implications on LC under the condition of climate change, signifying its potential application in the global change research. The CLCD dataset introduced in this article is freely available at https://doi.org/10.5281/zenodo.4417810 (Yang and Huang, 2021).
Development of a global 30 m impervious surface map using multisource and multitemporal remote sensing datasets with the Google Earth Engine platform
[J].
DOI:10.5194/essd-12-1625-2020
URL
[本文引用: 1]
. The amount of impervious surface is an important\nindicator in the monitoring of the intensity of human activity and\nenvironmental change. The use of remote sensing techniques is the only means\nof accurately carrying out global mapping of impervious surfaces covering\nlarge areas. Optical imagery can capture surface reflectance\ncharacteristics, while synthetic-aperture radar (SAR) images can be used to\nprovide information on the structure and dielectric properties of surface\nmaterials. In addition, nighttime light (NTL) imagery can detect the\nintensity of human activity and thus provide important a priori\nprobabilities of the occurrence of impervious surfaces. In this study, we\naimed to generate an accurate global impervious surface map at a resolution\nof 30 m for 2015 by combining Landsat 8 Operational Land Image (OLI) optical images, Sentinel-1 SAR\nimages and Visible Infrared Imaging Radiometer Suite (VIIRS) NTL images based on\nthe Google Earth Engine (GEE) platform. First, the global impervious and\nnonimpervious training samples were automatically derived by combining the\nGlobeLand30 land-cover product with VIIRS NTL and MODIS enhanced vegetation\nindex (EVI) imagery. Then, the local adaptive random forest classifiers,\nallowing for a regional adjustment of the classification parameters to take into\naccount the regional characteristics, were trained and used to generate\nregional impervious surface maps for each 5∘×5∘ geographical grid using local training samples and multisource\nand multitemporal imagery. Finally, a global impervious surface map,\nproduced by mosaicking numerous 5∘×5∘\nregional maps, was validated by interpretation samples and then compared\nwith five existing impervious products (GlobeLand30, FROM-GLC, NUACI, HBASE and GHSL). The results indicated that the global\nimpervious surface map produced using the proposed multisource,\nmultitemporal random forest classification (MSMT_RF) method\nwas the most accurate of the maps, having an overall accuracy of 95.1 %\nand kappa coefficient (one of the most commonly used statistics to test\ninterrater reliability; Olofsson et al., 2014) of 0.898 as\nagainst 85.6 % and 0.695 for NUACI, 89.6 % and 0.780 for\nFROM-GLC, 90.3 % and 0.794 for GHSL, 88.4 % and 0.753 for\nGlobeLand30, and 88.0 % and 0.745 for HBASE using all 15 regional\nvalidation data. Therefore, it is concluded that a global 30 m impervious\nsurface map can accurately and efficiently be generated by the proposed\nMSMT_RF method based on the GEE platform. The global\nimpervious surface map generated in this paper is available at https://doi.org/10.5281/zenodo.3505079 (Zhang and Liu, 2019).\n
Dynamic World,Near real-time global 10 m land use land cover mapping
[J].
DOI:10.1038/s41597-022-01307-4
[本文引用: 1]
Unlike satellite images, which are typically acquired and processed in near-real-time, global land cover products have historically been produced on an annual basis, often with substantial lag times between image processing and dataset release. We developed a new automated approach for globally consistent, high resolution, near real-time (NRT) land use land cover (LULC) classification leveraging deep learning on 10 m Sentinel-2 imagery. We utilize a highly scalable cloud-based system to apply this approach and provide an open, continuous feed of LULC predictions in parallel with Sentinel-2 acquisitions. This first-of-its-kind NRT product, which we collectively refer to as Dynamic World, accommodates a variety of user needs ranging from extremely up-to-date LULC data to custom global composites representing user-specified date ranges. Furthermore, the continuous nature of the product’s outputs enables refinement, extension, and even redefinition of the LULC classification. In combination, these unique attributes enable unprecedented flexibility for a diverse community of users across a variety of disciplines.
基于HRNet的高分辨率遥感影像建筑物变化信息提取
[J].
DOI:10.13474/j.cnki.11-2246.2022.0153
[本文引用: 1]
建筑物图斑变化检测是遥感影像信息提取的重要内容之一,对于土地调查、自然资源常态化监测、土地执法监测等具有重要意义。岭南地区建设结构复杂,高分辨率遥感影像信息丰富,包含建筑结构细节多种多样,加上成像的季节不同、时间不同等因素导致建筑物变化信息的自动提取十分困难。针对此问题,本文提出了基于HRNet的语义分割模型,通过筛选保留高分辨率的特征层,从而保留更细节的图像信息。此外,结合图像分割二值化对结果进行优化,在一定程度上提高了高分辨率遥感影像建筑物变化自动检测的能力。
HRNet-based extraction of building change information from high-resolution remote sensing images
[J].
DOI:10.13474/j.cnki.11-2246.2022.0153
[本文引用: 1]
Building change extraction is one of the important research areas of remote sensing image information extraction, which is of great significance for land survey, natural resources monitoring and land law enforcement. The complex construction structure in Lingnan area of China contains a variety of building structure details, which reflect rich information on the high-resolution remote sensing images, and the factors of influence such as abundant data sources and imaging seasonal differences. It makes the automatic extraction of building change information very difficult. To address this problem, this paper proposes a semantic segmentation model based on HRNet, which achieves the retention of more detailed texture information by screening the feature layers that retain high resolution. On this basis, the automatic detection capability of building changes in high-resolution remote sensing images is improved by GraphCut binarization optimization.
改进的HRNet应用于路面裂缝分割与检测
[J].
DOI:10.13474/j.cnki.11-2246.2022.0082
[本文引用: 1]
针对利用传统卷积神经网络进行路面裂缝分割时存在准确率低、信息丢失及边缘模糊的问题,本文提出了基于改进HRNet模型的路面裂缝分割算法。模型在原始HRNet的基础上进行改进,主干网络部分采用DUC模块代替双线性插值上采样;下采样改为passthrough layer代替原始卷积;在模型解码部分,进行逐级上采样的同时引入SE-Block,对不同特征层的融合重新标定权重。通过与原始HRNet及传统卷积神经网络U-Net对比可知,本文算法在公共数据与自制数据集上的分割精度表现优秀,F1分值分别达到了91.31%和78.69%,可以很好地满足实际工程的需求。
Improved HRNet applied to segmentation and detection of pavement cracks
[J].
DOI:10.13474/j.cnki.11-2246.2022.0082
[本文引用: 1]
Aiming at the problems of low accuracy,loss of information and blurred edges in the traditional convolutional neural network for pavement crack segmentation,a pavement crack segmentation algorithm based on the improved HRNet model is proposed.The model is improved on the basis of the original HRNet,the backbone network part uses DUC module instead of bilinear interpolation;downsampling is changed to passthrough layer to replace the original convolution,SE-Block is introduced while performing step-by-step upsampling to re-calibrate the fusion of different feature layers.Comparing with the original HRNet and the other traditional convolutional neural networks U-Net,it can be concluded that the segmentation accuracy of this algorithm is the best on public data and self-made data sets,with <i>F1</i> score reaching 91.31% and 78.69% respectively,proving that the algorithm can be very good to meet the needs of actual engineering.
基于3D卷积神经网络的中耳疾病高分辨率CT图像辅助分类诊断模型的应用
[J].
Application of high resolution computed tomography image assisted classification model of middle ear diseases based on 3D-convolutional neural network
[J].
采用动态残差图卷积的3D点云超分辨率
[J].
3D point cloud super-resolution with dynamic residual graph convolutional networks
[J].
改进3D-CNN的高光谱图像地物分类方法
[J].
Improved 3D-CNN-based hyperspectral image classification method
[J].
基于面向对象与深度学习的典型地物提取
[J].
The typical object extraction method based on object-oriented and deep learning
[J].
