

0 引言
内蒙古卫境地区地处内蒙古自治区中北部,属于巴音宝力格隆起铀成矿带,目前已经发现了大量的花岗岩型铀矿化点、异常点,具有优越的花岗岩型铀矿成矿潜力[11]。此外,该区裸露的基岩为遥感地质研究提供了有利的条件。为促进GF-5高光谱数据在地质领域的应用及内蒙古卫境地区铀矿勘查工作,本文以内蒙古卫境地区为研究区,基于GF-5高光谱数据,采用光谱沙漏技术开展蚀变端元识别及蚀变信息提取,并借助PCI Geomatica软件中的LINE模型自动获取了研究区线性构造。在此基础上,利用ArcGIS软件将各类蚀变信息及线性构造进行整合,制作研究区铀成矿潜力图,圈定铀成矿有利区,以期为该区后续铀矿勘查工作提供参考。
1 研究区地质背景
卫境地区地处中蒙边境,内蒙古自治区二连浩特市西南,属中低山丘陵草原区,地势相对平坦。区内地表植被稀少,基岩裸露程度高,影像纹理特征清晰,不同岩性地层色调差异明显,多种类型蚀变发育,十分有利于开展遥感地质研究。
研究区地质图略图如图1所示。研究区的大地构造位置处于二连浩特—锡林浩特褶皱带西南段,巴音宝力格隆起西段。出露地层主要有青白口系、二叠系大石寨组、侏罗系上统、白垩系上统、新近系和第四系。其中青白口系主要为一套变质岩,包括大理岩、片岩、板岩及结晶灰岩等; 二叠系大石寨组,包括一、二、三和四岩组,岩性主要有千枚岩、凝灰岩、流纹岩、板岩、大理岩及英安岩等。二者为区内主要的含矿地层[11]。岩浆岩方面,研究区侵入岩广布,主要以二叠世、侏罗世及白垩世花岗岩体为主。其中与铀矿化关系密切的主要是早侏罗世花岗岩及早白垩世花岗岩。构造方面,研究区内断裂构造发育,主要有NE向、NW向断裂,局部有近SN及近EW向构造。
图1
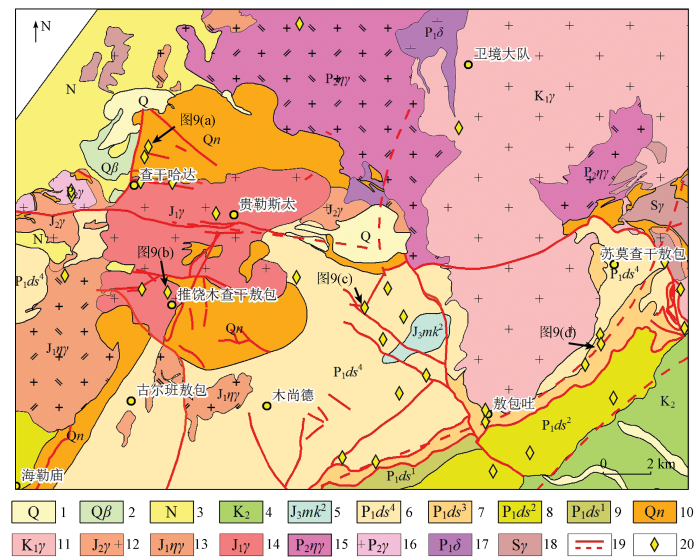
图1
研究区地质图略图(据核工业208大队2015年资料改编)
1. 第四系; 2. 玄武岩; 3. 新近系; 4. 白垩系; 5. 侏罗系满克头鄂博组二岩段; 6. 大石寨组四岩组; 7. 大石寨组三岩组; 8. 大石寨组二岩组; 9. 大石寨组一岩组; 10. 青白口系; 11. 早白垩世花岗岩; 12. 晚侏罗世花岗岩; 13. 早侏罗世二长花岗岩; 14. 早侏罗世花岗岩; 15. 晚二叠世二长花岗岩; 16. 晚二叠世花岗岩; 17. 早二叠世闪长岩; 18. 志留纪花岗岩; 19. 断层(虚线为推测断层); 20. 野外验证点
Fig.1
Sketch map of geology in research area (modified after the 2015 data from No.208 Geologic Party, CNNC)
2 数据源及预处理
2.1 GF-5高光谱数据
GF-5卫星是中国高分辨率对地观测系统重大专项中实现高光谱分辨率观测的卫星,卫星轨道高度705 km,其搭载的AHSI能获取可见光、近红外、短波红外共330个波段的数据,影像幅宽达60 km(表1)。所用高光谱图像成像时间为2019年11月3日,景号为88317,数据级别为L1级,研究区内图像清晰,无云、雪干扰,有利于遥感地质解译和信息提取。
表1 GF-5 AHSI图像的主要参数
Tab.1
| 波段 | 光谱范围/nm | 光谱分 辨率/nm | 空间分 辨率/m | 波段数 |
|---|---|---|---|---|
| 可见光—近红外(VNIR) | 390.324~1 029.18 | 5 | 30 | 150 |
| 短波红外(SWIR) | 1 004.77~2 513.25 | 10 | 180 |
2.2 数据预处理
利用成像光谱数据对地物进行识别依赖于地物精细的光谱特征,为从图像中获取地物真实的光谱特征,必须进行光谱数据的辐射定标与大气校正等预处理。此外,由于GF-5 AHSI图像条带噪声明显,因此需进行条带去除。涉及的主要预处理包括辐射定标、大气校正、波段选择、条带去除、正射校正及光谱去噪平滑等。
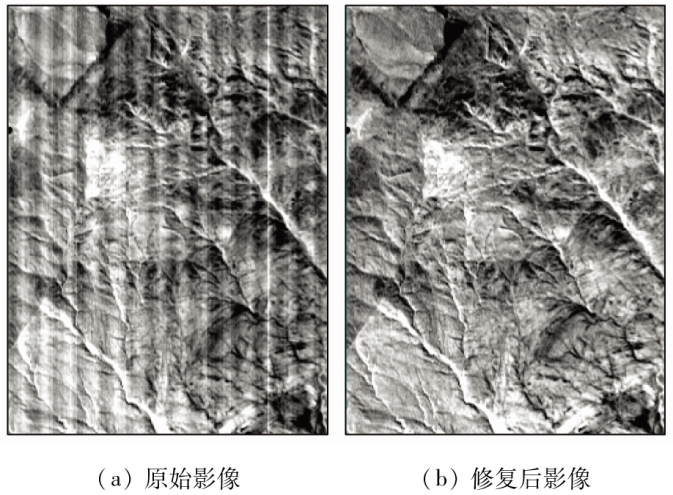
其中大气校正利用ENVI软件中FLAASH大气校正模块来完成,校正过程中不进行分块处理。为减少质量较差波段以及VNIR与SWIR之间重复波段对提取结果的影响[12],同时考虑到阴离子与阳离子诊断谱带的分段性[13],分别选取400~1 000 nm(共140个波段)和2 058~2 361 nm(共37个波段)2个波谱区间段的图像数据进行研究。为去除条带噪声,采用“全局去条纹”的方法[14]分别对2个波谱区间的图像进行条带去除。经过处理,图像的条带噪声得到有效消除(图2)。正射校正可对图像同时进行倾斜改正和投影差改正。利用ENVI中的RPC Orthorectification Workflow模块,结合影像自带的RPC文件以及软件自带的DEM文件(GMTED2010.jp2)进行正射校正处理。校正后的图像基于WGS-84椭球被投影到UTM投影(UTM Zone 49N)。最后利用最小噪声分离(minimum noise fraction,MNF)正反变换变换进行去噪和光谱平滑处理。
图2
3 信息提取及成矿潜力图制作
本文信息提取技术流程如图3所示。
图3
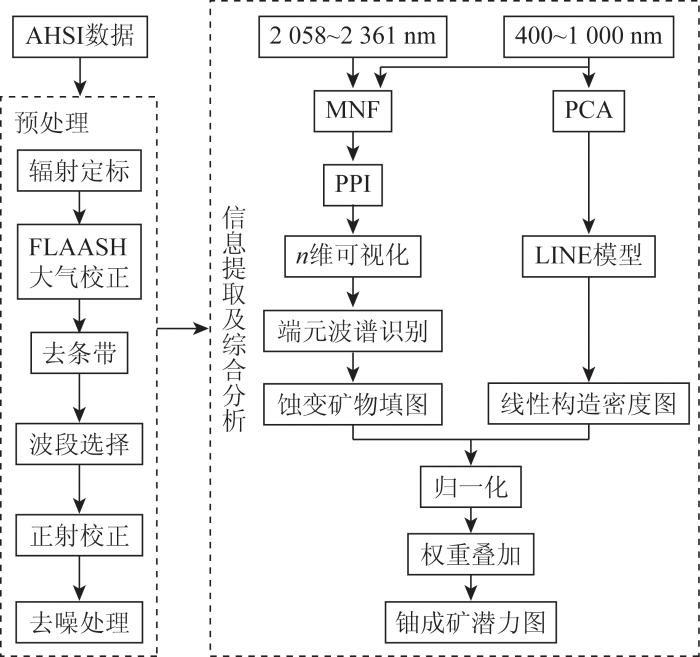
基于GF-5 AHSI数据,采用光谱沙漏技术进行高光谱蚀变信息提取,采用主成分变换(principal component analysis,PCA)和PCI Geomatica软件中的LINE模块提取线性构造,最后结合ArcGIS中的Weighted Overlay工具进行综合分析制作研究区铀成矿潜力图。
3.1 蚀变信息提取
3.1.1 端元波谱判定
经MNF变换、PPI计算以及n维可视化分析,分别提取了VNIR和SWIR波谱区间段的端元光谱。在VNIR波谱区间段共获得5条影像端元光谱,利用光谱特征拟合(spectral feature fitting,SFF)进行光谱分析,并结合专家知识综合分析每条端元光谱的特征吸收位置、吸收深度、吸收宽度和光谱整体形态等。经筛选,最终识别1条针铁矿光谱(图4(a))。可见,获取的端元光谱与USGS参考光谱在波形及吸收位置方面一致性较高。同样,在SWIR波谱区间段初步获取的7条图像端元光谱基础上,最终筛选出3条蚀变矿物端元光谱,最终识别为低铝绢云母、中铝绢云母及高铝绢云母(图4(b))。前人研究表明,绢云母的铝羟基(Al-OH)吸收峰波长与云母中六次配位铝(AlVI)含量呈负相关[16,21],据此可区分出低铝绢云母、中铝绢云母及高铝绢云母[5,16]。高铝绢云母的Al-OH吸收峰在2 190~2 202 nm之间,中铝绢云母的Al-OH吸收峰在2 202~2 212 nm,低铝绢云母的Al-OH吸收峰在2 212~2 225 nm[22]。但在具体划分的过程中,不同学者有不同的依据。如文献[16]以Al-OH在2 195 nm,2 210 nm和2 225 nm处的主吸收特征结合共同的2 345 nm处的次级吸收特征进行不同铝含量绢云母的划分,而文献[5]则以2 193 nm,2 201 nm和2 218 nm处的吸收特征进行划分。本次研究识别的绢云母端元,在2 345 nm附近具有共同的次级吸收特征,主吸收特征分别出现在2 201 nm,2 210 nm和2 218 nm,据此将其分别划分为高铝绢云母、中铝绢云母和低铝绢云母(图4(b))。
图4
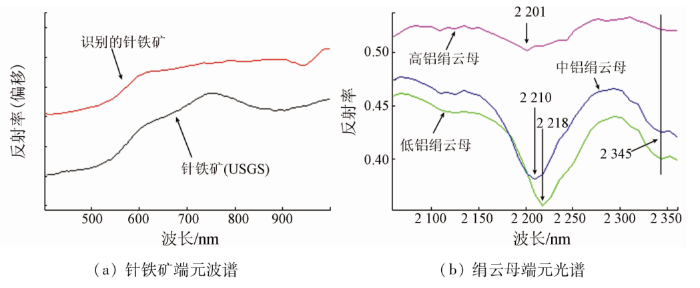
图4
端元波谱及标准光谱
Fig.4
Endmember spectrum from AHSI image and standard spectrum from USGS spectral library
3.1.2 矿物填图
端元波谱获取后,可利用填图算法对参考端元和图像光谱进行处理和分析,实现矿物的种类、组成成分或者丰度的反演。填图算法大致可分为基于像素和亚像素方法[23]。其中基于像素的光谱角匹配(spectral angle mapper, SAM)和光谱信息散度(spectral information divergence, SID),以及基于亚像素的混合调制匹配滤波(mixture tuned matched filtering, MTMF)和匹配滤波(matched filtering, MF)等算法都得到了广泛应用。MF是一种部分解混或光谱分解技术,用于在高光谱图像的每个像素中寻找感兴趣目标的丰度,可最大限度地提高感兴趣目标的响应,抑制复合未知背景的响应[23]。其输出结果为匹配滤波得分,得分越接近1表明像元光谱与参考目标越匹配[24]。本次研究利用MF进行蚀变填图,并结合中值滤波对提取结果进行了优化。
3.2 线性构造提取
表2 LINE模块不同参数及研究采用值
Tab.2
| 参数 | 含义 | 单位 | 描述 | 采用值 |
|---|---|---|---|---|
| RADI | 滤波半径 | 像素 | 指定Canny边缘检测算子中用于梯度计算的高斯滤波器的半径大小 | 12 |
| GTHR | 边缘梯度阈值 | 无 | 边缘检测过程中,作为边缘的梯度最小值,该值越大,图像中边缘越少 | 50 |
| LTHR | 曲线长度阈值 | 像素 | 被视为线性构造的最小长度 | 25 |
| FTHR | 线拟合阈值 | 像素 | 线段拟合形成线性构造时允许的最大误差 | 3 |
| ATHR | 角度差阈值 | 像素 | 定义要连接的2条多段线之间不能超过的角度。当2线段之间夹角大于该值时,则不进行连接操作 | 20 |
| DTHR | 连接距离阈值 | 像素 | 指定2条线段之间进行连接处理的最大间距,当超过该值时,则不进行连接 | 1 |
3.3 铀成矿潜力图生成
利用信息综合技术建立区域综合信息矿产预测模型,进行矿产资源定量评价,是当前矿产资源勘查领域信息找矿的重要途径[31]。本次研究将从GF-5高光谱数据中获取的5个证据层(针铁矿,高铝、中铝和低铝绢云母蚀变矿物,线性构造)进行整合,以形成铀成矿潜力图。首先,需要对各证据层进行归一化与分类处理。其中归一化处理公式为:
式中: Xn,X,Xmin和Xmax分别为归一化后的证据层、证据层、证据层中的最小值和证据层中的最大值。其次,将归一化后的证据层按数值范围分为低、中低、中高和高4类,相应的得分为1,2,3和4。最后,通过权重叠加将各证据层进行整合以获取最终结果。
4 结果与讨论
4.1 蚀变矿物分布特征
利用光谱沙漏技术分别从VNIR和SWIR 2个谱段识别了针铁矿、高铝绢云母、中铝绢云母以及低铝绢云母。结果显示,针铁矿主要呈团块状出现在研究区西北部地区(图5)。在地层岩性上,该类蚀变主要分布于侏罗纪、晚二叠世花岗岩与围岩接触带岩体一侧,反映该处蚀变与酸性花岗岩有关的热液活动有关; 高铝绢云母主要呈团块状、星点状分布于白垩纪与二叠纪岩体中。局部呈带状出露于NW和NWW向平直沟谷内,受构造控制明显; 中铝绢云母主要呈团块状、带状和星点状出露于研究区东南部、中部以及西北部,尤以东南部近似沿地层展布的蚀变分布范围广。在中部,亦可见一呈“丫”字形分布的强蚀变区,受近EW向构造的影响,其顶部蚀变呈串珠状沿EW向展布。在岩性地层上,该类蚀变主要分布于二叠系大石寨组及新近系地层中; 低铝绢云母主要呈团块状、星点状出露于研究区中部、南部和东南部地区,在地层岩性上,主要出露于二叠系大石寨组及青白口系地层中。
图5
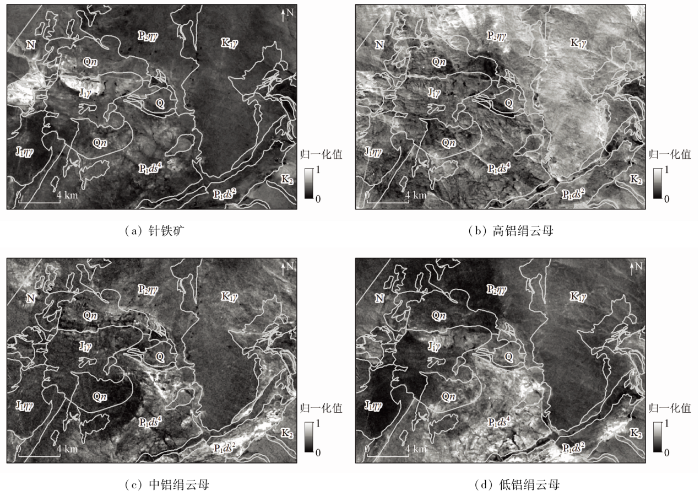
图5
蚀变矿物空间分布
1. Q第四系; 2. N新近系; 3. K2白垩系; 4. P1ds4大石寨组四岩组; 5. P1ds2大石寨组二岩组; 6. Qn青白口系; 7. K1γ早白垩世花岗岩; 8. J1ηγ早侏罗世二长花岗岩; 9. J1γ早侏罗世花岗岩; 10. P2ηγ晚二叠世二长花岗岩
Fig.5
Distribution of alteration minerals
4.2 线性构造分布特征
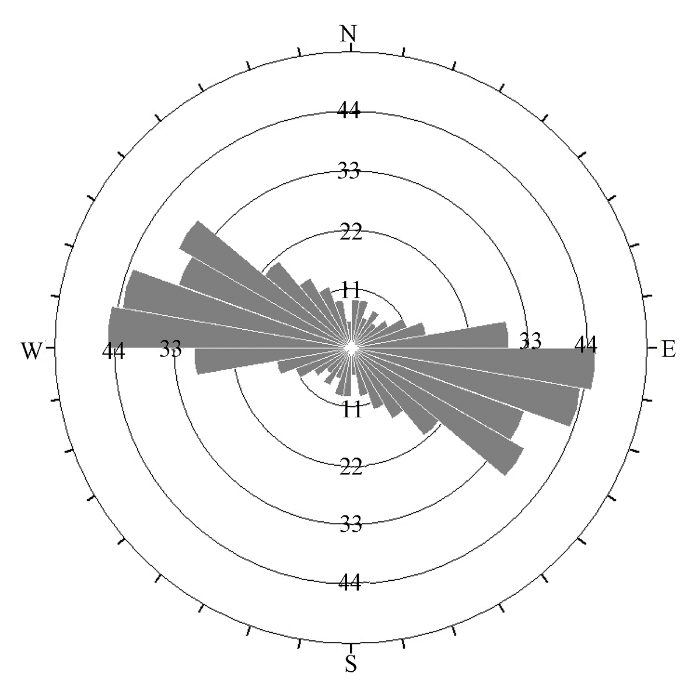
通过对VNIR波段(400~1 000 nm)高光谱数据的PCA变换,获取了一系列线性不相关的主分量; 将信息量最大的第一主分量导入PCI Geomatica软件中的LINE模块,自动提取了研究区线性构造; 并结合ArcGIS Kernel Density工具,制作了线性构造密度分布图(图6)。经统计分析,本次研究共获取线性构造321条,提取结果主要分布于图像的不同色调分界面以及呈线状展布的色调异常带上,整体效果较好。而在局部区域,提取结果受线状道路及影像接缝的影响,但影响较小。从空间分布来看,提取线性构造主要分布在研究区西部、西北部、中部及东北部地带,尤以西部、西北部分布广泛; 从地层岩性来看,提取的线性构造在岩体和地层中均有分布,但在早白垩世花岗岩(K1γ)南部及晚二叠世二长花岗岩(P2ηγ)中分布较少; 从线性构造方位来看,提取的线性构造主要呈EW,NWW,NW向展布(图7)。这与文献[11]野外查证中发现NW向构造最为发育的特征相符。此外,直接观察图像,研究区沟谷多呈NW向展布,在一定程度上也印证了提取结果的可靠性。但是,提取的NE向线性构造较缺乏,可能是由于NE向线性构造在图像中大多不是以线状沟谷显示的,而是以色调差异不显著的界面显示的(图6)。
图6
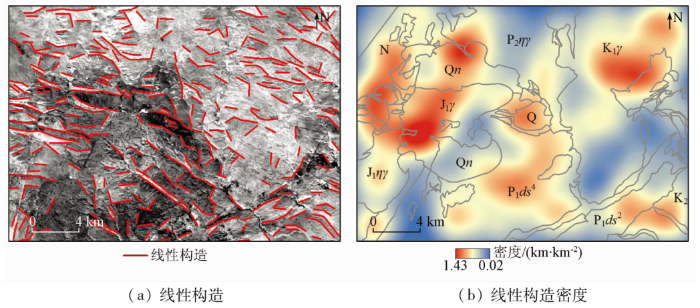
图6
线性构造空间分布
1. Q第四系; 2. N新近系; 3. K2白垩系; 4. P1ds4大石寨组四岩组; 5. P1ds2大石寨组二岩组; 6. Qn青白口系; 7. K1γ早白垩世花岗岩; 8. J1ηγ早侏罗世二长花岗岩; 9. J1γ早侏罗世花岗岩; 10. P2ηγ晚二叠世二长花岗岩
Fig.6
Distribution of linear structures
图7
4.3 综合分析及铀成矿潜力预测
为对线性构造及5类蚀变进行综合分析并确定铀成矿潜力区,需对各证据层进行归一化、分类及权重叠加处理。其中,归一化处理利用式(1)完成。经过归一化处理后的证据层,其像元值介于0~1之间。依据数值范围将各归一化证据层分为低、中低、中高和高4类,且设置相应的得分为1,2,3和4。各证据层分类数值范围以“均值+n倍标准差”来确定,其中,对蚀变信息n分别取2,2.5和3,而对线性构造n分别取1.5,2和2.5,最终设置值见表3。
表3 各证据层权重值及类别划分
Tab.3
| 图层 | 权重 | 数值 | 类别得分 |
|---|---|---|---|
| 线性构造密度 | 0.2 | [0.000,0.723) | 1 |
| [0.723,0.815) | 2 | ||
| [0.815,0.906) | 3 | ||
| [0.906,1.000] | 4 | ||
| 中铝绢云母蚀变 | 0.2 | [0.000,0.395) | 1 |
| [0.395,0.419) | 2 | ||
| [0.419,0.444) | 3 | ||
| [0.444,1.000] | 4 | ||
| 针铁矿蚀变异常 | 0.2 | [0.000,0.728) | 1 |
| [0.728,0.738) | 2 | ||
| [0.738,0.748) | 3 | ||
| [0.748,1.000] | 4 | ||
| 高铝绢云母蚀变 | 0.2 | [0.000,0.733) | 1 |
| [0.733,0.772) | 2 | ||
| [0.772,0.811) | 3 | ||
| [0.811,1.000] | 4 | ||
| 低铝绢云母蚀变 | 0.2 | [0.000,0.513) | 1 |
| [0.513,0.545) | 2 | ||
| [0.545,0.577) | 3 | ||
| [0.577,1.000] | 4 |
基于表3值,结合ArcGIS中软件的Reclassify模块,获取了各证据层分类结果(图8(a)—(e))。经过分类,有效区分了低、中低、中高及高4个等级的区域,并叠合已知放射性异常点及铀矿化点进一步开展铀成矿分析。结果显示,在放射性异常点或铀矿化点聚集区I(图8(f)),针铁矿连片分布,局部也见高铝、中铝及低铝绢云母矿物,指示该处铀成矿与上述4类蚀变关系密切,尤其是针铁矿。在构造复杂度方面,该区线性构造复杂度为最高等级(图8(e))。如在WJ17-219号点,该处岩性破碎且发育针铁矿及绢云母等蚀变(图9(a)),存在放射性异常(伽玛测量值为90~240 ppm),侧面印证了提取结果的可靠性。
图8
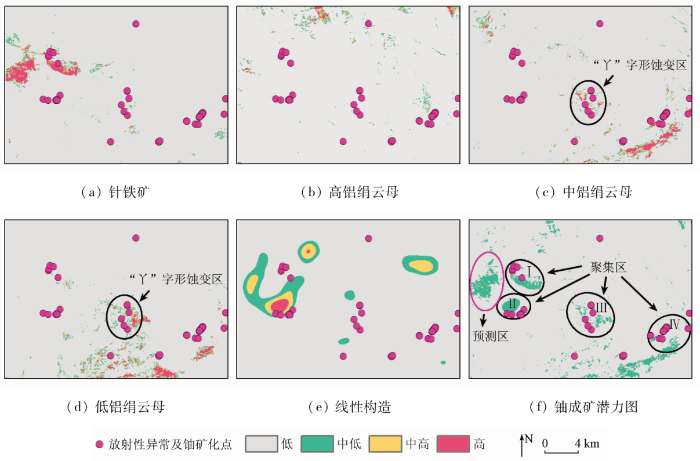
图8
各证据层分类结果及铀成矿潜力图
Fig.8
Classification results of evidential layers and mineral potential map of uranium
图9
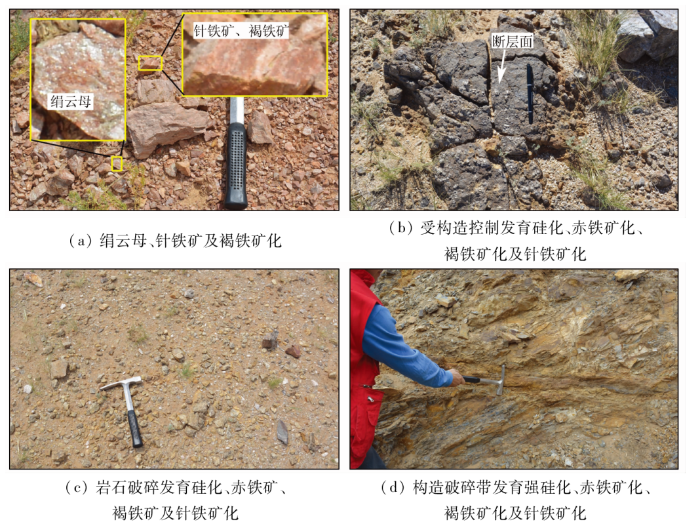
综上所述,本文采用的蚀变信息及线性构造提取方法可行; 针铁矿,高铝、中铝和低铝绢云母蚀变矿物以及线性构造与铀成矿关系密切,可作为该区铀矿找矿指示性要素(证据层)。
将已知放射性异常点及铀矿化点叠加于铀成矿潜力图上可以看出,已发现的4处放射性异常点或铀矿化点聚集区(Ⅰ,Ⅱ,Ⅲ及Ⅳ)均位于潜力图上的中低概率区域附近(图8(f)),从而在一定程度上印证了该潜力图的可靠性。依据上述结果,结合地质资料进一步圈定出预测区一处。该预测区内包含中低、中高概率成矿有利区,且连片分布。在蚀变方面,该预测区发育强烈的针铁矿蚀变,并发育一定高铝绢云母蚀变。此外,该区线性构造复杂度为中高级别,暗示有更大概率形成热液通道和储矿空间,进一步可指导研究区下一步铀矿勘查工作。
5 结论
1)在内蒙古卫境地区利用GF-5 AHSI数据采用光谱沙漏技术成功提取了研究区针铁矿、低铝、中铝以及高铝绢云母蚀变矿物。采用PCA和PCI Geomatica软件中的LINE模块自动提取了研究区线性构造。并通过对以上结果的分析及野外查证,指出了各证据层的空间展布规律并验证了提取结果的可靠性。
2)借助ArcGIS软件,实现了各证据层的整合,制作了可靠性较高的铀成矿潜力图。其中,成矿概率低、中低及中高的区域占比分别为94.22%,5.76%和0.02%。据此结合地质资料,圈定出1处预测区,从而为该区后续铀矿勘查工作提供了指导,同时也为GF-5高光谱数据在地质找矿领域的应用提供了参考。
3)尽管本文基于GF-5高光谱数据很好地提取了研究区的蚀变信息,但也存在由于影像空间分辨的制约未能有效识别呈小规模展布的蚀变的缺陷,由此可以看出单一数据源有一定的适用条件。因而在遥感蚀变信息提取乃至遥感地质勘查中,采用多源遥感数据可互补数据之间的不足,提高蚀变信息提取及勘查效果。
志谢
感谢核工业北京地质研究院栗旭升博士在论文撰写中给予的宝贵建议,同时也感谢审稿专家给予的宝贵意见。
参考文献
中国高光谱遥感的前沿进展
[J].
Current progress of hyperspectral remote sensing in China
[J].
甘肃龙首山芨岭铀矿床碱交代型铀矿化蚀变航空高光谱识别
[J].
DOI:10.12082/dqxxkx.2019.180465
[本文引用: 3]

甘肃龙首山铀成矿带是中国内陆一条重要的铀成矿带。芨岭铀矿床是龙首山成矿带中典型的碱交代型铀矿床,蚀变种类繁多,且与铀矿化关系密切,利用航空高光谱技术可以从宏观上获取芨岭铀矿床地表蚀变、构造、岩性分布信息,为芨岭矿床及周边铀多金属矿产勘查提供依据。本文采用CASI/SASI/TASI航空高光谱遥感技术,对甘肃龙首山地区芨岭碱交代型铀矿区及周围地表出露的热液蚀变进行了研究,识别出了碱性长石、赤铁矿、透闪石、中铝绢云母、高岭石、石英(硅化)等与碱交代热液作用演化密切相关的蚀变矿物,并将蚀变矿物与构造、岩性等要素进行了综合分析。研究表明,碱性长石、透闪石、中铝绢云母和石英(硅化)等蚀变矿物分别代表了芨岭及周围地区碱交代热液作用过程中早期碱交代、中期中性交代、晚期酸性交代等不同演化阶段的热液蚀变作用;芨岭铀矿区碱交代热液作用的主要通道是区域不整合面、深大断裂、不同岩性接触带的复合体,马路沟铀矿控矿断裂的芨岭矿区段明显发育透闪石、中铝绢云母、硅化与碱交代作用相关的热液蚀变。根据芨岭铀矿床的航空高光谱遥感特征,提出了龙首山碱交代型铀矿找矿的主要预测判据。这些判据对龙首山的铀矿找矿新区预测和老矿点、异常点的新评价具有重要的意义。
Identification of alkali-metasomatism type alteration associated with uranium mineralization using airborne hyperspectral in Jiling uranium deposit in Longshoushan area,Gansu Province
[J].
高分五号卫星高光谱数据岩性-构造解译初步应用评价
[J].
Preliminary application and evaluation of GF-5 satellite hyperspectral data in lithology-structure interpretation
[J].
Application of lithological mapping based on advanced hyperspectral imager (AHSI) imagery onboard Gaofen-5 (GF-5) satellite
[J].
DOI:10.3390/rs12233990
URL
[本文引用: 2]
The Advanced Hyperspectral Imager (AHSI), carried by the Gaofen-5 (GF-5) satellite, is the first hyperspectral sensor that simultaneously offers broad coverage and a broad spectrum. Meanwhile, deep-learning-based approaches are emerging to manage the growing volume of data produced by satellites. However, the application potential of GF-5 AHSI imagery in lithological mapping using deep-learning-based methods is currently unknown. This paper assessed GF-5 AHSI imagery for lithological mapping in comparison with Shortwave Infrared Airborne Spectrographic Imager (SASI) data. A multi-scale 3D deep convolutional neural network (M3D-DCNN), a hybrid spectral CNN (HybridSN), and a spectral–spatial unified network (SSUN) were selected to verify the applicability and stability of deep-learning-based methods through comparison with support vector machine (SVM) based on six datasets constructed by GF-5 AHSI, Sentinel-2A, and SASI imagery. The results show that all methods produce classification results with accuracy greater than 90% on all datasets, and M3D-DCNN is both more accurate and more stable. It can produce especially encouraging results by just using the short-wave infrared wavelength subset (SWIR bands) of GF-5 AHSI data. Accordingly, GF-5 AHSI imagery could provide impressive results and its SWIR bands have a high signal-to-noise ratio (SNR), which meets the requirements of large-scale and large-area lithological mapping. And M3D-DCNN method is recommended for use in lithological mapping based on GF-5 AHSI hyperspectral data.
高分五号高光谱影像矿物精细识别
[J].
Fine mineral identification of GF-5 hyperspectral image
[J].
GF-5高光谱数据在植被覆盖区的蚀变信息提取研究——以广东省玉水铜矿为例
[J].
The study on alteration information extraction of GF-5 hyperspectral data in vegetation coverage area:A case study of the Yushui copper deposit in Guangdong Province
[J].
基于GF-5高光谱数据的蚀变矿物填图及地质应用——以甘肃省瓜州县花牛山地区为例
[J].
Alteration mineral mapping based on the GF-5 hyperspectral data and its geological application:An example of the Huaniushan area in Guazhou County of Gansu Province
[J].
高光谱遥感异常信息在阿尔金索拉克地区铜金矿找矿工作中的应用
[J].
Application of hyperspectral remote sensing data-based anomaly extraction in copper-gold prospecting in the Solake area in the Altyn metallogenic belt,Xinjiang
[J].
新疆白杨河铀铍矿区航空高光谱矿物填图及蚀变特征分析
[J].
Mineral mapping and analysis of alteration characteristics using airborne hyperspectral remote sensing data in the Baiyanghe uranium and beryllium ore district,Xinjiang
[J].
Automated lithological mapping by integrating spectral enhancement techniques and machine learning algorithms using AVIRIS-NG hyperspectral data in Gold-bearing granite-greenstone rocks in Hutti,India
[J].DOI:10.1016/j.jag.2019.102006 URL [本文引用: 1]
内蒙古卫境地区铀矿找矿预测
[J].
Uranium prospecting in Weijing area of Inner Mongolia
[J].
GF-5 hyperspectral data for species mapping of mangrove in Mai Po,Hong Kong
[J].
DOI:10.3390/rs12040656
URL
[本文引用: 1]
Hyperspectral data has been widely used in species discrimination of plants with rich spectral information in hundreds of spectral bands, while the availability of hyperspectral data has hindered its applications in many specific cases. The successful operation of the Chinese satellite, Gaofen-5 (GF-5), provides potentially promising new hyperspectral dataset with 330 spectral bands in visible and near infrared range. Therefore, there is much demand for assessing the effectiveness and superiority of GF-5 hyperspectral data in plants species mapping, particularly mangrove species mapping, to better support the efficient mangrove management. In this study, mangrove forest in Mai Po Nature Reserve (MPNR), Hong Kong was selected as the study area. Four dominant native mangrove species were investigated in this study according to the field surveys. Two machine learning methods, Random Forests and Support Vector Machines, were employed to classify mangrove species with Landsat 8, Simulated Hyperion and GF-5 data sets. The results showed that 97 more bands of GF-5 over Hyperion brought a higher over accuracy of 87.12%, in comparison with 86.82% from Hyperion and 73.89% from Landsat 8. The higher spectral resolution of 5 nm in GF-5 was identified as making the major contribution, especially for the mapping of Aegiceras corniculatum. Therefore, GF-5 is likely to improve the classification accuracy of mangrove species mapping via enhancing spectral resolution and thus has promising potential to improve mangrove monitoring at species level to support mangrove management.
高光谱遥感地空综合预测方法在新疆卡拉塔格地区铜金矿床找矿中的应用
[J].
The application of hyperspectral remote sensing ground-air integrated prediction method to the copper gold deposit prospecting in Kalatag area,Xinjiang
[J].
EO-1 Hyperion高光谱数据的预处理
[J].
Preprocessing of EO-1 Hyperion hyperspectral data
[J].
Multi-and hyperspectral geologic remote sensing:A review
[J].DOI:10.1016/j.jag.2011.08.002 URL [本文引用: 1]
航空高光谱识别的高、中、低铝绢云母矿物成因学研究
[J].
Minerageny study of high-Al,medium-Al and low-Al sericites identified by airborne hyperspectral remote sensing technology
[J].
基于特征谱带的高光谱遥感矿物谱系识别
[J].
Spectral identification tree(sit)for mineral extraction based on spectral characteristics of minerals
[J].
航空高光谱遥感矿物信息提取技术及其应用进展——以中国西部成矿带调查为例
[J].
Mineral information extraction technology by airborne hyperspectral remote sensing and its application progress:An example of mineralization belts of Western China
[J].
相山铀矿岩芯HySpex成像高光谱数据蚀变矿物提取及其地质意义
[J].
Alteration mineral mapping of the Xiangshan uranium core using HySpex imaging hyperspectral data and its geological significance
[J].
Evaluation of AVIRIS-NG hyperspectral images for mineral identification and mapping
[J].DOI:10.1016/j.heliyon.2019.e02931 URL [本文引用: 1]
白云母矿物成分与光谱特征的关系研究
[J].
Relationship between composition and spectral feature of muscovite
[J].
桂东北苗儿山中段向阳坪铀矿床钻孔岩心高光谱特征分析
[J].
Spectral characteristics analysis of drill core in the Xiangyangping uranium deposit in the middle Miaoershan mountain,northeastern Guangxi
[J].
Mineral exploration using hyperspectral data
[M].
Large-scale mapping of iron oxide and hydroxide minerals of Zefreh porphyry copper deposit,using Worldview-3 VNIR data in the Northeastern Isfahan,Iran
[J].DOI:10.1016/j.jag.2018.06.010 URL [本文引用: 1]
Lineaments of the Atlantic border region
[J].DOI:10.1130/GSAB-15-483 URL [本文引用: 1]
辽西钼多金属矿床遥感影像线性体自动提取及成矿有利度分析
[J].
Automatic extraction and ore-forming favorability analysis of linear form in remote sensing image of molybdenum polymetallic deposit in Liaoxi area
[J].
基于ASTER数据的多金属成矿有利区预测
[J].
Prediction of polymetallic metallogenic favorable area based on ASTER data
[J].
Comparison of Landsat-8,ASTER and Sentinel 1 satellite remote sensing data in automatic lineaments extraction:A case study of Sidi Flah-Bouskour inlier,Moroccan Anti Atlas
[J].DOI:10.1016/j.asr.2017.09.006 URL [本文引用: 1]
Comparison of multi-resolution optical Landsat-8,Sentinel-2 and Radar Sentinel-1 data for automatic lineament extraction:A case study of Alichur area,SE Pamir
[J].
DOI:10.3390/rs11010001
URL
[本文引用: 1]
Grapevine wood fungal diseases such as esca are among the biggest threats in vineyards nowadays. The lack of very efficient preventive (best results using commercial products report 20% efficiency) and curative means induces huge economic losses. The study presented in this paper is centered around the in-field detection of foliar esca symptoms during summer, exhibiting a typical “striped” pattern. Indeed, in-field disease detection has shown great potential for commercial applications and has been successfully used for other agricultural needs such as yield estimation. Differentiation with foliar symptoms caused by other diseases or abiotic stresses was also considered. Two vineyards from the Bordeaux region (France, Aquitaine) were chosen as the basis for the experiment. Pictures of diseased and healthy vine plants were acquired during summer 2017 and labeled at the leaf scale, resulting in a patch database of around 6000 images (224 × 224 pixels) divided into red cultivar and white cultivar samples. Then, we tackled the classification part of the problem comparing state-of-the-art SIFT encoding and pre-trained deep learning feature extractors for the classification of database patches. In the best case, 91% overall accuracy was obtained using deep features extracted from MobileNet network trained on ImageNet database, demonstrating the efficiency of simple transfer learning approaches without the need to design an ad-hoc specific feature extractor. The third part aimed at disease detection (using bounding boxes) within full plant images. For this purpose, we integrated the deep learning base network within a “one-step” detection network (RetinaNet), allowing us to perform detection queries in real time (approximately six frames per second on GPU). Recall/Precision (RP) and Average Precision (AP) metrics then allowed us to evaluate the performance of the network on a 91-image (plants) validation database. Overall, 90% precision for a 40% recall was obtained while best esca AP was about 70%. Good correlation between annotated and detected symptomatic surface per plant was also obtained, meaning slightly symptomatic plants can be efficiently separated from severely attacked plants.
Mapping lithological units,structural lineaments and alteration zones in the Southern Kibi-Winneba belt of Ghana using integrated geophysical and remote sensing datasets
[J].DOI:10.1016/j.oregeorev.2021.104271 URL [本文引用: 1]
基于GIS的多元信息成矿预测研究——以赤峰地区为例
[J].
Study on synthetic informational mineral resource prediction using GIS:A case study in Chifeng region,Inner Mongolia,China
[J].DOI:10.1016/S1872-5791(08)60035-4 URL [本文引用: 1]
WorldView-3影像与ASTER热红外影像在内蒙古卫境地区铀矿勘查中的应用
[J].
Application of WorldView-3 and ASTER TIR for the exploration of uranium in Weijing,Inner Mongolia
[J].
遥感技术在内蒙古苏莫查干敖包地区铀矿勘查中的应用
[J].
Application of remote sensing technique to uranium exploration in Sumoqagan Obo District,Inner Mongolia
[J].
