

0 引言
1 研究数据
本研究利用Sentinel-2多光谱成像仪(multispectral instrument,MSI)光学遥感影像的可见光与近红外波段提取格陵兰冰面融水遥感信息,影像空间分辨率为10 m,共134景,主要成像时间段见图1。大部分影像云量小于15%。其中,94景影像成像于2019年7月29日—8月5日,16景成像于2019年7月15—28日,21景成像于2019年8月6—15日,剩余3景分别成像于2019年7月6日、7月13日和8月19日。超过70%以上的影像均成像于2019年7月29日—8月5日,因此本研究将该时段确定为主要成像时段,该时段日均冰面融水径流量为5.3 mm,高于2010—2020年同一时期冰面融水径流量平均值加一个标准差(图1),是2019年的消融旺盛时期。
图1
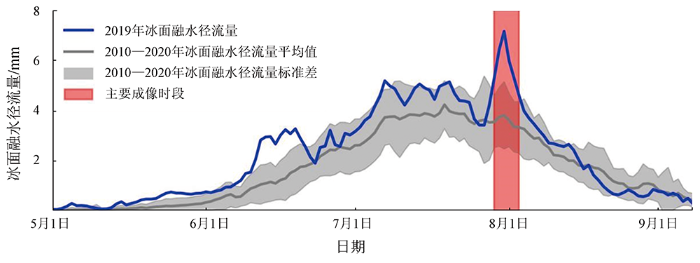
图1
RACMO模型模拟的2019年格陵兰冰面融水径流量及Sentinel-2影像主要成像时段
Fig.1
RACMO-simulated surface meltwater runoff of Greenland Ice Sheet in 2019 and primary acquisition time period of Sentinel-2 satellite images
本研究使用RACMO 2.3p2区域气候模型模拟的冰面融水径流量,空间分辨率为1 km,时间分辨率为1 d[16]。在主要成像时段内(2019年7月29日—8月5日),本研究计算了RACMO模型模拟的冰面融水径流量的均值。本研究使用格陵兰冰盖测绘项目(Greenland Ice Sheet mapping project,GIMP)生产的2015年格陵兰冰盖边界数据[17]确定格陵兰冰盖的空间范围,空间分辨率为90 m。为避免冰川边缘线退缩的影响,本研究根据格陵兰典型冰川边缘线退缩距离[18],向内构建了GIMP 2015年格陵兰冰盖边界的缓冲区,缓冲距离为500 m,以该缓冲区作为冰盖边界。本研究使用多源遥感数据划分格陵兰冰盖的冰流态,包括BedMachine冰面地形与冰盖厚度数据[19]和地球系统数据记录的研究环境应用(making earth system data records for use in research environments,MEaSUREs)项目生产的格陵兰冰盖2019年冰流速数据[20]。
2 研究方法
2.1 冰面融水遥感信息提取
格陵兰冰面融水由冰面河、冰面湖和注水冰裂隙组成,各组分的形态学特征不同,与影像背景的光谱对比也不同。因此,本研究利用多空间尺度遥感信息提取方法,提取冰面融水遥感信息。
大尺度冰面融水(冰面湖、宽阔冰面河、大型注水冰裂隙)与影像背景的光谱对比显著,本研究利用归一化水体指数(normalized difference water index,NDWI)[21]与阈值分割提取这些特征的遥感信息。本研究根据人工遥感解译确定阈值,不同影像的阈值介于0.25~0.40之间。
小尺度冰面融水(细小冰面河、小型注水冰裂隙)与影像背景光谱的对比不显著,本研究利用增强河流横纵断面特征的水系提取方法[13]提取。具体步骤是: 首先,利用带通离散傅里叶变换(bandpass discrete Fourier transformation,BDFT)去除NDWI影像中的低频背景(低于1/200 m-1)与高频噪声(高于1/40 m-1); 其次,利用Gabor滤波匹配不同方向的线状特征,增强河流的横剖面(宽度<2像元); 然后,利用形态学路径开(parsimonious path opening,PPO)算子[22],沿影像中的线状特征行进20像元,均匀该路径上的像元灰度值,从而增强河流的连通性; 最后,利用全局阈值分割提取这些特征的遥感信息。本研究根据人工目视解译确定阈值,范围为7~80。
本研究将大、小2个尺度的冰面融水遥感信息提取结果组合并镶嵌,得到了全格陵兰冰面融水遥感信息提取结果。整体技术流程如图2所示。
图2
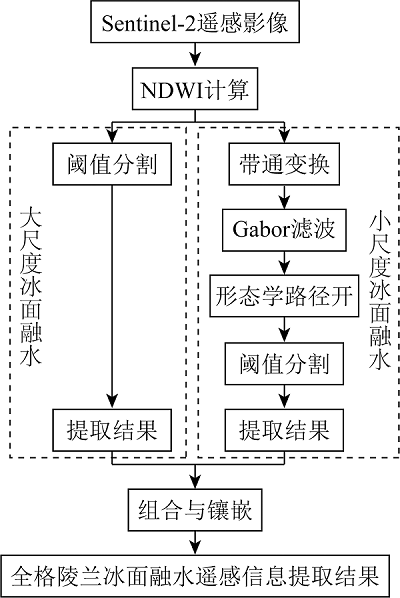
图2
格陵兰冰面融水卫星遥感信息提取方法
Fig.2
Flowchart for Greenland Ice Sheet surface meltwater information extraction from satellite imagery
将冰面融水遥感信息提取结果与5 km × 5 km的网格相交,得到了冰面融水的海拔上限。首先,本研究统计了落在各个网格内的冰面融水像元数目,去除了像元数目为0的网格。然后,将剩余的格网融合,得到一个环状多边形,多边形的内环即为冰面融水的上限。最后,利用指数核的多项式逼近(polynomial approximation with exponential kernel,PAEK)算法平滑这一上限,容差设置为10 km,得到冰面融水的海拔上限。
2.2 冰面融水组分识别
冰面河与冰面湖的形态差异十分明显,分别呈现出线状与面状的几何特征。ArcGIS软件的ArcScan工具可将宽度小于某一阈值的特征归为线,反之则归为面。因此,本研究利用ArcScan区分冰面河与冰面湖。结合目视解译与Yang等[13]研究结果,本研究将ArcScan的宽度阈值设置15个像元,相当于150 m,宽度小于该阈值的冰面融水归为冰面河,反之则归为冰面湖。
2.3 冰面融水体积估算
首先,利用经验公式[24]反演各像元冰面融水深度dpixel,如下式:
式中R为Sentinel-2影像红光波段大气层顶反射率。
然后,统计冰面融水遥感信息提取结果每个像元的冰面融水深度,计算冰面融水体积V,如下式:
式中Apixel为一个Sentinel-2像元的面积,即10 m × 10 m。
3 结果与讨论
3.1 全格陵兰冰面融水遥感观测结果
2019年消融旺盛期,格陵兰冰面融水面积为9 900.9 km2,体积为6.8 km3。而2017年1月南极冰面融水的面积为1 502.9 km2,体积为1.1 km3[25],分别相当于2019年消融旺盛期格陵兰冰面融水的15.2%和16.2%。这说明,在世界两大冰盖中,格陵兰冰盖表面发育了规模最大的冰面融水。
图3
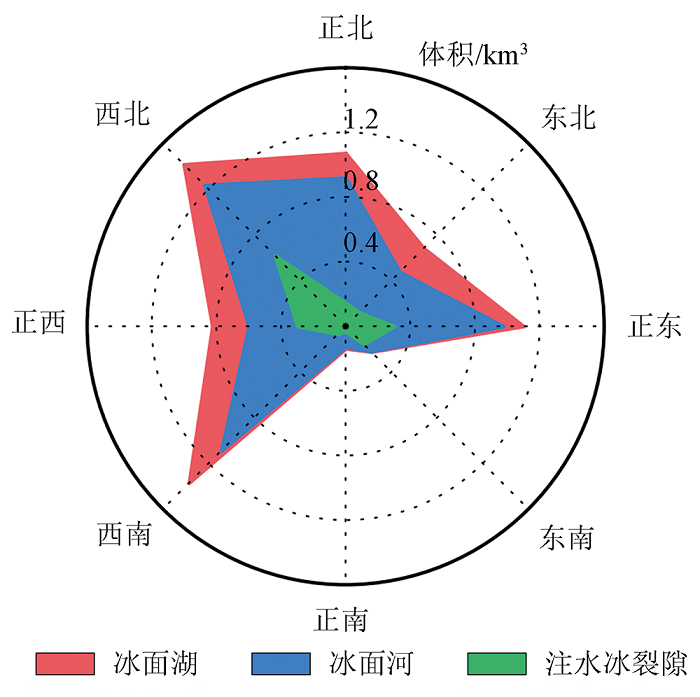
图3
2019年消融旺盛期格陵兰冰盖各流域冰面融水体积
Fig.3
Surface meltwater volume in basins of Greenland Ice Sheet in 2019 melt peak time period
冰面河是格陵兰冰面融水的主要组成部分,体积约为冰面湖或注水冰裂隙的2~3倍(图3)。冰面河在冰面水系中的体积占比最高,达到了57.1%; 注水冰裂隙次之,为25.6%; 冰面湖的体积占比最低,为17.3%。这说明格陵兰冰盖表面发育了活跃的水文系统,冰面河不断将大量冰面融水输送进入冰前区域或冰盖内部。与格陵兰冰盖不同,南极冰盖西部冰面融水的主要组成部分是冰面湖(96.1%)[25],冰面融水大多存储在冰盖表面。高海拔地区的冰面湖容易被浮冰覆盖,受限于光学遥感观测,本研究未提取被浮冰覆盖的冰面湖区域的遥感信息。不同于光学遥感观测,Sentinel-1卫星搭载的C波段合成孔径雷达能观测到被浮冰覆盖的冰面融水[30⇓-32],因此后续研究可结合Sentinel-1数据进一步提升全格陵兰冰面融水遥感观测精度。
图4
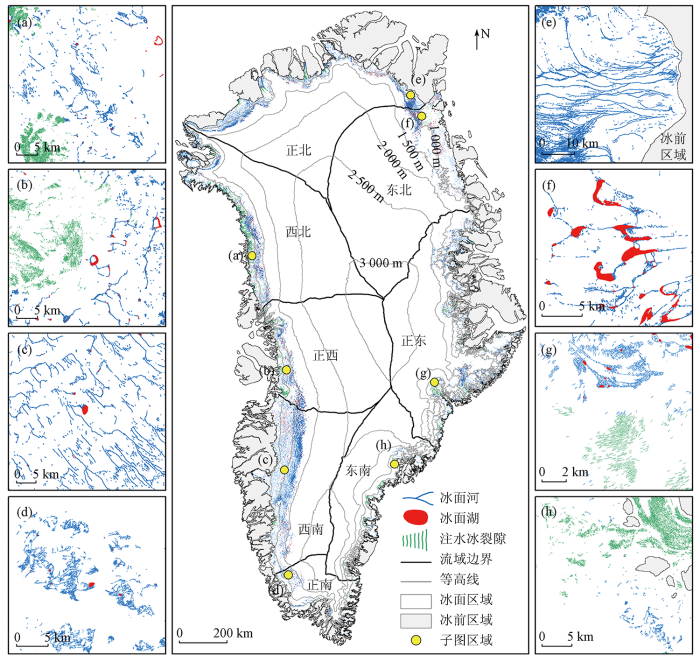
图4
2019年消融旺盛期格陵兰冰面融水空间分布
Fig.4
Spatial distribution of surface meltwater on Greenland Ice Sheet in 2019 melt peak time period
在大多数流域,冰面河是冰面融水的主要组成部分。然而在东南流域,冰面融水主要由注水冰裂隙组成,这可能是由于东南流域冰面海拔较高,冰面消融较弱; 此外,东南流域存在大量粒雪[34],冰面融水渗入粒雪内部,不易出露于冰盖表面。这2种因素可能共同限制了海拔较高的冰面河与冰面湖的发育,使得冰面融水主要分布在海拔较低的注水冰裂隙内。
3.2 对比RACMO模拟的冰面融水径流与遥感观测的冰面融水
2019年消融旺盛期,RACMO模拟的冰面融水径流区域与遥感观测的冰面融水分布区域基本一致,两者的海拔上限在大多数流域也基本吻合(图5)。然而,在东南和正南流域,RACMO模拟的冰面融水径流区域海拔上限明显高于遥感观测结果(图5)。不同于其他流域,东南和正南流域分布着大量的粒雪[34],大量融水渗入粒雪,融水不易出露于冰盖表面; 相反,在格陵兰冰盖北部和西部,裸冰[35]与冰板[36]大量分布,融水不易渗入裸冰与冰板,容易出露于冰盖表面。因此,RACMO模型可能未准确模拟冰盖的融水保持能力[14]。由于RACMO模拟的冰面融水径流区域存在一定的误差,因此,本研究在后续分析中,利用遥感观测结果,约束RACMO模拟的冰面融水径流区域。
图5

图5
2019年消融旺盛期格陵兰冰盖日均冰面融水径流量与冰面融水海拔上限
Fig.5
Surface meltwater runoff and elevational limit of Greenland Ice Sheet in 2019 melt peak time period
图6
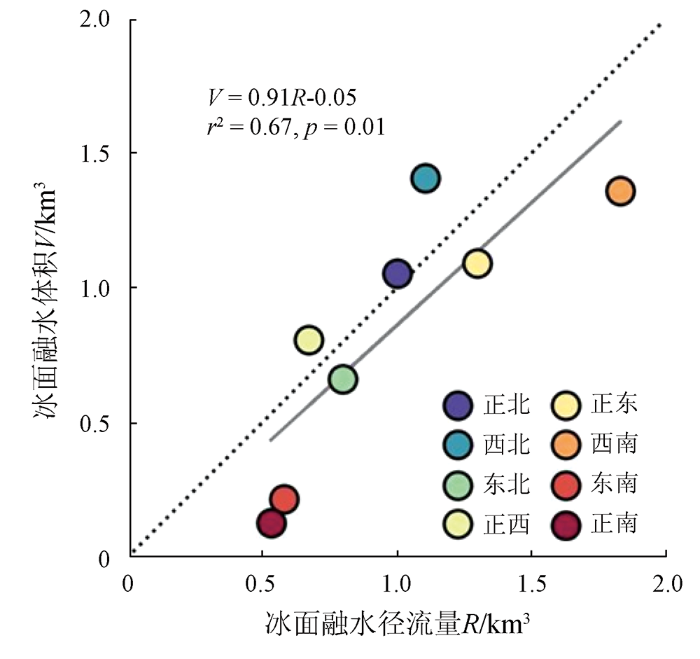
图6
2019年消融旺盛期格陵兰冰盖8个主要流域冰面融水体积与日均冰面融水径流量
Fig.6
Surface meltwater volume and daily averaged runoff in eight major basins of Greenland Ice Sheet in 2019 melt peak time period
RACMO模拟结果显示,从2019年消融期开始(2019年5月1日),至主要成像时段的中点日期(2019年8月1日),格陵兰冰盖产生了约378.9 km3的累积冰面融水径流量。遥感观测结果显示,在消融中期(2019年8月1日,主要成像时段的中点日期),格陵兰冰面融水体积为6.8 km3(忽略冰面融水体积在成像时段内的变化),占累积冰面融水径流量的1.8%。这说明,冰面滞留融水的能力有限,98.2%的冰面融水进入了冰盖内部或者离开冰盖汇入大洋。此外,研究进一步发现,从冰盖北侧到冰盖南侧,冰面滞留融水的能力不断减弱(图7): 在位于冰盖北部的3个流域(西北、正北、东北),冰面融水体积约占累积冰面融水径流量的2.5%; 在位于冰盖中部的2个流域(正西,正东),这一比值下降至约2.0%; 在位于冰盖南部的3个流域(西南,正南,东南),这一比值进一步下降至0.9%(图7)。
图7
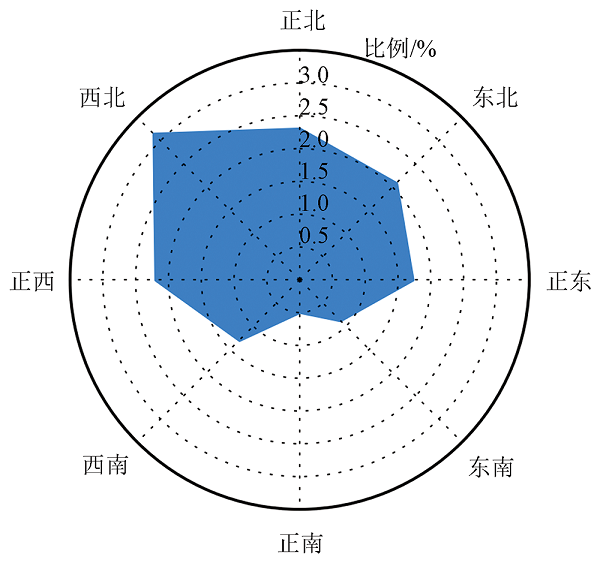
图7
2019年消融旺盛期冰面融水体积占累积冰面融水径流量的比例
Fig.7
Ratio of surface meltwater volume to cumulative surface meltwater runoff of Greenland Ice Sheet in 2019 melt peak time period
4 结论
本研究利用10 m空间分辨率的Sentinel-2影像提取了2019年消融旺盛期全格陵兰冰面融水的遥感信息,反演了冰面融水的体积。结果表明:
1)格陵兰冰面融水的面积为9 900.9 km2,体积为6.8 km3,空间分布极不平衡,呈现出明显的“西多东少”“北多南少”的态势,冰盖西部、北部的冰面融水体积分别为冰盖东部、南部的1.8倍。
2)格陵兰冰盖表面发育了活跃的水文系统,超过一半的格陵兰冰面融水被冰面河输送,注水冰裂隙与冰面湖分别仅存储了25.6%与17.3%的冰面融水。
3)格陵兰冰面融水主要发育在冰盖边缘的低海拔区域,不同流域冰面融水的形态与主要组成部分存在显著差异。
进一步对比了遥感观测的冰面融水与RACMO模拟的冰面融水径流,结果表明,在大多数流域,RACMO模型模拟的冰面融水径流区域与遥感观测的冰面融水分布区域基本一致。格陵兰冰盖对冰面融水的存储能力有限,在2019年消融中期,约1.8%的冰面融水存储在冰盖表面。
本研究显示出高分遥感在格陵兰冰面水文研究中的应用潜力。未来研究可利用多个时相的高分遥感数据,进一步了解格陵兰冰面水文过程。
参考文献
On the recent contribution of the Greenland ice sheet to sea level change
[J].
DOI:10.5194/tc-10-1933-2016
URL
[本文引用: 2]

. We assess the recent contribution of the Greenland ice sheet (GrIS) to sea level change. We use the mass budget method, which quantifies ice sheet mass balance (MB) as the difference between surface mass balance (SMB) and solid ice discharge across the grounding line (D). A comparison with independent gravity change observations from GRACE shows good agreement for the overlapping period 2002–2015, giving confidence in the partitioning of recent GrIS mass changes. The estimated 1995 value of D and the 1958–1995 average value of SMB are similar at 411 and 418 Gt yr−1, respectively, suggesting that ice flow in the mid-1990s was well adjusted to the average annual mass input, reminiscent of an ice sheet in approximate balance. Starting in the early to mid-1990s, SMB decreased while D increased, leading to quasi-persistent negative MB. About 60 % of the associated mass loss since 1991 is caused by changes in SMB and the remainder by D. The decrease in SMB is fully driven by an increase in surface melt and subsequent meltwater runoff, which is slightly compensated by a small ( < 3 %) increase in snowfall. The excess runoff originates from low-lying ( < 2000 m a.s.l.) parts of the ice sheet; higher up, increased refreezing prevents runoff of meltwater from occurring, at the expense of increased firn temperatures and depleted pore space. With a 1991–2015 average annual mass loss of ∼ 0.47 ± 0.23 mm sea level equivalent (SLE) and a peak contribution of 1.2 mm SLE in 2012, the GrIS has recently become a major source of global mean sea level rise.\n
Mass balance of the Greenland ice sheet from 1992 to 2018
[J].DOI:10.1038/s41586-019-1855-2 [本文引用: 1]
Understanding Greenland ice sheet hydrology using an integrated multi-scale approach
[J].DOI:10.1088/1748-9326/8/1/015017 URL [本文引用: 1]
Surface melt-induced acceleration of Greenland ice-sheet flow
[J].Ice flow at a location in the equilibrium zone of the west-central Greenland Ice Sheet accelerates above the midwinter average rate during periods of summer melting. The near coincidence of the ice acceleration with the duration of surface melting, followed by deceleration after the melting ceases, indicates that glacial sliding is enhanced by rapid migration of surface meltwater to the ice-bedrock interface. Interannual variations in the ice acceleration are correlated with variations in the intensity of the surface melting, with larger increases accompanying higher amounts of summer melting. The indicated coupling between surface melting and ice-sheet flow provides a mechanism for rapid, large-scale, dynamic responses of ice sheets to climate warming.
Efficient meltwater drainage through supraglacial streams and rivers on the southwest Greenland ice sheet
[J].
DOI:10.1073/pnas.1413024112
PMID:25583477
[本文引用: 1]
Thermally incised meltwater channels that flow each summer across melt-prone surfaces of the Greenland ice sheet have received little direct study. We use high-resolution WorldView-1/2 satellite mapping and in situ measurements to characterize supraglacial water storage, drainage pattern, and discharge across 6,812 km(2) of southwest Greenland in July 2012, after a record melt event. Efficient surface drainage was routed through 523 high-order stream/river channel networks, all of which terminated in moulins before reaching the ice edge. Low surface water storage (3.6 ± 0.9 cm), negligible impoundment by supraglacial lakes or topographic depressions, and high discharge to moulins (2.54-2.81 cm⋅d(-1)) indicate that the surface drainage system conveyed its own storage volume every <2 d to the bed. Moulin discharges mapped inside ∼52% of the source ice watershed for Isortoq, a major proglacial river, totaled ∼41-98% of observed proglacial discharge, highlighting the importance of supraglacial river drainage to true outflow from the ice edge. However, Isortoq discharges tended lower than runoff simulations from the Modèle Atmosphérique Régional (MAR) regional climate model (0.056-0.112 km(3)⋅d(-1) vs. ∼0.103 km(3)⋅d(-1)), and when integrated over the melt season, totaled just 37-75% of MAR, suggesting nontrivial subglacial water storage even in this melt-prone region of the ice sheet. We conclude that (i) the interior surface of the ice sheet can be efficiently drained under optimal conditions, (ii) that digital elevation models alone cannot fully describe supraglacial drainage and its connection to subglacial systems, and (iii) that predicting outflow from climate models alone, without recognition of subglacial processes, may overestimate true meltwater export from the ice sheet to the ocean.
Fracture propagation to the base of the Greenland Ice Sheet during supraglacial lake drainage
[J].
DOI:10.1126/science.1153360
PMID:18420900
[本文引用: 1]
Surface meltwater that reaches the base of an ice sheet creates a mechanism for the rapid response of ice flow to climate change. The process whereby such a pathway is created through thick, cold ice has not, however, been previously observed. We describe the rapid (<2 hours) drainage of a large supraglacial lake down 980 meters through to the bed of the Greenland Ice Sheet initiated by water-driven fracture propagation evolving into moulin flow. Drainage coincided with increased seismicity, transient acceleration, ice-sheet uplift, and horizontal displacement. Subsidence and deceleration occurred over the subsequent 24 hours. The short-lived dynamic response suggests that an efficient drainage system dispersed the meltwater subglacially. The integrated effect of multiple lake drainages could explain the observed net regional summer ice speedup.
Assessing the summer water budget of a moulin basin in the Sermeq Avannarleq ablation region,Greenland ice sheet
[J].
DOI:10.3189/002214311798043735
URL
[本文引用: 1]
We provide an assessment of the supraglacial water budget of a moulin basin on the western margin of the Greenland ice sheet for 15 days in August 2009. Meltwater production, the dominant input term to the 1.14 ± 0.06 km2 basin, was determined from in situ ablation measurements. The dominant water-output terms from the basin, accounting for 52% and 48% of output, respectively, were moulin discharge and drainage into crevasses. Moulin discharge exhibits large diurnal variability (0.017–0.54 m3 s−1) with a distinct late-afternoon peak at 16:45 local time. This lags peak meltwater production by ∼2.8 ± 4.2 hours. An Extreme Ice Survey time-lapse photography sequence complements the observations of moulin discharge. We infer, from in situ observations of moulin geometry, previously published borehole water heights and estimates of the temporal lag between meltwater production and observed local ice surface uplift (‘jacking’), that the transfer of surface meltwater to the englacial water table via moulins is nearly instantaneous (<30 min). We employ a simple crevasse mass-balance model to demonstrate that crevasse drainage could significantly dampen the surface meltwater fluctuations reaching the englacial system in comparison to moulin discharge. Thus, unlike crevasses, moulins propagate meltwater pulses to the englacial system that are capable of overwhelming subglacial transmission capacity, resulting in enhanced basal sliding.
An increase in crevasse extent,West Greenland:Hydrologic implications
[J].
Distribution and evolution of supraglacial lakes in Greenland during the 2016—2018 melt seasons
[J].
DOI:10.3390/rs14010055
URL
[本文引用: 1]
In recent decades, the melting of the Greenland Ice Sheet (GrIS) has become one of the major causes of global sea-level rise. Supraglacial lakes (SGLs) are typical hydrological features produced on the surface of the GrIS during the melt seasons. The existence and evolution of SGLs play an important role in the melting process of the ice sheet surface. To understand the distribution and recent changes of SGLs in Greenland, this study developed a random forest (RF) algorithm incorporating the texture and morphological features to automatically identify SGLs based on the Google Earth Engine (GEE) platform. Sentinel-2 imagery was used to map the SGLs inventory in Greenland during the 2016–2018 melt seasons and to explore the spatial and temporal variability characteristics of SGLs. Our results show changes in SGLs from 2016 to 2018, with the total area decreasing by ~1152.22 km2 and the number increasing by 1134; SGLs are mainly distributed in western Greenland (SW, CW, NW) and northeastern Greenland (NE), where the NE region has the largest number of observed SGLs and the largest SGL was with the surface area of 16.60 km2 (2016). SGLs were found to be most active in the area with the elevation of 800–1600 m and the slope of 0–5°, and showed a phenomenon of retreating to lower elevation areas and developing to steeper slope areas. Our work provided a method for rapid inventory of SGLs. This study will help monitor the mass balance of the GrIS and predict future rapid ice loss from Greenland.
Fast draining lakes on the Greenland Ice Sheet
[J].
Contrasting regional variability of buried meltwater extent over 2 years across the Greenland ice sheet
[J].
DOI:10.5194/tc-15-2983-2021
URL
[本文引用: 1]
. The Greenland Ice Sheet (GrIS) rapid mass loss is primarily driven by an increase in meltwater runoff, which highlights the importance of understanding the formation, evolution, and impact of meltwater features on the ice sheet. Buried lakes are meltwater features that contain liquid water and exist under layers of snow, firn, and/or ice. These lakes are invisible in optical imagery, challenging the analysis of their evolution and implication for larger GrIS dynamics and mass change. Here, we present a method that uses a convolutional neural network, a deep learning method, to automatically detect buried lakes across the GrIS. For the years 2018 and 2019 (which represent low- and high-melt years, respectively), we compare total areal extent of both buried and surface lakes across six regions, and we use a regional climate model to explain the spatial and temporal differences. We find that the total buried lake extent after the 2019 melt season is 56 % larger than after the 2018 melt season across the entire ice sheet. Northern Greenland has the largest increase in buried lake extent after the 2019 melt season, which we attribute to late-summer surface melt and high autumn temperatures. We also provide evidence that different processes are responsible for buried lake formation in different regions of the ice sheet. For example, in southwest Greenland, buried lakes often appear on the surface during the previous melt season, indicating that these meltwater features form when surface lakes partially freeze and become insulated as snowfall buries them. Conversely, in southeast Greenland, most buried lakes never appear on the surface, indicating that these features may form due to downward percolation of meltwater and/or subsurface penetration of shortwave radiation. We provide support for these processes via the use of a physics-based snow model. This study provides additional perspective on the potential role of meltwater on GrIS dynamics and mass loss.\n
Controls on water storage and drainage in crevasses on the Greenland Ice Sheet
[J].
Supraglacial rivers on the northwest Greenland Ice Sheet,Devon Ice Cap,and Barnes ice cap mapped using Sentinel-2 imagery
[J].DOI:10.1016/j.jag.2019.01.008 URL [本文引用: 3]
Increasing surface runoff from Greenland’s firn areas
[J].
DOI:10.1038/s41558-022-01371-z
PMID:35811787
[本文引用: 3]
At high elevations of ice sheets, melting snow generally percolates and refreezes, so does not contribute to the shrinking of the ice sheet. Here, we systematically map the runoff area of the Greenland ice sheet, using surface rivers visible on satellite imagery. Between 1985 and 2020, the maximum runoff elevation rose by 58-329 metres, expanding the runoff area by 29% (-8%/+6%). Excess melt beyond the refreezing capacity of pores in snowfall has created near-impermeable ice slabs that sustain surface runoff even in cooler summers. We show that two surface mass balance models over-estimate the runoff area by 16-30%. Once restricted to our observed areas they indicate that 5-10% of recent runoff likely comes from the expanded runoff area. Runoff from higher elevations is sensitive to projected warming as further increases in the runoff limit will increase the runoff area disproportionately.
GrSMBMIP:intercomparison of the modelled 1980—2012 surface mass balance over the Greenland Ice Sheet
[J].
DOI:10.5194/tc-14-3935-2020
URL
[本文引用: 1]
. Observations and models agree that the Greenland Ice Sheet (GrIS)\nsurface mass balance (SMB) has decreased since the end of the 1990s due to\nan increase in meltwater runoff and that this trend will accelerate in the\nfuture. However, large uncertainties remain, partly due to different\napproaches for modelling the GrIS SMB, which have to weigh physical\ncomplexity or low computing time, different spatial and temporal\nresolutions, different forcing fields, and different ice sheet\ntopographies and extents, which collectively make an inter-comparison\ndifficult. Our GrIS SMB model intercomparison project (GrSMBMIP) aims to\nrefine these uncertainties by intercomparing 13 models of four types which\nwere forced with the same ERA-Interim reanalysis forcing fields, except for\ntwo global models. We interpolate all modelled SMB fields onto a common ice\nsheet mask at 1 km horizontal resolution for the period 1980–2012 and score\nthe outputs against (1) SMB estimates from a combination of gravimetric\nremote sensing data from GRACE and measured ice discharge; (2) ice cores,\nsnow pits and in situ SMB observations; and (3) remotely sensed bare ice extent\nfrom MODerate-resolution Imaging Spectroradiometer (MODIS). Spatially, the\nlargest spread among models can be found around the margins of the ice\nsheet, highlighting model deficiencies in an accurate representation of the\nGrIS ablation zone extent and processes related to surface melt and runoff.\nOverall, polar regional climate models (RCMs) perform the best compared to\nobservations, in particular for simulating precipitation patterns. However,\nother simpler and faster models have biases of the same order as RCMs\ncompared with observations and therefore remain useful tools for long-term\nsimulations or coupling with ice sheet models. Finally, it is interesting to\nnote that the ensemble mean of the 13 models produces the best estimate of\nthe present-day SMB relative to observations, suggesting that biases are not\nsystematic among models and that this ensemble estimate can be used as a\nreference for current climate when carrying out future model developments.\nHowever, a higher density of in situ SMB observations is required,\nespecially in the south-east accumulation zone, where the model spread can\nreach 2 m w.e. yr−1 due to large discrepancies in modelled snowfall accumulation.\n
Modelling the climate and surface mass balance of polar ice sheets using RACMO2-Part 1:Greenland (1958—2016)
[J].
DOI:10.5194/tc-12-811-2018
URL
[本文引用: 1]
. We evaluate modelled Greenland ice sheet (GrIS) near-surface climate, surface energy balance (SEB) and surface mass balance (SMB) from the updated regional climate model RACMO2 (1958–2016). The new model version, referred to as RACMO2.3p2, incorporates updated glacier outlines, topography and ice albedo fields. Parameters in the cloud scheme governing the conversion of cloud condensate into precipitation have been tuned to correct inland snowfall underestimation: snow properties are modified to reduce drifting snow and melt production in the ice sheet percolation zone. The ice albedo prescribed in the updated model is lower at the ice sheet margins, increasing ice melt locally. RACMO2.3p2 shows good agreement compared to in situ meteorological data and point SEB/SMB measurements, and better resolves the spatial patterns and temporal variability of SMB compared with the previous model version, notably in the north-east, south-east and along the K-transect in south-western Greenland. This new model version provides updated, high-resolution gridded fields of the GrIS present-day climate and SMB, and will be used for projections of the GrIS climate and SMB in response to a future climate scenario in a forthcoming study.\n
Calving Front Machine (CALFIN):Glacial termini dataset and automated deep learning extraction method for Greenland,1972—2019
[J].
DOI:10.5194/tc-15-1663-2021
URL
[本文引用: 1]
. Sea level contributions from the Greenland Ice Sheet are influenced by the rapid changes in glacial terminus positions. The documentation of these evolving calving front positions, for which satellite imagery forms the basis, is therefore important. However, the manual delineation of these calving fronts is time consuming, which limits the availability of these data across a wide spatial and temporal range. Automated methods face challenges that include the handling of clouds, illumination differences, sea ice mélange, and Landsat 7 scan line corrector errors. To address these needs, we develop the Calving Front Machine (CALFIN), an automated method for extracting calving fronts from satellite images of marine-terminating glaciers, using neural networks. The results are often indistinguishable from manually curated fronts, deviating by on average 86.76 ± 1.43 m from the measured front. Landsat imagery from 1972 to 2019 is used to generate 22 678 calving front lines across 66 Greenlandic glaciers. This improves on the state of the art in terms of the spatiotemporal coverage and accuracy of its outputs and is validated through a comprehensive intercomparison with existing studies. The current implementation offers a new opportunity to explore subseasonal and regional trends on the extent of Greenland's margins and supplies new constraints for simulations of the evolution of the mass balance of the Greenland Ice Sheet and its contributions to future sea level rise.\n
MEaSUREs Greenland annual ice sheet velocity mosaics from SAR and Landsat,Version 3
[Z].Boulder,Colorado USA:NASA National Snow and Ice Data Center Distributed Active Archive Center,
The use of the normalized difference water index (NDWI) in the delineation of open water features
[J].DOI:10.1080/01431169608948714 URL [本文引用: 1]
Path openings and closings
[J].DOI:10.1007/s10851-005-4885-3 URL [本文引用: 1]
Flow dynamics and iceberg calving rates of Devon Ice Cap,Nunavut,Canada
[J].
DOI:10.3189/172756505781829430
URL
[本文引用: 2]
The surface velocity field of Devon Ice Cap, Nunavut, Canada, was mapped using interferometric synthetic aperture radar (InSAR). Ascending European Remote-sensing Satellite 1 and 2 (ERS-1/-2) tandem mode data were used for the western and southeast sectors, and 3 day repeat pass ERS-1 imagery for the northeast sector. Speckle-tracking procedures were used with RADARSAT 1 imagery to obtain surface velocities over the terminus of Belcher Glacier (a major calving front) where decorrelation between ERS data occurred. The InSAR data highlight a significant contrast in ice-flow dynamics between the east and west sides of the ice cap. Ice movement west of the main north–south divide is dominated by relatively uniform ‘sheet’ flow, but three fast-flowing outlet glaciers that extend 14–23km beyond the ice-cap margin also drain this region. Several outlet glaciers that extend up to 60 km inland from the eastern margin drain the eastern side of the ice cap. The dominant ice-flow regimes were classified based on the relationship between the driving stress (averaged over a length scale of ten ice thicknesses) and the ratio of surface velocity to ice thickness. The mapped distribution of flow regimes appears to depict the spatial extent of basal sliding across the ice cap. This is supported by a close relationship between the occurrence of flow stripes on the ice surface and flow regimes where basal sliding was found to be an important component of the glacier motion. Iceberg calving rates were computed using measured surface velocities and ice thicknesses derived from airborne radio-echo sounding. The volume of ice calved between 1960 and 1999 was estimated to be 20.5 ± 4.7 km3 (or 0.57 km3 a–1). Approximately 89% of this loss occurred along the eastern margin. The largest single source is Belcher Glacier, which accounts for ~50% of the total amount of ice calved.
Dual-satellite (Sentinel-2 and Landsat 8) remote sensing of supraglacial lakes in Greenland
[J].
DOI:10.5194/tc-12-3045-2018
URL
[本文引用: 1]
. Remote sensing is commonly used to monitor supraglacial lakes on\nthe Greenland Ice Sheet (GrIS); however, most satellite records must trade off\nhigher spatial resolution for higher temporal resolution (e.g. MODIS) or vice\nversa (e.g. Landsat). Here, we overcome this issue by developing and applying\na dual-sensor method that can monitor changes to lake areas and volumes at\nhigh spatial resolution (10–30 m) with a frequent revisit time (∼3 days). We achieve this by mosaicking imagery from the Landsat 8 Operational Land Imager (OLI) with\nimagery from the recently launched Sentinel-2 Multispectral Instrument (MSI) for a ∼12 000 km2 area of West Greenland in the 2016 melt season. First, we\nvalidate a physically based method for calculating lake depths with\nSentinel-2 by comparing measurements against those derived from the available\ncontemporaneous Landsat 8 imagery; we find close correspondence between the\ntwo sets of values (R2=0.841; RMSE = 0.555 m). This provides us\nwith the methodological basis for automatically calculating lake areas,\ndepths, and volumes from all available Landsat 8 and Sentinel-2 images. These\nautomatic methods are incorporated into an algorithm for Fully Automated\nSupraglacial lake Tracking at Enhanced Resolution (FASTER). The FASTER\nalgorithm produces time series showing lake evolution during the 2016 melt\nseason, including automated rapid (≤4 day) lake-drainage identification.\nWith the dual Sentinel-2–Landsat 8 record, we identify 184 rapidly draining\nlakes, many more than identified with either imagery collection alone (93\nwith Sentinel-2; 66 with Landsat 8), due to their inferior temporal\nresolution, or would be possible with MODIS, due to its omission of small\nlakes <0.125 km2. Finally, we estimate the water volumes drained\ninto the GrIS during rapid-lake-drainage events and, by analysing downscaled\nregional climate-model (RACMO2.3p2) run-off data, the water quantity that\nenters the GrIS via the moulins opened by such events. We find that during\nthe lake-drainage events alone, the water drained by small lakes (<0.125 km2) is only 5.1 % of the total water volume drained by all\nlakes. However, considering the total water volume entering the GrIS after\nlake drainage, the moulins opened by small lakes deliver 61.5 % of the\ntotal water volume delivered via the moulins opened by large and small lakes;\nthis is because there are more small lakes, allowing more moulins to open,\nand because small lakes are found at lower elevations than large lakes, where\nrun-off is higher. These findings suggest that small lakes should be included\nin future remote-sensing and modelling work.\n
An inventory of supraglacial lakes and channels across the West Antarctic ice sheet
[J].
DOI:10.5194/essd-14-209-2022
URL
[本文引用: 2]
. Quantifying the extent and distribution of supraglacial hydrology, i.e. lakes\nand streams, is important for understanding the mass balance of the Antarctic\nice sheet and its consequent contribution to global sea-level rise. The\nexistence of meltwater on the ice surface has the potential to affect ice\nshelf stability and grounded ice flow through hydrofracturing and the\nassociated delivery of meltwater to the bed. In this study, we systematically\nmap all observable supraglacial lakes and streams in West Antarctica by\napplying a semi-automated Dual-NDWI (normalised difference water index)\napproach to >2000 images acquired by the Sentinel-2 and Landsat-8\nsatellites during January 2017. We use a K-means clustering method to\npartition water into lakes and streams, which is important for understanding\nthe dynamics and inter-connectivity of the hydrological system. When compared\nto a manually delineated reference dataset on three Antarctic test sites, our\napproach achieves average values for sensitivity (85.3 % and\n77.6 %), specificity (99.1 % and 99.7 %) and\naccuracy (98.7 % and 98.3 %) for Sentinel-2 and Landsat-8\nacquisitions, respectively. We identified 10 478 supraglacial features\n(10 223 lakes and 255 channels) on the West Antarctic Ice Sheet (WAIS) and\nAntarctic Peninsula (AP), with a combined area of 119.4 km2\n(114.7 km2 lakes, 4.7 km2 channels). We found\n27.3 % of feature area on grounded ice and 54.9 % on\nfloating ice shelves. In total, 17.8 % of feature area crossed the\ngrounding line. A recent expansion in satellite data provision made new\ncontinental-scale inventories such as these, the first produced for WAIS and\nAP, possible. The inventories provide a baseline for future studies and a\nbenchmark to monitor the development of Antarctica's surface hydrology in a\nwarming world and thus enhance our capability to predict the collapse of ice\nshelves in the future. The dataset is available at\nhttps://doi.org/10.5281/zenodo.5642755 (Corr et al., 2021).\n
A decade (2002—2012) of supraglacial lake volume estimates across Russell Glacier,West Greenland
[J].
DOI:10.5194/tc-8-107-2014
URL
[本文引用: 1]
. Supraglacial lakes represent an ephemeral storage buffer for meltwater runoff and lead to significant, yet short-lived, episodes of ice-flow acceleration by decanting large meltwater and energy fluxes into the ice sheet's hydrological system. Here, a methodology for calculating lake volume is used to quantify storage and drainage across Russell Glacier, West Greenland, between 2002 and 2012. Using 502 MODIS scenes, water volume at ~200 seasonally occurring lakes was derived using a depth–reflectance relationship, which was independently calibrated and field validated against lake bathymetry. The inland expansion of lakes is strongly correlated with air temperature: during the record melt years of 2010 and 2012, lakes formed and drained earlier, attaining their maximum volume 38 and 20 days earlier than the 11 yr mean, as well as occupying a greater area and forming at higher elevations (> 1800 m) than previously. Despite occupying under 2% of the study area, lakes delay the transmission of up to 7–13% of the bulk meltwater discharged. Although the results are subject to an observational bias caused by periods of cloud cover, we estimate that across Russell Glacier, 28% of supraglacial lakes drain rapidly (< 4 days). Clustering of such events in space and time suggests a synoptic trigger mechanism. Further, we find no evidence to support a unifying critical size or depth-dependent drainage threshold.
Supraglacial lakes on the Greenland ice sheet advance inland under warming climate
[J].DOI:10.1038/nclimate2463 [本文引用: 1]
Seasonal evolution of supraglacial lakes and rivers on the southwest Greenland Ice Sheet
[J].
DOI:10.1017/jog.2021.10
URL
[本文引用: 1]
Supraglacial lakes and rivers dominate the storage and transport of meltwater on the southwest Greenland Ice Sheet (GrIS) surface. Despite functioning as interconnected hydrologic networks, supraglacial lakes and rivers are commonly studied as independent features, resulting in an incomplete understanding of their collective impact on meltwater storage and routing. We use Landsat 8 satellite imagery to assess the seasonal evolution of supraglacial lakes and rivers on the southwest GrIS during the 2015 melt season. Remotely sensed meltwater areas and volumes are compared with surface runoff simulations from three climate models (MERRA-2, MAR 3.6 and RACMO 2.3), and with in situ observations of proglacial discharge in the Watson River. We find: (1) at elevations >1600 m, 21% of supraglacial lakes and 28% of supraglacial rivers drain into moulins, signifying the presence of high-elevation surface-to-bed meltwater connections even during a colder-than-average melt season; (2) while supraglacial lakes dominate instantaneous surface meltwater storage, supraglacial rivers dominate total surface meltwater area and discharge; (3) the combined surface area of supraglacial lakes and rivers is strongly correlated with modeled surface runoff; and (4) of the three models examined here, MERRA-2 runoff yields the highest overall correlation with observed proglacial discharge in the Watson River.
Supraglacial streamflow and meteorological drivers from southwest Greenland
[J].
DOI:10.5194/tc-16-2245-2022
URL
[本文引用: 1]
. Greenland ice sheet surface runoff is drained through supraglacial\nstream networks. This evacuation influences surface mass balance as well as\nice dynamics. However, in situ observations of meltwater discharge through\nthese stream networks are rare. In this study, we present 46 discrete\ndischarge measurements and continuous water level measurements for 62 d\nspanning the majority of of the melt season (13 June to 13 August) in 2016 for a 0.6 km2 supraglacial stream catchment in southwest Greenland. The result is\nan unprecedentedly long record of supraglacial discharge that captures both\ndiurnal variability and changes over the melt season. A comparison of\nsurface energy fluxes to stream discharge reveals shortwave radiation as the\nprimary driver of melting. However, during high-melt episodes, the\ncontribution of shortwave radiation to melt energy is reduced by\n∼40 % (from 1.13 to 0.73 proportion). Instead, the relative\ncontribution of longwave radiation, sensible heat fluxes, and latent heat fluxes to\noverall melt increases by ∼24 %, 6 %, and 10 %\n(proportion increased from −0.32 to −0.08, 0.28 to 0.34, and −0.04 to 0.06)\nrespectively. Our data also identify that the timing of daily maximum\ndischarge during clear-sky days shifts from 16:00 local time (i.e., 2 h\n45 min after solar noon) in late June to 14:00 in late July and then\nrapidly returns to 16:00 in early August. The change in the timing of daily\nmaximum discharge could be attributed to the expansion and contraction of\nthe stream network, caused by skin temperatures that likely fell below freezing at night.\nThe abrupt shift, in early August, in the timing of daily maximum discharge\ncoincides with a drop in air temperature, a drop in the amount of water temporarily stored in\nweathering crust, and a decreasing covariance between stream velocity and\ndischarge. Further work is needed to investigate if these results can be\ntransferable to larger catchments and uncover if rapid shifts in\nthe timing of peak discharge are widespread across Greenland supraglacial streams and\nthus have an impact on meltwater delivery to the subglacial system\nand ice dynamics.\n
格陵兰冰盖次表面湖多源遥感监测——以格陵兰中西部流域为例
[J].
Extraction of Greenland Ice Sheet buried lakes using multi-source remote sensing data:With application to the central west basin of Greenland
[J].
Automatic supraglacial lake extraction in Greenland using Sentinel-1 SAR images and attention-based U-Net
[J].
DOI:10.3390/rs14194998
URL
[本文引用: 1]
With global warming, supraglacial lakes play an important role in ice sheet stability and climate change. They are not only the main factors affecting mass balance and sea-level rise but also the key units of surface runoff storage and mass loss. To automatically map the spatiotemporal distribution of supraglacial lakes in Greenland, this paper proposes an attention-based U-Net model with Sentinel-1 SAR imagery. The extraction results show that compared with the traditional network, this method obtains a higher validation coefficient, with an F1 score of 0.971, and it is spatiotemporally transferable, able to realize the extraction of supraglacial lakes in complex areas without ignoring small lakes. In addition, we conducted a case study in the Jakobshavn region and found that the supraglacial lake area peaked in advance between spring and summer due to extreme melting events from 2017 to 2021. Meanwhile, the supraglacial lakes near the 79°N Glacier tended to expand inland during the melting season.
Perennial supraglacial lakes in Northeast Greenland observed by polarimetric SAR
[J].
DOI:10.3390/rs12172798
URL
[本文引用: 1]
Supraglacial liquid water at the margins of ice sheets has an important impact on the surface energy balance and can also influence the ice flow when supraglacial lakes drain to the bed. Optical imagery is able to monitor supraglacial lakes during the summer season. Here we developed an alternative method using polarimetric SAR from Sentinel-1 during 2017–2020 to distinguish between liquid water and other surface types at the margin of the Northeast Greenland Ice Stream. This allows the supraglacial hydrology to be monitored during the winter months too. We found that the majority of supraglacial lakes persist over winter. When comparing our results to optical data, we found significantly more water. Even during summer, many lakes are partly or fully covered by a lid of ice and snow. We used our classification results to automatically map the outlines of supraglacial lakes, create time series of water area for each lake, and hence detect drainage events. We even found several winter time drainages, which might have an important effect on ice flow. Our method has problems during the peak of the melt season, but for the rest of the year it provides crucial information for better understanding the component of supraglacial hydrology in the glaciological system.
Northeast sector of the Greenland ice sheet to undergo the greatest inland expansion of supraglacial lakes during the 21st century
[J].DOI:10.1002/grl.v43.18 URL [本文引用: 1]
Spatial extent and temporal variability of Greenland firn aquifers detected by ground and airborne radars
[J].DOI:10.1002/jgrf.v121.12 URL [本文引用: 2]
Greenland ice sheet surface melt amplified by snowline migration and bare ice exposure
[J].
DOI:10.1126/sciadv.aav3738
URL
[本文引用: 1]
Greenland’s snowline exhibits large fluctuations and is a primary amplifier of ice sheet surface melt and runoff.
An empirical algorithm to map perennial firn aquifers and ice slabs within the Greenland Ice Sheet using satellite L-band microwave radiometry
[J].
DOI:10.5194/tc-16-103-2022
URL
[本文引用: 1]
. Perennial firn aquifers are subsurface meltwater reservoirs\nconsisting of a meters-thick water-saturated firn layer that can form on\nspatial scales as large as tens of kilometers. They have been observed\nwithin the percolation facies of glaciated regions experiencing intense\nseasonal surface melting and high snow accumulation. Widespread perennial\nfirn aquifers have been identified within the Greenland Ice Sheet (GrIS) via\nfield expeditions, airborne ice-penetrating radar surveys, and satellite\nmicrowave sensors. In contrast, ice slabs are nearly continuous ice layers\nthat can also form on spatial scales as large as tens of kilometers as a\nresult of surface and subsurface water-saturated snow and firn layers\nsequentially refreezing following multiple melting seasons. They have been\nobserved within the percolation facies of glaciated regions experiencing\nintense seasonal surface melting but in areas where snow accumulation is at\nleast 25 % lower as compared to perennial firn aquifer areas. Widespread\nice slabs have recently been identified within the GrIS via field\nexpeditions and airborne ice-penetrating radar surveys, specifically in\nareas where perennial firn aquifers typically do not form.\nHowever, ice slabs have yet to be identified from space.\nTogether, these two ice sheet features\nrepresent distinct, but related, sub-facies within the broader percolation\nfacies of the GrIS that can be defined primarily by differences in snow\naccumulation, which influences the englacial hydrology and thermal\ncharacteristics of firn layers at depth. Here, for the first time, we use\nenhanced-resolution vertically polarized L-band brightness\ntemperature (TVB)\nimagery (2015–2019) generated using observations collected over the GrIS by\nNASA's Soil Moisture Active Passive (SMAP) satellite to map perennial firn\naquifer and ice slab areas together as a continuous englacial hydrological\nsystem. We use an empirical algorithm previously developed\nto map the extent of Greenland's perennial firn aquifers via fitting\nexponentially decreasing temporal L-band signatures to a set of sigmoidal\ncurves. This algorithm is recalibrated to also map the extent of ice slab\nareas using airborne ice-penetrating radar surveys collected by NASA's\nOperation IceBridge (OIB) campaigns (2010–2017). Our SMAP-derived maps show\nthat between 2015 and 2019, perennial firn aquifer areas extended over\n64 000 km2, and ice slab areas extended over\n76 000 km2. Combined together, these\nsub-facies are the equivalent of 24 % of the percolation facies of the\nGrIS. As Greenland's climate continues to warm, seasonal surface melting\nwill increase in extent, intensity, and duration. Quantifying the possible\nrapid expansion of these sub-facies using satellite L-band microwave\nradiometry has significant implications for understanding ice-sheet-wide\nvariability in englacial hydrology that may drive meltwater-induced\nhydrofracturing and accelerated ice flow as well as high-elevation meltwater\nrunoff that can impact the mass balance and stability of the GrIS.\n
