

0 引言
作为陆地生态系统的重要组成部分,森林在涵养水源、保持水土、固碳释氧等方面具有重要作用[1]。了解掌握现有森林植被类型及分布状况等对于科学保护森林资源[2]、监测生长/恢复动态[3]、生态效益估算[4]等具有重要意义。而在植被类型识别与信息提取方面,遥感技术已成为森林资源调查和监测的重要手段。目前,诸多类型的遥感数据已成功应用于植被识别领域,并且中低分辨率遥感数据和多光谱遥感数据应用更为普遍,但其大部分运用于森林类型识别而非树种级识别[5]。而高光谱遥感影像可准确从光谱中捕获物体间的细微差别[6],因而被应用到植被的精准分类与识别[7]。相关研究表明,高光谱遥感数据在森林资源监测和树种分类、识别鉴定等方面具有巨大的潜力[8-9]。
目前对高光谱遥感数据进行树种分类的常用分类算法有K最邻近(K-nearest neighbor,KNN)、决策树(decision trees,DT)、随机森林(random forest,RF)、最大似然法(maximum likelihood classifier,MLC)、支持向量机(support vector machines,SVM)、人工神经网络(artificial neural networks,ANN)等[10]。而森林类型分类受到诸多因素的制约,如树种混交程度、环境复杂程度等,并且所使用的不同分类算法在不同区域、不同情景的分类效果也不同[11]。如采用3种分类器(SVM,RF和MLC)对欧洲北部针叶林中树种精细分类的研究表明: SVM对欧洲北部树种的分类效果最佳,其Kappa系数大于0.8,且总体分类精度最高[12]; 同时部分研究发现SVM通常被认为是处理复杂分类问题(如树种分化)的最佳方法[13]。如在Hyperion和HyMap数据上使用SVM和RF对德国中部森林中的5种树种进行分类时,在只使用光谱信息的情况下,SVM的总体分类精度为71%[14]。而NN是一种常用的地表遥感工具,其精度通常与SVM相同。上述相关方法已成功应用于多光谱数据的森林生物物理参数估算[15]和土地覆盖分类等方面[16]。
随着深度学习的发展,近年来卷积神经网络(convolution neural network,CNN)在图像分类领域应用较为广泛。其使用多层神经网络结构自动获得更抽象、更深层的特征信息进行图像分类,则CNN的分类效果往往好于传统方法[17]。越来越多的研究侧重于测试CNN在森林树种精细识别的能力。如利用高光谱遥感数据对巴西南部亚热带森林的14个树种进行分类,将CNN与其他2种传统的机器学习方法(SVM与RF)进行对比。结果表明: CNN分类器优于传统的支持向量机和RF分类器,其总体精度为84.37%,Kappa系数为0.82[18]。在芬兰北部开展的基于机载高光谱图像与LiDAR数据的树种识别研究表明,3DCNN与其他参考算法相比在区分针叶树种方面更有效,同时该算法还具有较高的欧洲杨树(Populus tremula)分类精度[19]。目前,深度学习在树种自动分类中的应用尚处于研究初级阶段,在野外复杂环境下,怎样利用深度学习方法和高空间分辨率高光谱遥感数据实现树种自动分类有待进一步研究。
此外,不同空间分辨率影响树种精细分类精度。研究表明像素大小对树种分类精度影响很大[20]。尽管高空间分辨率提供详尽的地物细节特征,但是过高的空间分辨率也可能导致地物的光谱可分性降低[21]。可见探究不同空间分辨率对于森林优势树种识别的影响具有实践意义。为了探索不同分类算法、不同空间分辨率以及不同样本采集方式对高光谱遥感数据优势树种识别精度的影响,本文选取3种分类算法(神经网络(neural network,NN)、3DCNN和SVM),以内蒙古根河市自然森林保护区优势树种为对象,重点探讨: ①不同分类算法在优势树种分类中的精度; ②不同空间分辨率对分类精度的影响; ③不同样本采集方式(样本点(样地对应像元的光谱值)与样本面(样地对应3×3窗口像元光谱平均值))对优势树种识别精度的影响。通过上述研究,对比分析多种方案的识别效果,以期为提高优势树种精细识别提供技术支撑。
1 研究区概况与数据获取
1.1 研究区概况
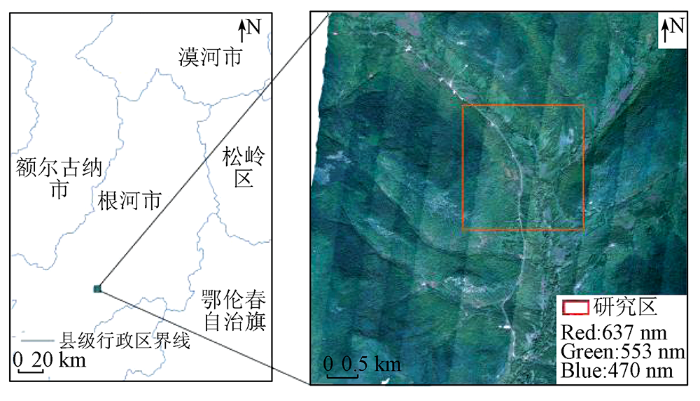
图1
1.2 数据获取与处理
1.2.1 机载高光谱数据
本研究使用的遥感数据由中国林业科学研究院资源信息研究所引进的机载遥感综合观测平台CAF-LiCHy获取,拍摄时间为2016年8月28日,总飞行覆盖面积约35.4 km2,搭载的高光谱成像仪为AISA Eagle II衍射光栅推扫式高光谱成像仪,共64个波段,其波长范围为400~1000 nm,光谱分辨率为3.3 nm,空间分辨率为1 m。本研究考虑了各条带镶嵌效果以及土地利用类型分布等因素,在飞行区域选取3个条带,在这3个条带拼接后截取了矩形区域(3.3 km×2.3 km)范围内的高光谱遥感数据开展研究。
1.2.2 样地调查数据
本研究于2021年9月进行野外调查,使用Lite RTK测地型全球导航卫星系统(global navigation satellite system,GNSS)接收机对不同地物类型进行实地观测,总共记录了274个样地信息。样地类型集中于植被类型,其主要包括白桦、针阔混交(兴安落叶松与白桦)、兴安落叶松、灌木和草地等类别,定位精度误差均控制在1 m以内。
1.2.3 数据预处理
图2
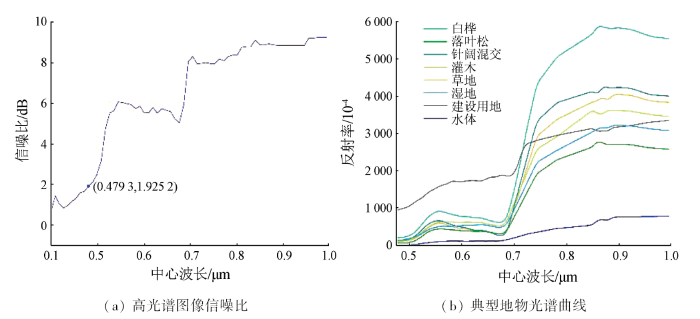
图2
高光谱图像信噪比与典型地物光谱曲线
Fig.2
Signal to noise ratio of hyperspectral image and spectral curve of typical ground features
2 研究方法
2.1 分类体系的建立
表1 研究区分类体系
Tab.1
| Ⅰ级类型 | Ⅱ级类型 | Ⅲ级类型 | Ⅳ级类型 | Ⅴ级类型 |
|---|---|---|---|---|
| 林地 | 有林地 | 乔木林 | 纯林 | 白桦林 |
| 落叶松林 | ||||
| 混交林 | 针阔混交林 | |||
| 灌木林地 | ||||
| 草地 | ||||
| 湿地 | ||||
| 非植被 | 建设用地 | |||
| 水体 | ||||
2.2 样本选择
由于野外调查的样地数据有限,难以识别优势树种,因此需根据地物空间分布特点、样地位置、高光谱数据的纹理与光谱特征对样本进行适量扩充。样本选择结果见表2。在接下来的分类中,随机选择每个类别50%的样本用来训练分类算法,其余50%的样本用来测试分类算法精度。
表2 各类别样本数量
Tab.2
| 地类编号 | 地物类型 | 样本数(像元)/个 |
|---|---|---|
| 1 | 白桦林 | 3 946 |
| 2 | 落叶松林 | 2 444 |
| 3 | 针阔混交林 | 2 292 |
| 4 | 灌木林地 | 3 721 |
| 5 | 草地 | 1 318 |
| 6 | 湿地 | 3 924 |
| 7 | 非植被 | 5 450 |
2.3 数据分析方法
2.3.1 NN算法
NN算法是将大量简单神经元相互连接而成的非线性复杂生物网络模型。它通过调节神经网络的参数(权值),依据待求解问题设计参数的网络结构,将目标函数作为网络结构的能量函数,经过神经网络演变得到稳定状态最小能量函数,基于能量函数确定问题的最优解[29]。
2.3.2 3DCNN算法
本文使用一种3DCNN架构,该架构使用真实的三维卷积同时处理空间和光谱特征。本文使用的网络结构包括2个三维卷积层(3Dconv)、2个一维卷积层(1Dconv)、2个池化层(ConvPool)和1个全连接层(FC)。并且全连接层是一个具有Softmax的FC层(图3)。
图3
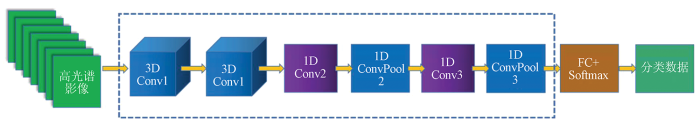
输出层使用的softmax函数可以从原始输出值中获得不同树种的概率值,定义为:
式中: xi为类i的原始预测值; n为类数; j为神经元的值。在训练时,每次读取样本数为8,学习率为0.001,迭代次数为120次。深度学习模型实验环境为: AMD Ryzen 75800H with Radeon Graphics处理器,16 G运行内存,主频为3.20 GHz。显卡为NVIDIA GeForce RTX 3060 Laptop GPU,CUDA 版本11.3,深度学习平台采用python3.9的Pytorch1.11.0框架。
2.3.3 SVM算法
3 结果与分析
3.1 分类结果分析
本研究将原始空间分辨率为1 m的高光谱图像重采样到空间分辨率为3 m的高光谱图像。使用2种样本采集方式: 样本点(样地对应像元的光谱值)与样本面(样地对应3×3窗口像元光谱平均值),再结合NN,3DCNN和SVM为3种分类算法对研究区优势树种进行识别。总计得到了12个分类结果图。其中,方案1为使用1 m空间分辨率影像并利用样本点采样进行分类; 方案2为使用1 m空间分辨率影像并利用样本面采样进行分类; 方案3为使用3 m空间分辨率影像并利用样本点采样进行分类; 方案4为使用3 m空间分辨率影像并利用样本面采样进行分类。
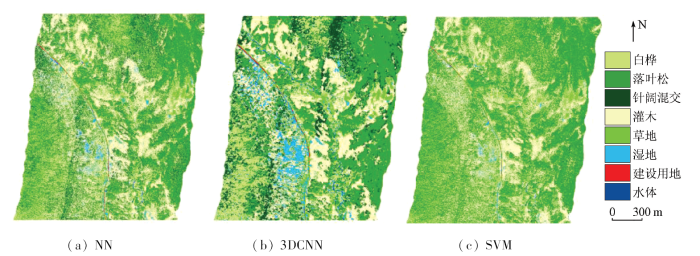
3.1.1 方案1的分类结果
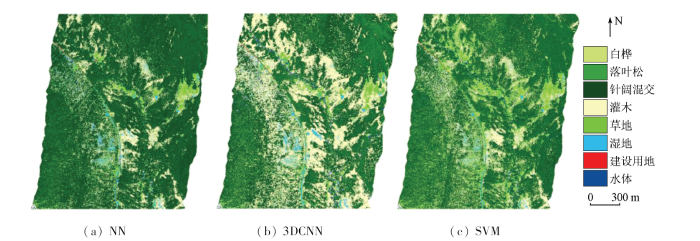
基于空间分辨率1 m且样本点采样的3个分类结果的地物分布大致相似(图4),可以看出针阔混交林广泛分布于研究范围内东北部与西南部。白桦主要分布于北部山坡与西南山坡上。并且伴随着山体高度的降低,落叶松与灌木广泛分布于陡坡与平原上。草地则集中分布于研究范围内的平原。道路以及水体形状清晰,分类效果较好。但在SVM分类结果中可以看到明显的条带拼接痕迹,这在其他2种分类结果中并不明显。
图4
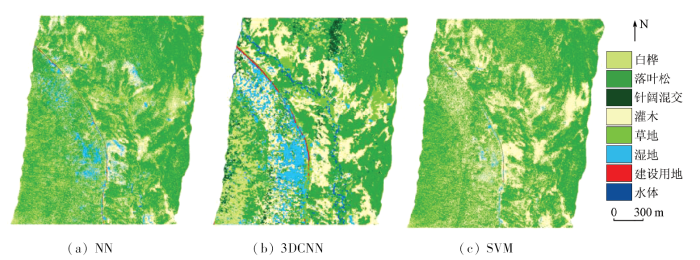
3.1.2 方案2的分类结果
基于空间分辨率1 m且样本面采样的分类结果表明: 与方案1的3个分类结果相比,针阔混交林面积显著减少,并且3个分类结果均能看出条带拼接痕迹(图5)。除针阔混交林外其他地物类型分布与方案1较为相似。而该方案针对针阔混交林的识别效果较差,NN与3DCNN的分类结果中还可以看到针阔混交林的分布,但在SVM分类结果中已经几乎无法识别出针阔混交林。
图5

3.1.3 方案3的分类结果
基于空间分辨率3 m且样本点采样的的分类结果表明: 除3DCNN分类结果中依然可以看出针阔混交林的分布以外,其他2种分类结果均几乎不见针阔混交林的分布(图6)。并且随着空间分辨率的降低,3种分类结果与方案1相比落叶松林、白桦林的面积大幅增加,而其他地物类型分布变化不大。
图6
3.1.4 方案4的分类结果
基于空间分辨率3 m且样本面采样的的分类结果表明: 只有3DCNN分类结果与前面几种方案较为相似(图7)。并且在NN与SVM分类结果中针阔混交林几乎无法识别出来。
图7
3.2 精度分析
本研究采用Kappa系数与总体精度作为筛选最佳的分类方案与分类器的评价方法(图8)。可见,在所有的分类情况中,3DCNN分类总体精度与Kappa系数均为最高,分别为95.42%和0.94。其中空间分辨率对于分类精度的影响十分明显,分别对比方案1与方案3,方案2与方案4可以看出空间分辨率对于分类精度的影响。其总体趋势均为随着空间分辨率的下降,总体精度与Kappa系数明显降低。总体而言,高空间分辨率更有利于优势树种识别,其比低空间分辨率(3 m)总体精度最多可提高30.97%,Kappa系数最多可提高54.24%。并且样本采集方式对于分类结果的精度影响也十分明显,分别对比方案1与方案2,方案3与方案4可以看出样本采集方式对于分类精度的影响。除在使用3DCNN的方案3与方案4的对比外,随着由样本点采样到样本面采样,总体精度与Kappa系数明显降低。总体而言,使用NN与SVM进行分类时,以样本点作为样本取值尺度进行树种识别的精度均高于样本面,其总体精度最多可以提高29.98%,Kappa系数最多可提高51.67%。
图8

图8
所有方案的总体精度与Kappa系数
Fig.8
Overall accuracy and Kappa coefficient of all schemes
所有优势树种的生产者与使用者精度如表3所示。不难看出,在空间分辨率为1 m且采样方式为样本点时,3DCNN的各优势树种分类精度最高,并且NN与SVM的各优势树种精度均高于0.85。然而当空间分辨率降低时,不论使用何种算法分类,每个优势树种的生产者精度和用户精度均大幅下降。尤其在3 m空间分辨率时使用样本面采样时,SVM与NN几乎无法识别针阔混交林。
表3 优势树种的生产者与使用者精度
Tab.3
| 分类模型 | 空间分 辨率/m | 采样方式 | 白桦林 | 落叶松林 | 针阔混交林 | 灌木林 | ||||
|---|---|---|---|---|---|---|---|---|---|---|
| 生产者 精度 | 使用者 精度 | 生产者 精度 | 使用者 精度 | 生产者 精度 | 使用者 精度 | 生产者 精度 | 使用者 精度 | |||
| NN | 1 | 样本点 | 0.98 | 1 | 0.96 | 0.99 | 0.98 | 0.91 | 0.95 | 0.93 |
| 样本面 | 0.69 | 0.58 | 0.81 | 0.91 | 0.64 | 0.37 | 0.74 | 0.91 | ||
| 3 | 样本点 | 0.64 | 0.70 | 0.81 | 0.93 | 0.58 | 0.23 | 0.82 | 0.81 | |
| 样本面 | 0.69 | 0.50 | 0.78 | 0.93 | 0.45 | 0.07 | 0.67 | 0.87 | ||
| 3D CNN | 1 | 样本点 | 0.98 | 0.99 | 0.96 | 0.91 | 0.95 | 0.95 | 0.97 | 0.87 |
| 样本面 | 0.94 | 0.86 | 0.97 | 0.91 | 0.62 | 0.95 | 0.91 | 0.94 | ||
| 3 | 样本点 | 0.91 | 0.82 | 0.93 | 0.96 | 0.65 | 0.71 | 0.86 | 0.95 | |
| 样本面 | 0.91 | 0.92 | 0.96 | 0.97 | 0.81 | 0.71 | 0.89 | 0.92 | ||
| SVM | 1 | 样本点 | 0.97 | 1 | 0.86 | 1 | 0.98 | 0.73 | 0.97 | 0.87 |
| 样本面 | 0.69 | 0.42 | 0.71 | 0.96 | 0 | 0 | 0.71 | 0.87 | ||
| 3 | 样本点 | 0.72 | 0.48 | 0.71 | 0.97 | 0 | 0 | 0.69 | 0.84 | |
| 样本面 | 0.64 | 0.33 | 0.70 | 0.95 | 0 | 0 | 0.59 | 0.85 | ||
然而对于NN和SVM分类算法来说,不论使用何种空间分辨率,样本面采样的各优势树种精度均低于样本点采样。但值得注意的是,3 m空间分辨率时3DCNN使用样本面采样比使用样本点采样的平均精度更高,除了针阔混交林与灌木林的使用者精度以外,其他优势树种的样本面精度均高于样本点精度。
4 讨论
深度学习在优势树种精细识别方面具有较强的应用能力。本研究表明: 3DCNN对优势树种识别的总体精度与Kappa系数均远高于其他分类器,这与中国长白山针阔混交林优势树种分类,欧洲挪威森林的树种分类研究结果相符[32⇓-34]。3DCNN除在光谱特征提取方面具有明显优势外,还充分利用空间邻域信息与空间纹理信息[27],而空谱信息的结合可显著提高分类精度[28,35]。本研究中的NN与SVM方法都只利用了高光谱图像的光谱特征,而研究区域有大量树木投射在地面的阴影,这可能是影响SVM和NN分类精度的原因之一[36-37]。此外虽然本研究使用的高光谱图像与野外实测数据时间相隔5 a,但由于该区域为自然保护区,无人为干扰,总体森林物种组成变化非常缓慢,所以5 a的差异并不影响采集数据的质量。
空间分辨率显著影响分类结果。不论是何种分类器,采取何种采样方法,本研究中3 m空间分辨率相较1 m空间分辨率的总体精度与Kappa系数均有不同程度的降低。表明高空间分辨率对于优势树种识别的重要性。这与欧洲北部树种分类的研究结果相符[12]。另外,当空间分辨率为3 m并且采样方式为样本面时,3DCNN的优势树种分类精度均高于0.8,只有针阔混交林的识别精度有所下降,表明3DCNN在3 m空间分辨率数据上的树种识别能力也相当可观,在对比多种分类器进行树种分类的研究中也发现了CNN的分类稳定性[38]。同时在3 m空间分辨率情况下,针阔混交林难以被区分出来,这可能是由于针阔混交林的混交程度不同,在光谱特征上存在同物异谱的情况,加之研究区域地形不平坦,使得在SVM和NN的分类效果较差。
不同样本采集方式对优势树种的识别精度也有较大影响。对于NN和SVM分类算法来说,不论使用何种空间分辨率,样本面采样的各优势树种精度均低于样本点。这可能是由于本研究区域的地物分布离散,除了湿地与水体类型外很少有大面积聚集的地物类型。在这种情况下使用样本面作为样本采集方式则会使采集的样本不够纯净,导致地物类型混分、错分的情况。但3 m空间分辨率时3DCNN使用样本面采样比使用样本点采样的平均精度更高,除了针阔混交林与灌木林的使用者精度以外,其他优势树种的样本面精度均高于样本点精度。表明在中空间分辨率(3 m)条件下,采用大尺寸样本进行训练有利于提高精度。这与大尺寸样本会提高全卷积神经网络的遥感影像分类精度的结果相似[39]。
5 结论
本研究基于4种分类方案探究空间分辨率、分类器的选择与样本采集方式对优势树种识别精度的影响。主要结论如下:
1)3DCNN在根河地区优势树种识别精度最高。无论使用何种分类算法、采样方式与空间分辨率,3DCNN所得到的总体精度与Kappa系数均最高。
2)空间分辨率对优势树种识别的影响较大,降低空间分辨率也会降低总体精度与Kappa系数。
3)使用NN和SVM分类时,以样本面采样进行优势树种识别的精度低于样本点采样方式。而3DCNN在3 m空间分辨率条件下样本面采样比使用样本点采样的优势树种平均精度更高。这表明在高空间分辨率高光谱数据情况下,使用样本面作为样本采集方式在传统算法中并没有提高优势树种识别精度; 而在深度学习算法中相较于1 m空间分辨率来说,在3 m空间分辨率数据中进行优势树种分类可能会有更好的识别效果。
参考文献
Remote sensing for conservation monitoring:Assessing protected areas,habitat extent,habitat condition,species diversity,and threats
[J].DOI:10.1016/j.ecolind.2012.09.014 URL [本文引用: 1]
Wood carbon content of tree species in Eastern China:Interspecific variability and the importance of the volatile fraction
[J].Data on the mass density and carbon content of tree organs, and in particular stem wood, are essential for accurate assessments of forest carbon sequestration. However most available data, including that for East Asia, has neglected the volatile C fraction. Wood samples were collected and assayed for C content from 14 native tree species in Jilin Province, NE China. C content showed statistically significant variation among species, ranging from 48.4% to 51.0%. The volatile C fraction was non-negligible, averaging 2.2%, and showed high variation among species. As found in prior studies, wood C content was appreciably higher in conifer than hardwood (angiosperm) species (50.8+/-0.1% vs. 49.5+/-0.2%, respectively). Wood carbon density (gC/cm(3)) showed very high inter-specific variation, due mainly to differences in wood specific gravity. Our analyses, in conjunction with recently published data from North America, indicate a global mean value of 47.5+/-0.5% wood C content exclusive of volatile C; the widely used 50% figure corresponds more closely to total wood C inclusive of the volatile fraction. Failure to include volatile C or to use species- or higher-taxon-specific C content values in forest C assessments is likely to introduce biases on the order approximately 4-6%. In addition, the stocks and flows of the volatile C fraction in wood are in themselves an important and sorely neglected aspect of forest C processes likely to be strongly impacted by harvests and other management practices.
Monitoring forests:A new paradigm of remote sensing & GIS based change detection
[J].DOI:10.4236/jgis.2012.45051 URL [本文引用: 1]
Mapping distinct forest types improves overall forest identification based on multi-spectral Landsat imagery for Myanmar’s Tanintharyi Region
[J].DOI:10.3390/rs8110882 URL [本文引用: 1]
融合植被指数的3D-2D-CNN高光谱图像植被分类方法
[J].
A hyperspectral image vegetation classification method using 2D-3D CNNs and vegetation index
[J].
Small sample classification of hyperspectral remote sensing images based on sequential joint deeping learning model
[J].DOI:10.1109/Access.6287639 URL [本文引用: 1]
高光谱遥感森林信息提取研究进展
[J].
Research advance in forest information extraction from hyoerspectral remote sensing data
[J].
C5.0决策树Hyperion影像森林类型精细分类方法
[J].
Precise classification of forest types use Hyperion image based on the C5.0 decision tree algorithm
[J].
A novel deep learning method to identify single tree species in UAV-based hyperspectral images
[J].
DOI:10.3390/rs12081294
URL
[本文引用: 1]

Deep neural networks are currently the focus of many remote sensing approaches related to forest management. Although they return satisfactory results in most tasks, some challenges related to hyperspectral data remain, like the curse of data dimensionality. In forested areas, another common problem is the highly-dense distribution of trees. In this paper, we propose a novel deep learning approach for hyperspectral imagery to identify single-tree species in highly-dense areas. We evaluated images with 25 spectral bands ranging from 506 to 820 nm taken over a semideciduous forest of the Brazilian Atlantic biome. We included in our network’s architecture a band combination selection phase. This phase learns from multiple combinations between bands which contributed the most for the tree identification task. This is followed by a feature map extraction and a multi-stage model refinement of the confidence map to produce accurate results of a highly-dense target. Our method returned an f-measure, precision and recall values of 0.959, 0.973, and 0.945, respectively. The results were superior when compared with a principal component analysis (PCA) approach. Compared to other learning methods, ours estimate a combination of hyperspectral bands that most contribute to the mentioned task within the network’s architecture. With this, the proposed method achieved state-of-the-art performance for detecting and geolocating individual tree-species in UAV-based hyperspectral images in a complex forest.
森林生态系统遥感监测技术研究进展
[J]
DOI:10.13249/j.cnki.sgs.2018.07.001
[本文引用: 1]
森林是陆地生态系统的主体,森林生态系统监测技术是实现森林可持续利用与全球变化研究的重要支撑与信息保障。从4个方面概述了遥感技术在森林生态系统监测中的应用研究进展:森林遥感分类及变化监测、森林植被参数遥感反演、森林蓄积量与生物量遥感估算、森林干扰遥感监测等。结合遥感技术的发展,总结了森林生态系统监测中使用的多源遥感数据和各类模型,提出集成地面调查数据、高分地-空雷达扫描监测技术,以及多源光学遥感建模技术和生态系统过程模型,构建多维度、多尺度、高时间密度的森林生态系统监测平台的研究展望。
The progress of forest ecosystems monitoring with remote sensing techniques
[J].
DOI:10.13249/j.cnki.sgs.2018.07.001
[本文引用: 1]
Forest is a main component of the terrestrial ecosystem, and its monitoring is the vital support for sustainable utilization of forest and global change researches. The home and aboard progress of remote sensing techniques application on monitoring forest ecosystems was concluded in this paper from four respects: classification and changes detection, the retrieval of vital ecological parameters of forest ecosystems including tree height, leaf area index, canopy density, etc., the estimation of stand volume and biomass, and disturbance monitoring. After summarized remote sensing data and models used in forest ecosystems monitoring, research prospect of establishment of integrated forest ecosystems monitoring platform with multi-dimension, multi-scale and high time density were put forward, which synthesized filed data, land-to-air high-resolution radar scanning techniques, multi-source optical remote sensing modeling and process models.
Tree species classification in boreal forests with hyperspectral data
[J].DOI:10.1109/TGRS.2012.2216272 URL [本文引用: 2]
Using class probabilities to map gradual transitions in shrub vegetation from simulated EnMAP data
[J].DOI:10.3390/rs70810668 URL [本文引用: 1]
A framework for mapping tree species combining hyperspectral and LiDAR data:Role of selected classifiers and sensor across three spatial scales
[J].DOI:10.1016/j.jag.2013.05.017 URL [本文引用: 1]
Review of machine learning approaches for biomass and soil moisture retrievals from remote sensing data
[J].DOI:10.3390/rs71215841 URL [本文引用: 1]
Land cover mapping with emphasis to burnt area delineation using co-orbital ALI and Landsat TM imagery
[J].DOI:10.1016/j.jag.2012.02.004 URL [本文引用: 1]
基于集成卷积神经网络的遥感影像场景分类
[J].
Scene classification of remote sensing images based onintegrated convolutional neural networks
[J].
Evaluating a convolutional neural network for feature extraction and tree species classification using uav-hyperspectral images
[J].
Tree species classification from airborne hyperspectral and LiDAR data using 3D convolutional neural networks
[J].DOI:10.1016/j.rse.2021.112322 URL [本文引用: 1]
A classification-based assessment of the optimal spectral and spatial resolutions for Great Lakes coastal wetland imagery
[J].DOI:10.1016/j.rse.2006.11.005 URL [本文引用: 1]
大兴安岭森林草原过渡带白桦及主要草本植物生态位关系的研究
[J].以白桦、日阴菅及其它主要草本植物的个体数量为指标,分析了各植物种群在土壤有机质、速效P和pH值3个资源维上的生态位宽度和生态位重叠及其在不同海拔条件下的变化规律.日阴菅生态位宽度随海拔升高而增大,其余植物种类在有机质资源维上的生态位宽度,大都是以中等海拔(800m)的样带最宽,而在速效P资源维上,又以中等海拔的样带为最窄.由于高海拔及相应低气温在某种程度上限制了植物种群对土壤有机质和速效P的利用,主要植物种对之间在这两个资源维上的生态位重叠以高海拔(950m)样带为最小.在土壤pH值资源维上,溪荪与其它主要植物种间的生态位重叠皆以低海拔(650m)样带为最小,可能是其特殊的环境组合迫使溪荪发生了生态位移动.大多数种对在土壤有机质、速效P和pH值3个资源维上都以海拔800m的样带生态位重叠最大.
Niche relationships between Betula platyphylla and main understory herbages in forest-steppe ecotone of Daxinganling Mountains
[J].
大兴安岭林区落叶松林地不同发育阶段土壤肥力演变与评价
[J].
Evolution and evaluation of soil fertility in forest land in Larix gmelinii plantations at different development stages in Daxinganling forest region
[J].
光学遥感图像信噪比评估方法研究进展
[J].
Review on methods for SNR Estimation of optical remote sensing imagery
[J].
Deep learning for classification of hyperspectral data:A comparative review
[J].DOI:10.1109/MGRS.2019.2912563 [本文引用: 2]
Deep learning classifiers for hyperspectral imaging:A review
[J].
DOI:10.1016/j.isprsjprs.2019.09.006
[本文引用: 2]
Advances in computing technology have fostered the development of new and powerful deep learning (DL) techniques, which have demonstrated promising results in a wide range of applications. Particularly, DL methods have been successfully used to classify remotely sensed data collected by Earth Observation (EO) instruments. Hyperspectral imaging (HSI) is a hot topic in remote sensing data analysis due to the vast amount of information comprised by this kind of images, which allows for a better characterization and exploitation of the Earth surface by combining rich spectral and spatial information. However, HSI poses major challenges for supervised classification methods due to the high dimensionality of the data and the limited availability of training samples. These issues, together with the high intraclass variability (and interclass similarity) often present in HSI data-may hamper the effectiveness of classifiers. In order to solve these limitations, several DL-based architectures have been recently developed, exhibiting great potential in HSI data interpretation. This paper provides a comprehensive review of the current-state-of-the-art in DL for HSI classification, analyzing the strengths and weaknesses of the most widely used classifiers in the literature. For each discussed method, we provide quantitative results using several well-known and widely used HSI scenes, thus providing an exhaustive comparison of the discussed techniques. The paper concludes with some remarks and hints about future challenges in the application of DL techniques to HSI classification. The source codes of the methods discussed in this paper are available from: https://github.com/mhaut/hyperspectral_deeplearning_review.
Comparative analysis of SVM,ANN and CNN for classifying vegetation species using hyperspectral thermal infrared data
[J].
关于统计学习理论与支持向量机
[J].
Introduction to statistical learning theory and support vector machines
[J].
A weighted SVM-based approach to tree species classification at individual tree crown level using LiDAR data
[J].
DOI:10.3390/rs11242948
URL
[本文引用: 1]
Tree species classification at individual tree crowns (ITCs) level, using remote-sensing data, requires the availability of a sufficient number of reliable reference samples (i.e., training samples) to be used in the learning phase of the classifier. The classification performance of the tree species is mainly affected by two main issues: (i) an imbalanced distribution of the tree species classes, and (ii) the presence of unreliable samples due to field collection errors, coordinate misalignments, and ITCs delineation errors. To address these problems, in this paper, we present a weighted Support Vector Machine (wSVM)-based approach for the detection of tree species at ITC level. The proposed approach initially extracts (i) different weights associated to different classes of tree species, to mitigate the effect of the imbalanced distribution of the classes; and (ii) different weights associated to different training samples according to their importance for the classification problem, to reduce the effect of unreliable samples. Then, in order to exploit different weights in the learning phase of the classifier a wSVM algorithm is used. The features to characterize the tree species at ITC level are extracted from both the elevation and intensity of airborne light detection and ranging (LiDAR) data. Experimental results obtained on two study areas located in the Italian Alps show the effectiveness of the proposed approach.
基于无人机高光谱影像和深度学习算法的长白山针阔混交林优势树种分类
[J].
Classification of dominant species in coniferous and broad-leaved mixed forest on Changbai Mountain based on UAV-based hyperspectral image and deep learning algorithm
[J].
DOI:DOI: 10.13292/j.1000-4890.202203.004
[本文引用: 1]
Rapid and accurate identification of tree species and their distribution patterns is the basis and premise for forest resource management and biodiversity conservation. Compared with the traditional field investigation methods, the rapid development of the surface of remote sensing technology in recent years can obtain high resolution hyperspectral remote sensing images flexibly, efficiently, and conveniently. However, how to select features with large amount of information and low redundancy from many features containing rich information for automatic tree species identification is an urgent problem. We used spectral sensors carried by unmanned aerial vehicles to take hyperspectral images, which covered an area of 6 hm<sup>2</sup> of the 25 hm<sup>2</sup> temperate mixed conifer-broadleaf plot in Changbai Mountain. Six canopy tree species, including <em>Pinus koraiensis</em>, <em>Ulmus davidiana</em>, <em>Quercus mongolica</em>, <em>Fraxinus mandshurica</em>,<em>Populus ussuriensis</em>, and <em>Tilia amurensis</em>, were selected as the field labeled tree species. Realtime Kinematic Phase Difference (RTK) technology was used to accurately capture the position of those target tree species. In addition, visual interpretation of the image of the study area was performed using ArcGIS based on the forest re-inventory results in 2019. Three classification methods, including convolutional neural network, maximum likelihood and Mahalanobis distance, were used to analyze the automatic classification of canopy tree species. Our results showed that: (1) The overall accuracy and Kappa coefficient of tree species classification of convolutional neural network (99.85%, 0.998) were better than maximum likelihood (89.11%, 0.86) and Maharanobis distance method (79.65%, 0.75); (2) Among the three classification methods, the classification accuracy of single dominant tree species was the highest when using the convolve neural network, and the highest classification accuracy of <em>P. koraiensis</em>, <em>U. davidiana</em>, <em>Q. mongolica</em>, <em>F. mandshurica</em>, <em>P. ussuriensis</em> and <em>T. amurensis</em> were 100%, 99.9%, 99.9%, 99.8%, 99.8% and 99.5%, respectively. (3) Overall, convolutional neural network had the lowest degree of mixing, while Mahalanobis distance method had the most serious degree of mixing problem. This study indicated that the convolutional neural network model based on deep learning approach can obtain the accurate and efficient classification of canopy species in natural temperate forests, which could provide a great step forward into the species diversity monitoring and forestry resource survey.
Tree species classification in Norway from airborne hyperspectral and airborne laser scanning data
[J].DOI:10.1080/22797254.2018.1434424 URL [本文引用: 1]
Individual tree detection and classification with UAV-based photogrammetric point clouds and hyperspectral imaging
[J].DOI:10.3390/rs9030185 URL [本文引用: 1]
面向高光谱遥感图像分类的连续空间依赖增强型空—谱卷积神经网络
[J].
Improved spectral-spatial convolutional network using continuously spatial dependency enhancement for hyperspectral image classification
[J].
高分辨率遥感影像阴影检测与补偿方法优化
[J].
Optimization of shadow detection and compensation method for high-resolution remote sensing images
[J].
基于Sentinel-2数据的天山山地针叶林识别方法研究
[J].
An identification method for mountains coniferous in Tianshan with Sentinel-2 data
[J].
Comparative performance of convolutional neural network,weighted and conventional support vector machine and random forest for classifying tree species using hyperspectral and photogrammetric data
[J].
样本尺寸对遥感影像FCN训练模型的影响分析
[J].
Analysis of sample size influence on FCN training model in remote sensing image
[J].
A convolutional neural network classifier identifies tree species in mixed-conifer forest from hyperspectral imagery
[J].
DOI:10.3390/rs11192326
URL
[本文引用: 1]
In this study, we automate tree species classification and mapping using field-based training data, high spatial resolution airborne hyperspectral imagery, and a convolutional neural network classifier (CNN). We tested our methods by identifying seven dominant trees species as well as dead standing trees in a mixed-conifer forest in the Southern Sierra Nevada Mountains, CA (USA) using training, validation, and testing datasets composed of spatially-explicit transects and plots sampled across a single strip of imaging spectroscopy. We also used a three-band ‘Red-Green-Blue’ pseudo true-color subset of the hyperspectral imagery strip to test the classification accuracy of a CNN model without the additional non-visible spectral data provided in the hyperspectral imagery. Our classifier is pixel-based rather than object based, although we use three-dimensional structural information from airborne Light Detection and Ranging (LiDAR) to identify trees (points > 5 m above the ground) and the classifier was applied to image pixels that were thus identified as tree crowns. By training a CNN classifier using field data and hyperspectral imagery, we were able to accurately identify tree species and predict their distribution, as well as the distribution of tree mortality, across the landscape. Using a window size of 15 pixels and eight hidden convolutional layers, a CNN model classified the correct species of 713 individual trees from hyperspectral imagery with an average F-score of 0.87 and F-scores ranging from 0.67–0.95 depending on species. The CNN classification model performance increased from a combined F-score of 0.64 for the Red-Green-Blue model to a combined F-score of 0.87 for the hyperspectral model. The hyperspectral CNN model captures the species composition changes across ~700 meters (1935 to 2630 m) of elevation from a lower-elevation mixed oak conifer forest to a higher-elevation fir-dominated coniferous forest. High resolution tree species maps can support forest ecosystem monitoring and management, and identifying dead trees aids landscape assessment of forest mortality resulting from drought, insects and pathogens. We publicly provide our code to apply deep learning classifiers to tree species identification from geospatial imagery and field training data.
Urban tree species classification using a WorldView-2/3 and LiDAR data fusion approach and deep learning
[J].
DOI:10.3390/s19061284
URL
[本文引用: 1]
Urban areas feature complex and heterogeneous land covers which create challenging issues for tree species classification. The increased availability of high spatial resolution multispectral satellite imagery and LiDAR datasets combined with the recent evolution of deep learning within remote sensing for object detection and scene classification, provide promising opportunities to map individual tree species with greater accuracy and resolution. However, there are knowledge gaps that are related to the contribution of Worldview-3 SWIR bands, very high resolution PAN band and LiDAR data in detailed tree species mapping. Additionally, contemporary deep learning methods are hampered by lack of training samples and difficulties of preparing training data. The objective of this study was to examine the potential of a novel deep learning method, Dense Convolutional Network (DenseNet), to identify dominant individual tree species in a complex urban environment within a fused image of WorldView-2 VNIR, Worldview-3 SWIR and LiDAR datasets. DenseNet results were compared against two popular machine classifiers in remote sensing image analysis, Random Forest (RF) and Support Vector Machine (SVM). Our results demonstrated that: (1) utilizing a data fusion approach beginning with VNIR and adding SWIR, LiDAR, and panchromatic (PAN) bands increased the overall accuracy of the DenseNet classifier from 75.9% to 76.8%, 81.1% and 82.6%, respectively. (2) DenseNet significantly outperformed RF and SVM for the classification of eight dominant tree species with an overall accuracy of 82.6%, compared to 51.8% and 52% for SVM and RF classifiers, respectively. (3) DenseNet maintained superior performance over RF and SVM classifiers under restricted training sample quantities which is a major limiting factor for deep learning techniques. Overall, the study reveals that DenseNet is more effective for urban tree species classification as it outperforms the popular RF and SVM techniques when working with highly complex image scenes regardless of training sample size.
