

0 引言
过去数十年内,众多学者经过调查研究,已经生产出各种中等空间分辨率的陆表蒸散产品,例如中等分辨率成像光谱仪(MODIS)产品(MOD16)[10-11]或EUMETSAT陆地表面分析卫星应用设施(LSA-SAF)产品(LSA-SAF MSG)[13]。但在以往的研究中,多名学者通过验证表明这2个产品在fluxnet通量站点方面存在许多不确定因素[14-15]。另外,其他产品,如欧洲中期天气预报中心(ECMWF)ERA-40再分析产品,虽然具有高时间分辨率,但是空间分辨率却十分粗糙[16]。因此研究学者将地面数据或者气象数据(再分析等材料)与遥感数据共同结合进而对陆表潜热通量进行估算[17⇓⇓⇓⇓-22],生产出了如OAFLUX海气通量产品、GSSTF3海气界面潜热通量产品、全球陆表高分辨率蒸散产品(high resolution global lAnd surface evapotranspiration product,Hi-GLASS ET)等一系列产品[23]。
Hi-GLASS ET产品相对于其他产品融合了多种算法,有更高的时空分辨率和较低的不确定性,能够提供可靠的蒸散空间分布。因此,开展Hi-GLASS ET产品的验证研究,证明产品的精度和有效性,对研究辐射能量的分配机制机理、实现中长期气候预报与评估以及探索全球能量循环、区域水循环和水资源管理等工作具有重要的现实意义,但自从2017年,Yao等[23]生产出Hi-GLASS ET产品以来,目前还没有针对此产品的精度评价,因此用户在使用Hi-GLASS ET产品时缺少参考依据。
本文选取Ameriflux观测网络中18个数据质量较高的站点的陆表实测潜热通量数据,与Hi-GLASS陆表潜热通量产品估算值对比,计算观测值与估算值之间的均方根误差(RMSE)、偏差(Bias)、决定系数(R2)、克林-古普塔效率(Kling-Gupta efficiency,KGE),对2013—2014年间的Hi-GLASS潜热通量产品进行精度评价研究,验证产品在美国地区的精度差异,从而为用户更好地使用该产品提供参考。
1 研究区与数据源
本文研究区为美国地区,位于E70°~130°,N25°~49°之间。利用该区域部分站点的地表潜热通量数据对Hi-GLASS ET产品进行精度评价。本研究主要使用2部分数据,一部分是Hi-GLASS潜热通量产品,即经过融合算法计算得到的陆表潜热通量的估算值,另一部分是美国区域的通量观测站点实际观测值。
1.1 Hi-GLASS潜热通量产品
Hi-GLASS ET的算法使用泰勒能力权重值的方法融合了基于遥感的彭曼-蒙特斯算法(remote sensing-based Penman-Monteith,RS-PM)、SW(shuttleworth-wallace)算法、Priestly-Taylor喷射推进实验室算法(Priestly-Taylor jet propulsion laboratory,PT-JPL)、改进的基于卫星的Priestly-Taylor算法(modified satellite-based Priestly-Taylor,MS-PT)和简单混合算法(simple hybrid,SIM)5种传统的具有明确物理机制的地表蒸散算法,综合得到高空间分辨率的全球Landsat陆表蒸散产品。相较于5种传统的地表蒸散算法生产的蒸散产品,Hi-GLASS ET在拥有高空间分辨率的同时,也降低了蒸散产品的不确定性,产品性能也得到了提升[23]。
图1

Hi-GLASS ET的输出产品数据类型均为8位的无符号整型,空间分辨率为30 m,时间分辨率为15 d。在确定通量站点之后,整理出所选的18个站点的经纬度并进行转化,确定通量站点所在行列号后,联系数据管理人员,获取Hi-GLASS数据并进行后续处理。
1.2 Ameriflux通量站点数据
陆表潜热通量的实际站点观测数据由Ameriflux网络提供,Ameriflux是全球通量观测网站中的一个,用于实际观测美洲地区的生态系统CO2、水和能量通量等数据,地表覆盖类型包括苔原、草原、稀树草原、作物以及针叶林、落叶林和热带森林等。该网站总共包含572个通量站点,分布于整个美国地区,并且包含16种地表覆盖类型,保证观测数据更加客观、全面。AmeriFlux目前是美国能源部生物与环境研究办公室在气候和生态研究领域最知名和最受推崇的品牌之一,许多学者利用Ameriflux通量站点数据开展研究。2019年,Zhou等[24]利用Ameriflux站点评估中等分辨率影像光谱辐射计Albedo产品(Mcd43)的空间代表性; 2020年,Zhang等[25]利用此网站的通量站点数据对Sentinel-3A OLCI土地产品成本进行总体初级生产力估算; 这也反映出Ameriflux网站的通量站点数据具有较高的可靠性。
根据研究需要及数据质量检查,最终筛选出18个站点,涵盖了6种植被覆盖类型,分别是农田(croplands,CRO)、常绿针叶林(evergreen needleleaf forests,ENF)、落叶阔叶林(deciduous broadleaf forests,DBF)、木本草原(woody savannas,WSA)、草原(grassland,GRA)、开阔的树丛(open shrublands,OSH)。通量站点的观测数据主要包含湍流热通量、潜热通量、生态系统净交换、下行短波辐射和昼夜温差等多个参量数据,具有不同的时间分辨率,使得数据使用更加多样化。本研究主要验证Hi-GLASS陆表潜热通量产品的精度,因此只选取站点中潜热通量数据作为研究对象。
根据最终选取的18个站点的坐标,确定站点在美国地区的空间分布,站点分布情况如表1所示。本研究所选取的站点分布情况较为均匀,因此本研究的数据不具备特殊性,研究结果也更加客观。
表1 通量站点空间分布信息
Tab.1
| 站点名称 | 纬度/(°) | 经度/(°) | 植被覆盖类型 |
|---|---|---|---|
| US-CRT | 41.628 5 | -83.347 1 | CRO |
| US-Tw2 | 38.096 9 | -121.636 5 | CRO |
| US-Tw3 | 38.115 2 | -121.646 9 | CRO |
| US-Twt | 38.108 7 | -121.6531 | CRO |
| US-GLE | 41.366 5 | -106.239 9 | ENF |
| US-Me2 | 44.452 6 | -121.558 9 | ENF |
| US-NR1 | 40.032 9 | -105.546 4 | ENF |
| US-Prr | 65.123 7 | -147.487 6 | ENF |
| US-MMS | 39.323 2 | -86.413 1 | DBF |
| US-WCr | 45.805 9 | -90.079 9 | DBF |
| US-Oho | 41.554 5 | -83.843 8 | DBF |
| US-SRG | 31.789 4 | -110.827 7 | GRA |
| US-Var | 38.413 3 | -120.950 8 | GRA |
| US-Wkg | 31.736 5 | -109.941 9 | GRA |
| US-SRC | 31.908 3 | -110.839 5 | OSH |
| US-Whs | 31.743 8 | -110.052 2 | OSH |
| US-SRM | 31.821 4 | -110.866 1 | WSA |
| US-Ton | 38.430 9 | -120.966 0 | WSA |
2 验证方法
为了更加全面、准确地评价Hi-GLASS陆表潜热通量产品的精度及可靠性,本研究总共选取了4个评价指标,分别为RMSE,Bias,KGE和R2。
其中,RMSE在本文中表示Hi-GLASS估算值与实际蒸散观测值偏差的平方和观测次数n比值的平方根,用来反映数据的离散程度,RMSE越小说明Hi-GLASS陆表潜热通量产品越准确。计算公式为:
式中: i=1,2,3,…,n; n为样本的数量; Oi为地表蒸散实际观测值; Pi为Hi-GLASS算法计算得到的估算值。
Bias一般情况下用来表示实际观测值与估算值之间的平均差异,其值越接近0,表示观测值与估算值的差异程度越小,其表达式为:
KGE由Gupta等[26]提出,能够更好地反映相关性、偏差和多样性测量三者之间的相对重要性,用来评价模型的准确程度,KGE的数值范围为(-¥,1),KGE越接近1,说明模型准确度越高,KGE的计算方法为:
式中: cov为协方差; σ为标准差; μ为算术平均值。
R2在本研究中用来表示Hi-GLASS算法的拟合程度,R2的取值范围为[0,1],值越接近于1,说明产品精度越高,R2的表达式为:
式中:
分别计算各个站点的4个评价指标,根据结果对产品的拟合程度以及精度进行综合评价。
3 结果与讨论
3.1 Hi-GLASS陆表潜热通量产品站点验证
为了验证Hi-GLASS陆表潜热通量产品精度,将其与通量站点实际观测值进行相关分析,各站点的估算值与观测值的关系如图2所示。除US-CRT(CRO),US-Twt(CRO),US-NR1(ENF)和US-Oho(DBF)站点外,其余站点的RMSE均小于50 W/m2,且大部分站点的RMSE在10~30 W/m2之间。由R2定义可知,R2越接近1说明拟合程度越高,除US-Tw2(CRO),US-GLE(ENF),US-NR1(ENF),US-SRC(OSH)和US-Whs(OSH)站点外,其余观测站点的相关系数平方均超过0.5,R2最高的站点US-Twt(CRO)可达到0.85。Bias越接近0,说明Hi-GLASS估算值和地面观测值之间的偏离程度越小,18个站点中,除少数站点Bias绝对值大于40 W/m2,大部分站点Bias的绝对值小于15 W/m2。KGE值反映模型的准确性,其值越接近1,说明模型越准确,大部分站点KGE值大于0.35,其中US-WCr(DBF)站点KGE值高达0.80。排除站点观测时天气和云层等观测因素以及数据处理过程中的累积误差,可以认为Hi-GLASS陆表潜热通量产品精度较高。由于单个站点的数据量单薄,本研究结合18个通量站点的所有数据,对研究数据整体进行精度分析。
图2

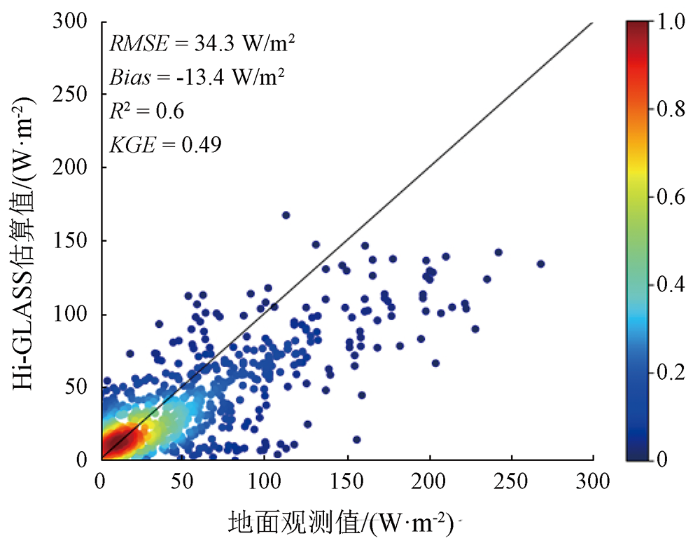
总体数据的精度如图3所示,较单个站点效果更明显,18个站点的总体RMSE为34.3 W/m2,Bias为-13.4 W/m2,R2为0.6,KGE为0.49。从整体的RMSE与Bias来看可以认定Hi-GLASS估算值与站点实际地面观测值的离散程度较小,通过R2与KGE这2个评价指标可以看出,Hi-GLASS陆表潜热通量产品具有较高的精度。
图3
为了多方面、多角度评价Hi-GLASS陆表潜热通量产品的质量,本研究在18个通量站点中,根据6种地表覆盖类型,整理出6个具有代表性的站点在2014年间完整的年度数据进行估算值与观测值的对比分析。 由图4对比发现,虽然Hi-GLASS估算值与地表观测值无法做到完全吻合,但是数据在完整的四季变化中具有大体一致的变化趋势,并且部分站点在个别月份的数据接近一致,由此可以认为,Hi-GLASS产品的精度较高。
图4
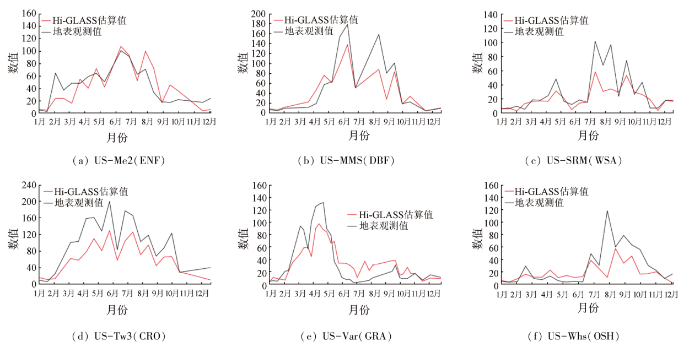
图4
2014年Hi-GLASS陆表潜热通量产品对比
Fig.4
Comparison of Hi-GLASS land surface latent heat flux products in 2014
3.2 地表蒸散空间制图
选取2014年美国地区的Hi-GLASS潜热通量产品进行空间制图与分析,并按照季节进行展示。从图5中可以看出,美国西部地区的潜热通量整体较低,大致在0~50 W/m2范围内,在东南部地区的潜热通量整体较高,均大于50 W/m2,这种情况是由美国东西部地区的地表覆盖类型存在差异引起的,西部大多为高大的山地和高原,而东部则是低缓的高地和平原等,因此东西两部的潜热通量存在较大的区别。除此之外,潜热通量分布的季节性也很明显,在春季和夏季地表潜热通量普遍高于秋季和冬季,这也证明了Hi-GLASS陆表潜热通量产品符合正常的自然规律。
图5
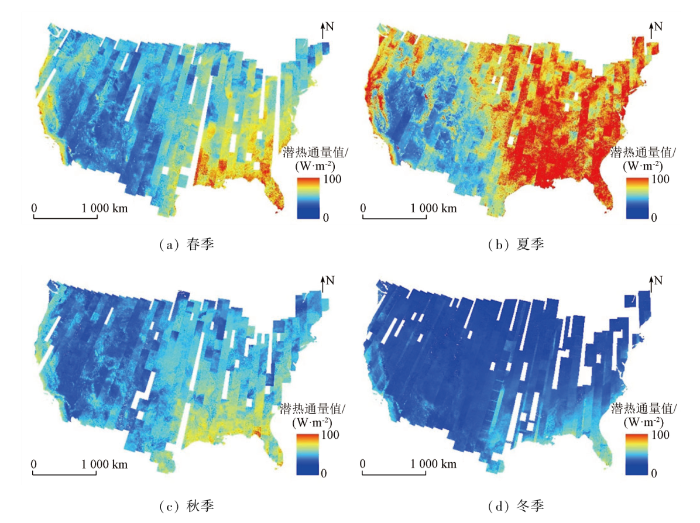
图5
2014年Hi-GLASS潜热通量产品美国地区空间分布
Fig.5
Spatial distribution map of Hi-GLASS latent heat flux products in the United States in 2014
4 结论
本文简要介绍了Hi-GLASS陆表潜热通量产品,利用Ameriflux 通量观测站点的潜热通量观测值与相应的Hi-GLASS陆表潜热通量产品估算值对比,对2013—2014年间的Hi-GLASS潜热通量产品进行精度评价,研究结论如下:
1)Hi-GLASS陆表潜热通量产品误差较小且与实测数据的一致性较高。总体指标计算结果为RMSE=34.3 W/m2,Bias=-13.4 W/m2,R2=0.6,KGE=0.49,说明Hi-GLASS陆表潜热通量产品数据具有较高的准确性和可靠性。
2)Hi-GLASS陆表潜热通量产品的在夏季高、冬季低,证明模型符合正常的自然规律。并且Hi-GLASS陆表潜热通量产品在美国地区的分布情况也符合美国的地表覆盖条件。
3)Hi-GLASS陆表潜热通量产品具有良好的拟合效果。从不同地表覆盖站点的潜热通量对比来看, Hi-GLASS陆表潜热通量产品在完整时间序列上的趋势与实际潜热通量观测值能够达到较高程度的一致,更能说明Hi-GLASS算法具有足够可靠的拟合效果。
然而,由于数据获取的局限性,本文只采用了美国区域的18个站点通量数据进行Hi-GLASS陆表潜热通量产品的验证与比较,在其他区域的验证仍需进一步的研究。
志谢
本文Hi-GLASS陆表潜热通量数据的下载得到了武汉大学遥感信息学院何涛教授的大力支持,在此表示感谢!
参考文献
Evaporation and environment
[J].
On the assessment of surface heat flux and evaporation using large-scale parameters
[J].DOI:10.1175/1520-0493(1972)100<0081:OTAOSH>2.3.CO;2 URL [本文引用: 1]
Estimating land surface evaporation:A review of methods using remotely sensed surface temperature data
[J].DOI:10.1007/s10712-008-9037-z URL [本文引用: 1]
Review on estimation of land surface radiation and energy budgets from ground measurement,remote sensing and model simulations
[J].DOI:10.1109/JSTARS.4609443 URL [本文引用: 1]
A review of global terrestrial evapotranspiration:Observation,modeling,climatology,and climatic variability
[J].
先验知识在遥感反演中的作用
[J].
The role of prior knowledge in remote sensing inversion
[J].
论热红外遥感中的基础研究
[J].
On the basic research in thermal infrared remote sensing
[J].
以微分热惯量为基础的地表蒸发全遥感信息模型及在甘肃沙坡头地区的验证
[J].
Remote sensing information model of surface evaporation based on differential thermal inertia and its verification in Shapotou area of Gansu Province
[J].
基于互补相关原理的区域蒸散量估算模型比较
[J].
Comparison of different complementary relationship models for regional evapotranspiration estimation
[J].
DOI:10.11821/xb200403002
[本文引用: 1]

Based on meteorological and hydrological data in the Yellow River Basin covering 1981-2000, Advection-Aridity model, CRAE model and Granger model were validated at different temporal scales and in different climatic conditions by means of remote sensing and digital elevation model. Different climatic factors' effects on performance of models and variation characteristics of empirical parameters were analysed. Results show that with the exception of several extreme arid years, annual errors of Advection-Aridity model, CRAE model and Granger model were less than 10%. Monthly evapotranspirations from Advection- Aridity model were rational. However, CRAE model and Granger model overestimates monthly evapotranspirations during the winter. Spatial distribution of water balance closure errors for Advection-Aridity model is similar to that of Granger model. The closure errors for Advection-Aridity model and Granger model are less than that of CRAE model. In arid and humid climates or under more and less available energy conditions, Advection-Aridity model, CRAE model and Granger model did not perform very well.
Development of a global evapotranspiration algorithm based on MODIS and global meteorology data
[J].DOI:10.1016/j.rse.2007.04.015 URL [本文引用: 2]
Improvements to a MODIS global terrestrial evapotranspiration algorithm
[J].DOI:10.1016/j.rse.2011.02.019 URL [本文引用: 2]
植物物候遥感监测精度影响因素研究综述
[J].
DOI:10.18306/dlkxjz.2016.03.005
[本文引用: 1]
基于植物物候的遥感监测对于研究植被对气候变化的响应具有重要的科学价值。本文在阐述植物物候遥感监测原理及其通用技术流程的基础上,分别从植被类型及其所处的地理条件、遥感数据源及其预处理、植物物候遥感识别方法和植物物候遥感监测结果评价4个方面分析了影响植物物候遥感监测精度的因素,并针对当前研究中存在的不足,探讨了提高植物物候遥感监测精度的可行性途径,即建立高分辨率的近地面遥感定点观测及数据共享网络,发展普适性更强的卫星遥感时序数据去噪及植被指数曲线重建方法,寻求稳定性更高的植物物候期遥感识别方法,探索综合运用地面观测、遥感监测与模型模拟实现物候观测空间尺度拓展的可能性。
Review of influencing factors of accuracy of plant phenology monitoring based on remote sensing data
[J].
DOI:10.18306/dlkxjz.2016.03.005
[本文引用: 1]
Monitoring plant phenology with remote sensing data has important scientific value for studying the response of vegetation to climate change. A comprehensive analysis on the influencing factors of accuracy of plant phenology estimation based on principles and general technical processes of remote sensing application in vegetation monitoring was carried out by taking into account the following four aspects: the specific vegetation type and its geographical conditions; remote sensing data and pre-processing; techniques used to identify plant phenometrics; and evaluation of satellite-derived plant phenometrics. Potential methods for improving the accuracy of plant phenology monitoring are thoroughly discussed. These include: building high-resolution near-surface sensor-derived phenology observation and sharing network; developing universally applicable methods for noise removal of satellite remote sensing time-series data and reconstruction of vegetation index curves; searching more stable methods to estimate plant phenology; and exploring the possibility of synthesizing ground-based observation, remote sensing monitoring, and model simulation to achieve the spatial scaling-up of phenometrics.
The EUMETSAT Polar System:Status and first results
[J].
Comparison of satellite-based evapotranspiration models over terrestrial ecosystems in China
[J].DOI:10.1016/j.rse.2013.08.045 URL [本文引用: 1]
Comparison of MOD16 and LSA-SAF MSG evapotranspiration products over Europe for 2011
[J].DOI:10.1016/j.rse.2014.10.017 URL [本文引用: 1]
Land information system:An interoperable framework for high resolution land surface modeling
[J].DOI:10.1016/j.envsoft.2005.07.004 URL [本文引用: 1]
A two-source time-integrated model for estimating surface fluxes using thermal infrared remote sensing
[J].DOI:10.1016/S0034-4257(96)00215-5 URL [本文引用: 1]
Regional evaporation estimates from flux tower and MODIS satellite data
[J].DOI:10.1016/j.rse.2006.07.007 URL [本文引用: 1]
An improved method for estimating global evapotranspiration based on satellite determination of surface net radiation,vegetation index,temperature,and soil moisture
[C]//
Recent decline in the global land evapotranspiration trend due to limited moisture supply
[J].DOI:10.1038/nature09396 [本文引用: 1]
MODIS-driven estimation of terrestrial latent heat flux in China based on a modified Priestley-Taylor algorithm
[J].
Validation of MODIS 16 global terrestrial evapotranspiration products in various climates and land cover types in Asia
[J].DOI:10.1007/s12205-012-0006-1 URL [本文引用: 1]
Estimation of high-resolution terrestrial evapotranspiration from Landsat data using a simple Taylor skill fusion method
[J].DOI:10.1016/j.jhydrol.2017.08.013 URL [本文引用: 5]
Evaluating the spatial representativeness of the MODerate resolution image spectroradiometer albedo product (MCD43) at AmeriFlux sites
[J].
DOI:10.3390/rs11050547
URL
[本文引用: 1]
Land surface albedo is a key parameter in regulating surface radiation budgets. The gridded remote sensing albedo product often represents information concerning an area larger than the nominal spatial resolution because of the large viewing angles of the observations. It is essential to quantify the spatial representativeness of remote sensing products to better guide the sampling strategy in field experiments and match products from different sources. This study quantifies the spatial representativeness of the MODerate Resolution Image Spectroradiometer (MODIS) (collection V006) 500 m daily albedo product (MCD43A3) using the high-resolution product as intermediate data for different land cover types. A total of 1820 paired high-resolution Landsat Thematic Mapper (TM) and coarse-resolution (MODIS) albedo data from five land cover types were used. The TM albedo data was used as the spatial-complete high resolution data to evaluate the spatial representativeness of the MODIS albedo product. Semivarioagrams were estimated from 30 m Landsat data at different spatial scales. Surface heterogeneity was evaluated with sill value and relative coefficient of variation. The 30 m Landsat albedo data was aggregated to 450 m–1800 m using two different methods and compared with MODIS albedo product. The spatial representativeness of MODIS albedo product was determined according to the surface heterogeneity and the consistency of MODIS data and the aggregated TM value. Results indicated that for evergreen broadleaf forests, deciduous broadleaf forests, open shrub lands, woody savannas and grasslands, the MODIS 500 m daily albedo product represents a spatial scale of approximately 630 m. For mixed forests and croplands, the representative spatial scale was approximately 690 m. The difference obtained was primarily because of the complexity of the landscape structure. For mixed forests and croplands, the structure of the landscape was relatively complex due to the presence of different forest and plant types in the pixel area, whereas the other landscape structures were considerably simpler.
Evaluating the performance of Sentinel-3A OLCI land products for gross primary productivity estimation using AmeriFlux data
[J].
DOI:10.3390/rs12121927
URL
[本文引用: 1]
Accurate and reliable estimation of gross primary productivity (GPP) is of great significance in monitoring global carbon cycles. The fraction of absorbed photosynthetically active radiation (FAPAR) and vegetation index products of the Moderate Resolution Imaging Spectroradiometer (MODIS) are currently the most widely used data in evaluating GPP. The launch of the Ocean and Land Colour Instrument (OLCI) onboard the Sentinel-3 satellite provides the FAPAR and the OLCI Terrestrial Chlorophyll Index (OTCI) products with higher temporal resolution and smoother spatial distribution than MODIS, having the potential to monitor terrain GPP. OTCI is one of the red-edge indices and is particularly sensitive to canopy chlorophyll content related to GPP. The purpose of the study is to evaluate the performance of OLCI FAPAR and OTCI for the estimation of GPP across seven biomes in 2017–2018. To this end, OLCI FAPAR and OTCI products in combination with insitu meteorological data were first integrated into the MODIS GPP algorithm and in three OTCI-driven models to simulate GPP. The modeled GPP (GPPOLCI-FAPAR and GPPOTCI) were then compared with flux tower GPP (GPPEC) for each site. Furthermore, the GPPOLCI-FAPAR and GPP derived from the MODIS FAPAR (GPPMODIS-FAPAR) were compared. Results showed that the performance of GPPOLCI-FAPAR was varied in different sites, with the highest R2 of 0.76 and lowest R2 of 0.45. The OTCI-driven models that include APAR data exhibited a significant relationship with GPPEC for all sites, and models using only OTCI provided the most varied performance, with the relationship between GPPOTCI and GPPEC from strong to nonsignificant. Moreover, GPPOLCI-FAPAR (R2 = 0.55) performed better than GPPMODIS-FAPAR (R2 = 0.44) across all biomes. These results demonstrate the potential of OLCI FAPAR and OTCI products in GPP estimation, and they also provide the basis for their combination with the soon-to-launch Fluorescence Explorer satellite and their integration with the Sentinel-3 land surface temperature product into light use models for GPP monitoring at regional and global scales.
Decomposition of the mean squared error and NSE performance criteria:Implications for improving hydrological modelling
[J].DOI:10.1016/j.jhydrol.2009.08.003 URL [本文引用: 1]
