

0 引言
城市热岛效应是指在城市发展过程中形成的城区温度高于周围乡村和郊区温度的现象,是城市化产生最显著的气候问题之一[1]。城市热岛效应与人类健康福祉息息相关,它会影响城市热环境,危害公共健康,加速能源消耗,降低城市宜居性[2-3]。热岛效应产生的原因通常被归结于2个方面[4]: 一个是由于城区内密集的人类和工业活动产生和释放了大量的热量[3,5-6]; 另一个原因被认为是由于城市扩张,大量的不透水面替代了原有的自然风貌,城市地表性质的变化显著地改变了地表辐射、热和湿等特性,使得热量在城市区域聚集[7⇓-9]。大量的研究表明,城市热岛效应的形成受到气象条件、土地利用/覆被结构、景观结构及配置、城市下垫面性质和人类活动的共同影响[4,7,10-11]。而相关研究对城市空间形态,特别是城市扩张方式、城市形态与城市热岛效应关系的关注则相对较少[12]。
本研究以长株潭城市群为研究区域,利用Boyce-Clark形状指数分析城市扩张进程及空间形态变化。基于Google Earth Engine(GEE)平台,利用实用单通道算法进行温度反演,采用地表城市热岛强度表征热岛效应的强度大小,使用均值-标准差法划分温度等级区并定义和提取城市热岛范围。提取城市重心和热岛重心,采用重心迁移方法分析城市扩张与热岛效应之间的变化趋势。研究城市空间形态对热岛效应的影响和作用机理,以期理解城市化快速发展背景下城市热岛效应的形成机制,以及为城市规划者优化城市空间形态以减缓城市热岛效应提供技术参考。
1 研究区概况及数据源
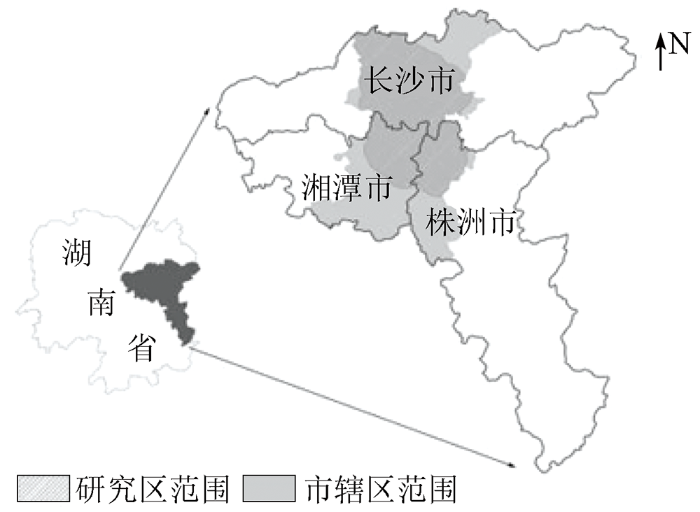
1.1 研究区概况
图1
1.2 数据来源
本文主要基于GEE平台,选取2000年、2005年、2010年、2015年及2018年6—9月云量低于5%的合适Landsat系列影像进行地表温度(land surface temperature,LST)的反演。本文使用来自清华大学全球城市边界(global urban boundaries,GUB)数据集[15],此数据集包含1990—2018年每隔5 a的全球城市边界数据,以此确定长株潭城市群各期主要城市边界范围,并以城市边界为基础,采用建立缓冲区的方法设定城市边界外10 km为本次研究区范围。
2 研究方法
2.1 Boyce-Clark形状指数
式中: SBC为Boyce-Clark形状指数; i为对应的辐射半径序号; ri为第i条半径的辐射半径长度; n为辐射半径数量。
表1 形状类型及其对应Boyce-Clark形状指数参考值
Tab.1
| 形状类型 | 参考指数 | 形状类型 | 参考指数 | |
|---|---|---|---|---|
| 圆形 | 0.00 | H形 | 49.71 | |
| 正八边形 | 2.06 | 长条矩形 | 59.89 | |
| 菱形 | 9.66 | X形 | 66.37 | |
| 正四边形 | 9.66 | 带状矩形 | 90.85 | |
| 竖矩形 | 25.29 | 线矩形 | 94.01 | |
| 横矩形 | 33.04 | 直线形 | 187.50 | |
| 星形 | 34.85 |
2.2 城市热岛提取
使用基于GEE平台上的Landsat原始影像数据、Landsat地表反射率数据、高级星载热发射和反射辐射仪(advanced spaceborne thermal emission and reflection radiometer, ASTER)的全球比辐射率产品以及美国国家环境预报中心 (national centers for environmental prediction, NCEP)提供的再分析大气水汽含量数据,利用实用单通道算法(practical single-channel algorithm, PSC)实现对Landsat系列卫星LST数据反演。PSC算法是由Wang等[19]提出的一种单通道算法,该算法主要对传统单通道算法中普朗克函数的线性化和大气校正过程进行优化,对输入参数误差的敏感性较低,经实测验证,比传统的广义单通道算法的均方根误差降低了1.3 K。
均值-标准差法以LST对平均温度的变异程度作为划分不同温区的依据。以区域平均温度为基准,计算目标像元温度值对于区域平均温度的变化大小与同期温度标准差之间的相对关系,并以此为依据划分相应的温度等级区,可以很好地消除不同时期的温度背景的影响,在不同时相城市热岛演变、对比研究中,一定程度上可以避开不同时相的差异[20-21]。基于文献研究,通常以0.5个标准差和1个标准差作为分割点,将反演后的LST数据划分为5个热力学等级[20],如表2所示,表中Ti表示像元LST值,Tmean表示研究区地表平均温度值,std表示标准差。考虑到高于平均温度的区域更容易成为热岛区域,提取次高温区和高温区作为城市热岛范围进行研究。
表2 均值-标准差法划分温度区等级标准
Tab.2
| LST等级 | 分级标准 |
|---|---|
| 低温区 | Ti<Tmean-std |
| 次低温区 | Tmean-std≤Ti<Tmean-0.5std |
| 中温区 | Tmean-0.5std≤Ti<Tmean+0.5std |
| 次高温区 | Tmean+0.5std≤Ti<Tmean+std |
| 高温区 | Tmean+1std≤Ti |
2.3 重心迁移分析
假设城市和城市热岛均为均值平面。对比城市重心和城市热岛重心之间的空间距离(空间重叠性)[22]及二者变动轨迹的一致性,来分析在2000—2018年期间热岛变化和城市扩张变化之间的关系。
空间距离S的计算公式如下:
式中: CL和CT分别为城市重心和城市热岛重心; (XL,YL)和(XT,YT)分别为其对应的坐标。
使用城市重心和城市热岛重心连线变化的夹角θ的余弦值[23]来表示变动一致性指数C。理论上,C的取值范围在[-1,1]之间,指数值越大,表示二者的变化趋势越一致,当C=-1时表示完全反向,C=1时表示完全同向。其计算公式如下:
式中: ΔX和ΔY为对应城市的横纵坐标变化量; L为城市重心; T为热岛重心。
3 结果与分析
3.1 城市空间形态变化
长株潭3市2000—2018年期间的城市重心及辐射半径变化情况如图2所示,各期城市面积及SBC数值变化如表3所示。2015年后,3个城市的面积都呈现出较大幅度的增长,城市扩张进程加快,城市进一步融合,城市形态也更趋向于稳定。长沙市在2000—2018年期间的SBC数值在20~28之间变化,在空间形态上总体以竖矩形扩张为主,整体上发展较为均衡,且南北向与东西向发展交替进行。株洲市2000—2018年期间SBC数值在22~36之间变化,在空间形态上由星形方式布局向横矩形和竖矩形变化,整体在空间上逐渐与西侧的湘潭市融合。湘潭市2000—2018年期间SBC数值在23~45之间变化,各期之间数值变化较大,城市整体空间形态发展多变,既向北发展靠近长沙市,也同东侧的株洲市逐渐融合,成为联结长株潭城市群发展的纽带。
图2
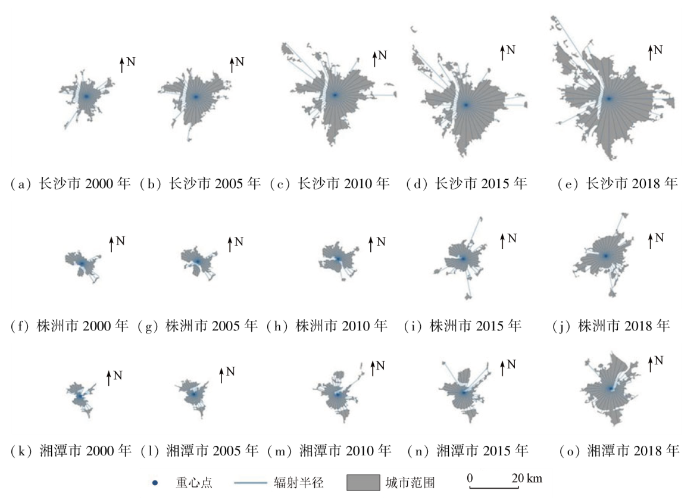
图2
2000—2018年长株潭城市重心及辐射半径
Fig.2
Urban center of gravity and radiation radius of Changsha-Zhuzhou-Xiangtan urban agglomeration from 2000 to 2018
表3 2000—2018年长株潭Boyce-Clark形态指数与城市面积变化
Tab.3
城市 | 2000年 | 2005年 | 2010年 | 2015年 | 2018年 | |||||
|---|---|---|---|---|---|---|---|---|---|---|
| 指数 | 面积/km2 | 指数 | 面积/km2 | 指数 | 面积/km2 | 指数 | 面积/km2 | 指数 | 面积/km2 | |
| 长沙市 | 27.52 | 117.44 | 21.84 | 235.21 | 27.31 | 390.76 | 24.78 | 486.94 | 21.78 | 755.99 |
| 株洲市 | 36.44 | 56.72 | 30.56 | 67.85 | 22.49 | 90.39 | 27.78 | 115.91 | 22.74 | 197.36 |
| 湘潭市 | 45.22 | 42.98 | 27.15 | 62.42 | 29.40 | 96.35 | 31.45 | 123.26 | 23.14 | 247.71 |
3.2 城市热岛效应变化
2000—2018年期间长株潭城市群热岛分布特征如图3所示。综合2000—2018年期间长株潭城市群热岛面积与城市扩张变化情况来看,城市热岛区域增加的主要方向与Boyce-Clark形态指数指示的城市扩张变化的主要方向基本一致。长沙市的热岛区域主要集中在湘江东部,并在2000—2018年期间整体向四周扩散,且主要以东、南2个方向为主。株洲市的热岛区域主要位于湘江北岸,主要扩散方向为东北和西南2个方向。湘潭市热岛区域被“V”字型贯穿的湘江切分成3个部分,其中以中部的热岛面积最大,其余则主要分布在西北部。湘潭市热岛面积增加主要在原有基础上不断外延,热岛面积增加不明显。2018年前后,北部经开区的快速发展,使得该地区成为了湘潭市的热岛“第四极”。
图3
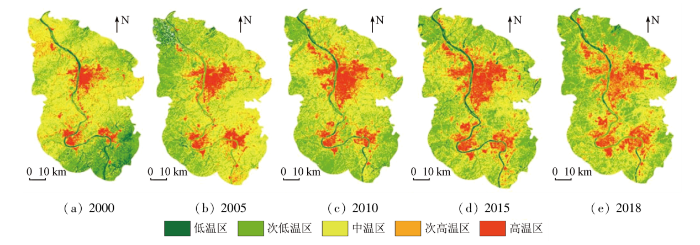
图3
2000—2018年长株潭城市群温区等级分布特征
Fig.3
Grade distribution characteristics of temperature region in Changsha-Zhuzhou-Xiangtan urban agglomeration from 2000 to 2018
长株潭城市群2000—2018年期间各城市热岛面积增加及转换情况如表4所示。从热岛面积增加情况来看,长沙市的热岛面积增加在各研究时间段内均是最高,远超其他2市热岛面积增加的总和。2000—2010年期间,长株潭3市热岛面积增加幅度逐渐增大,2010—2015年则略有下降。在2015—2018年期间,长株潭3市热岛面积增加幅度达到最大,特别是株洲市与湘潭市,热岛面积增加幅度远超往期。2015—2018年期间,长沙市的非热岛面积显著增大,得益于长沙市启动了多项城市改造和重建项目,如芙蓉南路、红星大道等的改造项目,同时大力发展城市绿化和生态环保事业,实施了多个城市绿化和生态修复项目。从转化途径来看,新增热岛来源主要是由于城市扩张引起的城市面积的增加,而城市内部热岛与非热岛区域的转换占比则较少。
表4 2000—2018年长株潭各城市热岛转化类型及面积
Tab.4
| 城市 | 热岛转化类型 | 2000— 2005年 | 2005— 2010年 | 2010— 2015年 | 2015— 2018年 |
|---|---|---|---|---|---|
| 长沙市 | 非热岛转为热岛面积 | 2.08 | 10.49 | 8.42 | 9.17 |
| 热岛转为非热岛面积 | 1.02 | 2.07 | 7.57 | 49.18 | |
| 新增热岛面积 | 103.34 | 142.68 | 77.11 | 154.98 | |
| 株洲市 | 非热岛转为热岛面积 | 5.30 | 0.30 | 3.74 | 3.13 |
| 热岛转为非热岛面积 | 0.11 | 2.32 | 1.73 | 2.23 | |
| 新增热岛面积 | 9.95 | 18.38 | 21.87 | 61.25 | |
| 湘潭市 | 非热岛转为热岛面积 | 0.64 | 0.91 | 3.75 | 3.59 |
| 热岛转为非热岛面积 | 0.42 | 1.75 | 1.62 | 5.37 | |
| 新增热岛面积 | 17.39 | 29.64 | 20.05 | 71.68 |
3.3 重心迁移分析
2000—2018年长株潭城市群各城市的城市重心迁移和热岛重心迁移结果如图4,从转移趋势和转移方向来看,长株潭3市热岛重心的转移趋势同城市重心的变化情况基本一致。长沙市的城市重心与热岛重心在2000—2005年向东南方向迁移,此后逐渐向北移动,特别是2015—2018年期间,北移的幅度较大。株洲市的城市重心和热岛重心在2000—2005年期间小范围东移,此后以向东北方向移动为主,2015—2018年也是移动幅度较大的时间。2000—2018年期间湘潭市的城市重心和热岛重心主要向西南方向迁移。在2005—2010年期间,湘潭市的城市重心与热岛重心的位置与移动轨迹高度重合。
图4
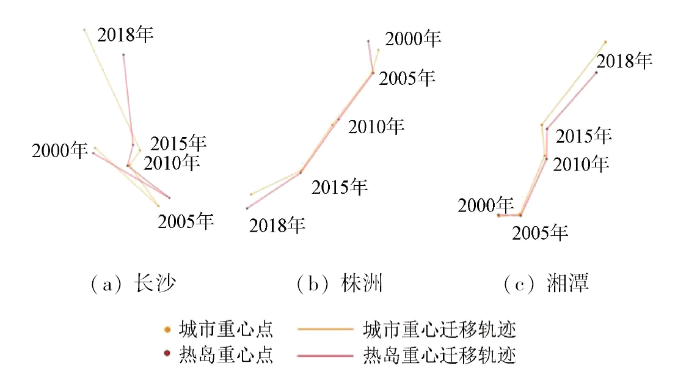
图4
2000—2018年长株潭各城市重心与热岛重心迁移趋势
Fig.4
Trends of urban center of gravity and urban heat island center of gravity migration of Changsha-Zhuzhou-Xiangtan urban agglomeration from 2000 to 2018
从空间距离上看,长株潭3市的城市重心和热岛重心最大的空间距离值都产生在2018年。其中长沙市在2005年、2015年和2018年期间城市重心和热岛重心之间的空间距离都超过了0.10 km,2018年最高达0.57 km。株洲市在2000年和2018年空间距离值超过了0.10 km,2018年最高0.17 km。湘潭市的城市重心与热岛重心之间的空间距离逐年增大,在2015年和2018年超过0.10 km,2018年最高达0.78 km。
如表5所示,从空间移动的一致性来看,历年的城市重心和热岛重心之间的迁移一致性都超过了0.90,湘潭市的双心迁移一致性甚至全都接近1.00,说明城市重心与城市热岛重心在空间迁移上的趋势几乎完全一致。
表5 2000—2018年长株潭各城市重心迁移空间距离及一致性指数
Tab.5
| 城市 | 2000年 | 2005年 | 2010年 | 2015年 | 2018年 | |||||
|---|---|---|---|---|---|---|---|---|---|---|
| S/m | C | S/m | C | S/m | C | S/m | C | S/m | C | |
| 长沙市 | 74.07 | — | 170.39 | 0.98 | 24.84 | 0.96 | 114.13 | 0.95 | 566.37 | 0.96 |
| 株洲市 | 143.76 | — | 12.56 | 0.93 | 91.86 | 1.00 | 27.76 | 1.00 | 172.61 | 0.96 |
| 湘潭市 | 38.26 | — | 39.35 | 0.99 | 93.33 | 1.00 | 153.70 | 1.00 | 775.55 | 1.00 |
4 结论与讨论
本研究以长株潭城市群为研究区域,利用Boyce-Clark形状指数分析城市扩张进程及空间形态变化。利用基于GEE平台的实用单通道算法进行温度反演,采用地表城市热岛强度表征热岛效应的强度大小,使用均值-标准差法划分温度等级区并定义和提取城市热岛范围。提取城市重心和热岛重心,采用重心迁移方法分析城市扩张与热岛效应之间的变化趋势。研究发现:
1)2015—2018年期间是长株潭城市群发展的关键时期。2015—2018年长株潭3市的城市面积分别增大了269.05 km2,81.45 km2和124.45 km2,而城市热岛面积也伴随着城市面积的大幅度增加而增加。
2)城市扩张是热岛面积增加的主要原因。从各期各城市热岛面积增加的主要途径来看,除株洲市2000—2005年外,长株潭3市其余各期新增热岛面积占净热岛增加面积的比率均超过了90%。
3)城市热岛重心与城市重心迁移趋势基本一致,城市热岛范围增加的方向也同城市扩张方向基本一致。长株潭3市的城市重心与热岛重心空间距离虽然每年略有波动,但是差距均在1.00 km以内,城市重心与热岛重心的迁移一致性均超过了0.90,甚至部分时期接近1.00。从空间距离及迁移一致性来看,城市热岛在时空分布上的变化趋势与城市空间形态的变化趋势基本一致。
研究表明城市热岛效应与城市扩张紧密联系,城市热岛范围随城市不透水面面积的扩张而增大,城市热岛范围的重心也随城市重心的迁移而移动。因此,城市规划者可以通过合理的城市规划,分散城市扩张方向,控制城市重要区域不透水面比例,避免城市热岛效应在某个方向或区域上的聚集。同时,城市绿色景观建设和旧城改造可以有效减缓城市内部的热岛现象,决策者通过绿化等工程措施增加城市绿色空间面积,提高建设用地利用率,能有效地减缓城市热岛效应,提高城市居民福祉。
本研究主要探究城市群城市扩张及其热岛响应,重点在于研究城市群空间扩展与城市热岛效应范围空间变化之间的关系,进一步的研究可以考虑城市内部结构变化同城市热岛效应变化之间的关系,如城市街道景观,建设用地与绿色空间布局等。此外,由于南方夏季高温多云多雨,可获取用于温度反演云量适合的遥感影像数量和质量均有限,因此,综合多源遥感数据,提升LST反演的精度,或者获取季节性的综合LST产品有助于更加准确地进行城市热岛效应研究。快速城市化背景下,如何平衡城市发展和环境保护是城市发展所面临的重要挑战,这对提升城市品质、提高城市居民福祉、打造城市品牌具有重要意义。本研究从空间形态变化上深化对城市群城市扩张和热岛效应范围变化之间关系的认知,有助于理解城市化快速发展背景下城市热岛效应的形成机制,为城市管理者和规划者提供参考来优化城市空间形态以达到减缓城市热岛效应的目的。
参考文献
城市热岛的生态环境效应
[J].
A review of the eco-environmental consequences of urban heat islands
[J].
Synergistic Interactions between urban heat islands and heat waves:The impact in cities is larger than the sum of its parts
[J].
DOI:10.1175/JAMC-D-13-02.1
URL
[本文引用: 1]

Cities are well known to be hotter than the rural areas that surround them; this phenomenon is called the urban heat island. Heat waves are excessively hot periods during which the air temperatures of both urban and rural areas increase significantly. However, whether urban and rural temperatures respond in the same way to heat waves remains a critical unanswered question. In this study, a combination of observational and modeling analyses indicates synergies between urban heat islands and heat waves. That is, not only do heat waves increase the ambient temperatures, but they also intensify the difference between urban and rural temperatures. As a result, the added heat stress in cities will be even higher than the sum of the background urban heat island effect and the heat wave effect. Results presented here also attribute this added impact of heat waves on urban areas to the lack of surface moisture in urban areas and the low wind speed associated with heat waves. Given that heat waves are projected to become more frequent and that urban populations are substantially increasing, these findings underline the serious heat-related health risks facing urban residents in the twenty-first century. Adaptation and mitigation strategies will require joint efforts to reinvent the city, allowing for more green spaces and lesser disruption of the natural water cycle.
城市地表温度热岛影响因素研究进展
[J].
An overview and perspective about causative factors of surface urban heat island effects
[J].
DOI:10.11820/dlkxjz.2011.01.004
[本文引用: 2]
Urban heat island (UHI) is a hotspot in the study about urban ecological and environmental effects. UHI effects are caused by multiple factors, and the synthesized mechanism study can supply a foundation to release the negative effects of UHI. This study proposes a theory framework for causative factors of surface urban heat island (SUHI) by analyzing the process of surface energy on the basis of landscape ecology. Since surface temperature represents the process of surface energy, we examine the causative factors of this process, which includes energy absorption/emission, energy translation, and energy transmission. The internal and external progresses on each kind of causative factors are reviewed in this study. We also compare the internal studies on synthesized mechanism of SUHI with external studies. By the comparison of progresses of causative factor studies and the mechanism of SUHI, we deduce the prospect on this field.</br>The energy absorption and emission of surface represent the ability to absorb solar short-wave radiation, and the capacity to emit earth’s surface long-wave radiation, which are controlled by the physical properties of land surface. The studies on this theme focus on land use and biophysical properties. It has reached a consensus on the functions of land use/land cover. The biophysical properties can better describe the relationship between surface characteristics and temperature with higher accuracy. The physical properties of the surface include vegetation, impervious surface, and surface moisture, which are represented by land cover indices derived from remote sensed data including NDVI, ISA, NDBI, NDMI, etc. Energy translation is the process of translating one form of energy into another, which, in this case, is surface heat determined by the intensity of human activities. Population density, energy consumption intensity, and automobile flux are normal indices to depict the intensity of human activities. However, the studies in this field are limited by the spatial resolution of social-economic data. Energy transmission represents the energy flow between different patches referring to the temperature gradient, which primarily depends on the spatial relationship between landscape patches. Two themes in this field have been developed. One is the relationship between temporal heterogeneity of landscape patterns and surface temperature changes. The other is the influence of spatial characteristics of landscape patches on surface temperature. In the field of synthesized causative factors, the external study focuses on the triangle model of temperature, vegetation, and soil moisture. Most of the internal analyses are about the statistical model consisted of land cover and social-economic components.</br>There are two tendencies of the relating studies in the future. Firstly, high resolution data and field survey data will promote the study on the analysis of energy translation and transmission. Secondly, following a description of energy process, we can involve social-economic indicators and landscape patterns in the triangle mechanism model to establish the systemized mechanism of SUHI.
地表城市热岛效应的概念内涵与定量刻画
[J].
DOI:10.11821/dlxb202209008
[本文引用: 2]
明晰城市热岛(UHI)效应相关概念内涵、厘清其定量刻画方法是有效开展UHI效应研究的重要基础。全球城市化进程使UHI效应越发普遍,相关研究数量迅速增长并出现了UHI效应的多样认知,尤其对具有空间异质性表征优势的地表城市热岛(SUHI)效应开发了多样的定量刻画方法,但目前尚缺乏对其定量刻画方法的系统梳理。因此,本文对城市热岛、城市热岛效应、地表温度和城市热环境等易混淆概念进行了辨析,总结了各类UHI典型空间位置和尺度范围。在SUHI效应定量刻画中,将SUHI范围识别方法归结为城乡温度阈值、温度等级阈值、高斯拟合参数、温度衰减突变四大类,指出当前SUHI范围识别研究侧重于对SUHI影响规模的认知。研究同时对各类范围识别方法所对应的SUHI强度表征指标进行了梳理,认为理解指标本质内涵是掌握指标间潜在差异的前提。未来研究应整合多维度数据以突破单一SUHI监测途径,发展大尺度SUHI定量刻画方法以拓展定量研究的广度,认知连通化SUHI空间形态以挖掘范围识别研究的深度。
Conceptual connotation and quantitative characterization of surface urban heat island effect
[J].
DOI:10.11821/dlxb202209008
[本文引用: 2]
Understanding the conceptual connotation related to urban heat island (UHI) effect and clarifying its quantitative characterization methods are important foundations for effective UHI effect research. The global urbanization has made the UHI effect more and more common, which leads to a rapid increase in the number of related studies. In this context, different concepts related to UHI effect have emerged, and particularly, various quantitative characterization methods have been developed for surface urban heat island (SUHI) which has the advantage of spatial heterogeneity characterization. However, there is still a lack of systematic review of quantitative characterization methods of SUHI. Therefore, this study distinguished and analyzed the confusing concepts such as urban heat island, urban heat island effect, surface temperature and urban thermal environment. Then, the typical spatial locations and scale ranges of various UHIs were summarized. In the quantitative characterization of SUHI effect, this study categorized the SUHI range identification methods into four categories: methods based on urban and rural temperature threshold, temperature grade threshold, Gaussian fitting parameter, and temperature attenuation mutation. The current SUHI range identification research focuses on the cognition of the SUHI impact scale. This study also sorted out the SUHI intensity indicators corresponding to various range identification methods. Understanding the essential connotation of each indicator is the prerequisite for grasping the potential differences between the indicators. Future research should integrate multi-source SUHI monitoring methods, develop large-scale SUHI quantitative characterization methods, and cognize connected SUHI spatial morphology.
基于景观格局的城市热岛研究进展
[J].
Studies on urban heat island from a landscape pattern view:A review
[J].DOI:10.5846/stxb URL [本文引用: 1]
中国城市群热岛效应时空演变及其影响因素分析
[J].
DOI:10.13249/j.cnki.sgs.2022.09.003
[本文引用: 1]
基于长期不透水面和MODIS地表温度数据,分析2000—2015年中国城市群扩张及热岛效应时空演变,进而综合采用冗余分析(RDA)、线性回归分析和变异分配分析(VPA)等方法,揭示城市群城市热岛效应的驱动机制。结果表明:城市群内建成区面积快速扩张,不透水面比例从2000年2.08%增长到2015年5.33%,且主要集中于珠江三角洲等沿海城市群;2000—2015年,夏季热岛分布较广,且白天强度高于夜晚。东部以及大部分北部城市群如哈长城市群等,降温强度较大,但其夜晚热岛效应在不同程度增强。冬季夜晚比白天热岛分布广、强度高,北方、西北、东部等地区夜晚热岛效应也在增强;自然环境因素显著影响城市群热岛强度,降水对夏季夜晚热岛强度起显著负贡献(22%),纬度越高,冬季夜晚热岛强度也越高。人为因素显著影响夜晚热岛分布和城市群内热岛强度的平衡,城市植被覆盖显著减少夜晚城市群内热岛分布,灯光强度对夏季夜晚热岛强度起显著负贡献(24%),对热岛比例起显著正贡献(27%),人口密度对夏季夜晚热岛强度起显著负贡献(31%);自然环境因素对热岛强度的贡献占主导,而人为干扰因素对热岛比例的贡献占主导。
Spatio-temporal evolution of heat island effect and its driving factors in urban agglomerations of China
[J].
DOI:10.13249/j.cnki.sgs.2022.09.003
[本文引用: 1]
Urban agglomeration characterized by compact regional cooperation and frequent human mobility has been an obvious direction of urban and socio-economic development in China. However, in the formation of urban agglomeration, rapid impervious expansion and tremendous anthropogenic heat sources making urban areas hotter, which generates the urban heat island (UHI) effect and associated extreme heat events, threatening public health and sustainable development. Although studies have documented the impact of UHI on the urban environment by using a single urban agglomeration as the research object, there is still a lack of knowledge of the driving mechanism of the spatiotemporal pattern of UHI on the national scale. In this study, we observed the urban expansion and the spatiotemporal pattern of UHI in 19 urban agglomerations of China from 2000 to 2015 by using long-term impervious data and MODIS surface temperature data. Furthermore, by using Redundancy analysis (RDA) and linear regression model with the datasets that represent the nature and socio-economic driving factors, we quantified the driving mechanism of spatiotemporal pattern of UHI for all urban agglomerations. Results show that the impervious surface expanded rapidly with its proportion increased from 2.08% to 5.33% during 2000-2015 in China’s urban agglomerations, concentrating in coastal urban agglomerations such as the Pearl River Delta. The proportion of heat island (PHI) was high and the intensity of heat island (SUHIIagg) was higher in summer nighttime than in daytime. The eastern and numerous of northern urban agglomerations such as Harbin-Changchun had strong cooling capacity in summer, however the SUHIIagg increased in nighttime to varying degrees. Besides, the PHI and the SUHIIagg in winter nighttime was higher than that in daytime. And the SUHIIagg in the north, northwest and east urban agglomerations increased in winter nighttime. We found vegetation was significantly reducing the nighttime PHI, while the precipitation was negatively affecting the SUHIIagg in summer nighttime (22%) and latitude was positively affecting the SUHIIagg in winter nighttime (56%). Meanwhile, the nighttime lights was negatively affecting the SUHIIagg(24%) and positively affecting the PHI (27%) while the population negatively affecting the SUHIIagg in summer nighttime (31%).These show that natural environmental factors dominantly contribute to the SUHIIagg, while the human disturbance factors dominantly contribute to the PHI. These show that the interaction between radiation changes and human activities has an important impact on the nighttime UHI effect in China. Since the urban expansion and immigration keep ongoing, the UHI effect is predicted to be more intense and of longer duration in China. Thus, the pathway to balance the development of urban agglomeration and the mitigation of the urban heat environment is a major challenge for government policymaking in China. This study expands the knowledge of the spatiotemporal UHI change at the national scale, which provides a scientific basis for urban planning, alleviating urban heat challenges, and achieving sustainable development.
Assessing spatiotemporal characteristics of urban heat islands from the perspective of an urban expansion and green infrastructure
[J].DOI:10.1016/j.scs.2021.103208 URL [本文引用: 2]
Analysis of land use change and expansion of surface urban heat island in Bogor city by remote sensing
[J].DOI:10.3390/ijgi7050165 URL [本文引用: 1]
Enhanced sensitivity of the urban heat island effect to summer temperatures induced by urban expansion
[J].
DOI:10.1088/1748-9326/ab2740
[本文引用: 1]
A suitable thermal environment is important for the economy, society and public health in urban areas. However, the understanding of the relationship between the urban heat island (UHI) effect and background temperature (T-UHI) is very limited. In this study, the UHI effect induced by the urbanization of the megacity Beijing was investigated using the weather research and forecasting model. Urban expansion and heatwaves both considerably enhanced the UHI effect over urban areas in summer. The strengthened UHI effect during the heatwave period can be clearly explained by the positive sensitivity of T-UHI. The urban expansion increased the sensitivity of T-UHI from 0.0207 °C °C−1 in 2000 to 0.0569 °C °C−1 in 2010 in the daytime and from 0.0715 °C °C−1 in 2000 to 0.0995 °C °C−1 in 2010 at nighttime, thus resulting in a much stronger UHI effect mainly by increasing the difference between the latent heat flux and sensible heat flux. This enhanced sensitivity may exacerbate the urban heat stress in the situation of further urban expansion and background climate warming. Our results suggest that the sensitivity of T-UHI is a meaningful indicator to assess the urban thermal environment change and support the designing of heat mitigation strategies in urban planning.
Satellite remote sensing of surface urban heat islands:Progress,challenges,and perspectives
[J].
DOI:10.3390/rs11010048
URL
[本文引用: 1]
The surface urban heat island (SUHI), which represents the difference of land surface temperature (LST) in urban relativity to neighboring non-urban surfaces, is usually measured using satellite LST data. Over the last few decades, advancements of remote sensing along with spatial science have considerably increased the number and quality of SUHI studies that form the major body of the urban heat island (UHI) literature. This paper provides a systematic review of satellite-based SUHI studies, from their origin in 1972 to the present. We find an exponentially increasing trend of SUHI research since 2005, with clear preferences for geographic areas, time of day, seasons, research foci, and platforms/sensors. The most frequently studied region and time period of research are China and summer daytime, respectively. Nearly two-thirds of the studies focus on the SUHI/LST variability at a local scale. The Landsat Thematic Mapper (TM)/Enhanced Thematic Mapper (ETM+)/Thermal Infrared Sensor (TIRS) and Terra/Aqua Moderate Resolution Imaging Spectroradiometer (MODIS) are the two most commonly-used satellite sensors and account for about 78% of the total publications. We systematically reviewed the main satellite/sensors, methods, key findings, and challenges of the SUHI research. Previous studies confirm that the large spatial (local to global scales) and temporal (diurnal, seasonal, and inter-annual) variations of SUHI are contributed by a variety of factors such as impervious surface area, vegetation cover, landscape structure, albedo, and climate. However, applications of SUHI research are largely impeded by a series of data and methodological limitations. Lastly, we propose key potential directions and opportunities for future efforts. Besides improving the quality and quantity of LST data, more attention should be focused on understudied regions/cities, methods to examine SUHI intensity, inter-annual variability and long-term trends of SUHI, scaling issues of SUHI, the relationship between surface and subsurface UHIs, and the integration of remote sensing with field observations and numeric modeling.
城市空间形态对城市热岛效应的多尺度影响研究进展
[J].
DOI:10.13249/j.cnki.sgs.2021.10.015
[本文引用: 2]
随着全球城市化的快速发展和气候变暖及极端高温事件的加剧,城市热岛效应已成为了21世纪影响人类生存发展的重要环境问题。因此,阐明城市热岛强度时空变化特征,揭示多空间尺度下的形成机制是人文地理学和气候学研究的热点和前沿交叉科学问题。从街道峡谷微观尺度、城市街区局部尺度和城市宏观尺度全面总结和系统梳理了城市空间形态对城市热岛效应的多尺度影响和耦合机制,提出了未来通过定量表征城市热岛强度、城市空间形态的空间格局、时间演化特征及规律,构建空间关系分析模型,进而揭示城市空间形态在不同时空尺度对城市热岛强度的作用机制,为城市规划、宜居城市建设以及气候变化的响应与适应研究提供理论指导。
Effects of urban spatial morphology on urban heat island effect from multi-spatial scales perspectives
[J].
DOI:10.13249/j.cnki.sgs.2021.10.015
[本文引用: 2]
With the rapid development of global urbanization, the further increased global warming and extreme high temperature events, urban heat island effect has also become an important environmental problem affecting human survival and development in the 21st century. Therefore, it is a hot and frontier cross-scientific issue in the study of human geography and climatology to clarify the spatio-temporal variations of urban heat island intensity and reveal the driving mechanism at multi-spatial scales. Urban geometry is regarded as a key factor affecting urban-rural and intra-urban air temperature variations, and the urban form manipulation provides an opportunity to mitigate the adverse effects on urban climate. Therefore, it is critical to understand the relationship between urban form and the UHI effect to guide future planning practice. This paper systematically reviews and summarizes the multi-scale affecting and coupling mechanism of urban spatial morphology on urban heat island intensity from three different spatial scale perspectives including street canyons microscale, urban block local scale, and urban macroscale. Based on the understanding of the spatial distribution and temporal evolution characteristics of urban spatial morphology on urban heat island intensity, we will characterize the specific effects of urban spatial morphology on urban heat island intensity and construct the spatial relationship analysis model to reveal the affecting mechanism of urban spatial morphology on urban heat island intensity at different temporal and spatial scales. Our knowledge and insights will provide theoretical guidance for urban planning, livable city construction and climate change response and adaptation study.
Influence of urban expansion on the urban heat island effect in Shanghai
[J].DOI:10.1080/13658816.2016.1178389 URL [本文引用: 2]
Surface urban heat island effect and its relationship with urban expansion in Nanjing,China
[J].DOI:10.1117/1.JRS.10.026037 URL [本文引用: 1]
Mapping global urban boundaries from the global artificial impervious area (GAIA) data
[J].
DOI:10.1088/1748-9326/ab9be3
[本文引用: 1]
Urban boundaries, an essential property of cities, are widely used in many urban studies. However, extracting urban boundaries from satellite images is still a great challenge, especially at a global scale and a fine resolution. In this study, we developed an automatic delineation framework to generate a multi-temporal dataset of global urban boundaries (GUB) using 30 m global artificial impervious area (GAIA) data. First, we delineated an initial urban boundary by filling inner non-urban areas of each city. A kernel density estimation approach and cellular-automata based urban growth modeling were jointly used in this step. Second, we improved the initial urban boundaries around urban fringe areas, using a morphological approach by dilating and eroding the derived urban extent. We implemented this delineation on the Google Earth Engine platform and generated a 30 m resolution global urban boundary dataset in seven representative years (i.e. 1990, 1995, 2000, 2005, 2010, 2015, and 2018). Our extracted urban boundaries show a good agreement with results derived from nighttime light data and human interpretation, and they can well delineate the urban extent of cities when compared with high-resolution Google Earth images. The total area of 65 582 GUBs, each of which exceeds 1 km2, is 809 664 km2 in 2018. The impervious surface areas account for approximately 60% of the total. From 1990 to 2018, the proportion of impervious areas in delineated boundaries increased from 53% to 60%, suggesting a compact urban growth over the past decades. We found that the United States has the highest per capita urban area (i.e. more than 900 m2) among the top 10 most urbanized nations in 2018. This dataset provides a physical boundary of urban areas that can be used to study the impact of urbanization on food security, biodiversity, climate change, and urban health. The GUB dataset can be accessed from http://data.ess.tsinghua.edu.cn.
The concept of shape in geography
[J].DOI:10.2307/212982 URL [本文引用: 1]
驱动力与制约力相互作用下我国城市空间扩张
[J].
Urban space expansion in China under the interaction between the driving force and the restriction
[J].
中国城市形状的时空变化
[J].
Spatial-temporal changes of the shapes of Chinese cities
[J].Although there is still a dispute about the performance of the BoyceClark shape index, as a quantitative method for measuring the shape, the BoyceClark shape index is a good one in that it can present the general character of city shapes through the experiment. Shape indices of 31 Chinese cities at 1990 and 2000 were computed by the BoyceClark shape index method based on the dynamic landuse data from the National Resources and Environmental Database establishedby the IGSNRR, CAS. According to Lo (1980), the range of shape indices for Chinese cities varies from 10.410 to 40.620 in 1934, 16.170 to 73.070 in 1974, 13.004 to 69.902 in 1990 and from 12.687 to 116.398 in 2000. Chengdu is a city persisting the square shape with the shape indices of 10.550, 16.170, 13.004 and 14.144 in those four years respectively. The averages of the index in the four years are 23.950, 27.090, 32.507 and 31.507 respectively. It was found that, in general, shapes of Chinese cities tended to be less compact in the period from 1934 to 1990, while more compact in the period from 1990 to 2000, and it is perhaps a result of strong control to urban sprawl at the latter period. Generally, city shapes suggest the persistence of square or rectangle shapes from 1934 to 2000, although some cities also experienced linear development in the period from 1990 to 2000. Out of 20 cities, 14 cities showed a decreased trend in shape indices and six cities showed an increased trend from 1934 to 1974, and out of 22 cities, 11 cities’ shape indices decreased and the rest had increased shape index from 1974 to 1990. Moreover, shape indices of several cities have been drastically changed during the period from 1934 to 2000. Lanzhou is a city with a highest increment in shape index (41.810) during 1934 to 1974, and a highest decrease (16.753) during the period from 1934 to 1974. Wuhan and Kunming are the first two cities with a high increment of 28.512 and 26.845 respectively in shape index from 1974 to 1990, but a high decrease of 15.571 and 17.615 respectively in shape index from 1990 to 2000. It means that city shapes are not considered by urban planners and managers as important issues until some urban problems such as heavy traffic and environment pollution appear to affect the life and work of urban inhabitants, therefore city shape is an important issue in urban spatial planning.
A practical single-channel algorithm for land surface temperature retrieval:Application to landsat series data
[J].
DOI:10.1029/2018JD029330
URL
[本文引用: 1]
The single‐channel (SC) algorithm has been widely used to retrieve land surface temperature from Landsat series data for its simplicity and requirement of only one thermal infrared channel. The main error sources of the existing SC algorithms are the linearization of the Planck's function and atmospheric correction. This paper proposed a practical SC (PSC) algorithm to retrieve land surface temperature from Landsat series data aiming at avoiding the aforementioned error sources. The sensitivity of the PSC algorithm to the input parameters was analyzed. The performance of the proposed PSC algorithm was compared with the most commonly used SC algorithm (the generalized SC, GSC) using a simulation data set and satellite measurements. Results showed that the PSC algorithm was less sensitive to uncertainties in the input parameters than the GSC algorithm. When validated with the simulation data set, the root‐mean‐square error (RMSE) of the PSC algorithm was 1.23 K, with an improvement by 0.57 K compared with the GSC algorithm. For the validation with 71 clear‐sky Landsat 8 images, the RMSE of the PSC algorithm was 1.77 K when using the measurements from U.S. surface radiation budget network as real values. Compared with the GSC algorithm, the RMSE improvement for the PSC algorithm was 0.47 K. We conclude that the PSC algorithm is more accurate than the GSC algorithm and the sensitivity to input parameters in the PSC algorithm is weaker than in the GSC algorithm.
等间距法和均值标准差法界定城市热岛的对比研究
[J].利用ASTER数据反演地表温度,采用等间距法和均值-标准差法,将研究区温度场分别划分为4级、5级、6级,并根据热岛区的界定进一步将4级、6级细分为4级(a)、4级(b)、6级(a)和6级(b)。在此基础上,对两种方法从城市热岛数量结构差异、热岛空间分布及细节表达等方面进行了系统对比分析。结果表明:两种方法所界定热岛的面积百分比随着分级数不同均出现跳跃现象,趋势基本一致。但就热岛强度而言,均值-标准差法对分级数的敏感性较等间距法小,在热岛的空间分布和温度变异的细节表现力等方面,均值-标准差法也优于等间距分级法。因此,综合来看,均值-标准差法是城市热岛界定的较适合方法。均值-标准差法以地表温度相对于平均温度的变异程度为依据进行热场划分,在多时相城市热岛演变、对比等研究中,一定程度上可以避开时相的差异。
Comparison analyses of equal interval method and mean-standard deviation method used to delimitate urban heat island
[J].DOI:10.3724/SP.J.1047.2009.00145 URL [本文引用: 2]
基于均值-标准差改进的滨州市多时相热岛强度变化分析
[J].
Multi-temporal analysis of urban heat island intensity variation in Binzhou City based on improved mean-standard deviation
[J].
粤港澳大湾区建设用地扩张与城市热岛扩张耦合态势研究
[J].
DOI:10.12082/dqxxkx.2018.180242
[本文引用: 1]
深入研究粤港澳大湾区建设用地扩张与城市热岛扩张的耦合态势,对改善大湾区生态环境、实现城市化的健康发展,具有重要的意义和科学价值。本文以粤港澳大湾区为研究区域,选取2000、2008和2016年的遥感影像数据和地表温度数据,提取大湾区的建设用地、划分城市热岛强度等级、识别城市热岛区域;在此基础上,使用总体耦合态势和空间耦合特征两种模型揭示大湾区在不同时期建设用地扩张和城市热岛扩张的耦合关系。结果表明:① 2000-2016年,粤港澳大湾区的建设用地扩张和城市热岛扩张趋势具有同步性;② 城市热岛区域面积不断增加,在珠江口两岸逐步形成了连接中山-佛山-广州-东莞-深圳-香港,大范围分布的倒“U”形城市热岛条带;③ 大湾区建设用地与城市热岛的总体耦合态势处于不断加强的过程,至2016年,两类指标的重心距离达到研究期内的最小距离,此时的总体耦合态势最强;④ 研究期内,大湾区未出现建设用地扩张和城市热岛扩张严重失调情况,建设用地扩张和城市热岛扩张耦合类型以耦合型、基本耦合型以及轻度不耦合型为主,空间耦合程度高。
The coupling between construction land expansion and urban heat island expansion in Guangdong-Hong Kong-Macao Greater Bay
[J].
中国经济与人口重心的耦合态势及其对区域发展的影响
[J].
The coupling mechanism of the centroids of economic gravity and population gravity and its effect on the regional gap in China
[J].
DOI:10.11820/dlkxjz.2010.01.012
[本文引用: 1]
<p>Regional gap is an important problem that the regional development of China is facing. The distribution of economy and population, as an embodiment of the spatial equilibrium process of regional development, has a close relation with the state of regional gap. Using gravity models, it works out the center of economic gravity and population gravity (abbr. CEG and CPG), illustrates the coupling process by measuring the overlapping of two centers of gravity and the consistency of their movement, and proves that the coupling process has a high correlation with the evolution of regional gap. Then, a model of the coupling mechanism of CEG and CPG is built. Based on the model, it illustrates the spatial equilibrium process of regional development by the transition of equilibrium location and the conversion of regional potential energy difference, and reveals how the internal and external factors affect the process. Therefore, the authors advance a “multistage inverted-U-curve evolution law” of regional gap. Finally, it analyses the mechanism of the periodic variation of regional gap in China since 1952, and brings up a discussion of the path to coordinating the regional development of China.</p>
