Urban expansion in the Changsha-Zhuzhou-Xiangtan urban agglomeration and its urban heat island effect from 2000 to 2018
YAO Lingyun1,2(), WANG Li1, NIU Zheng1,2, YIN Ziqi1,2, FU Yuwen1,2
1. State Key Laboratory of Remote Sensing Science, Aerospace Information Research Institute, Chinese Academy of Sciences, Beijing 100094, China 2. University of Chinese Academy of Science, Beijing 100049, China
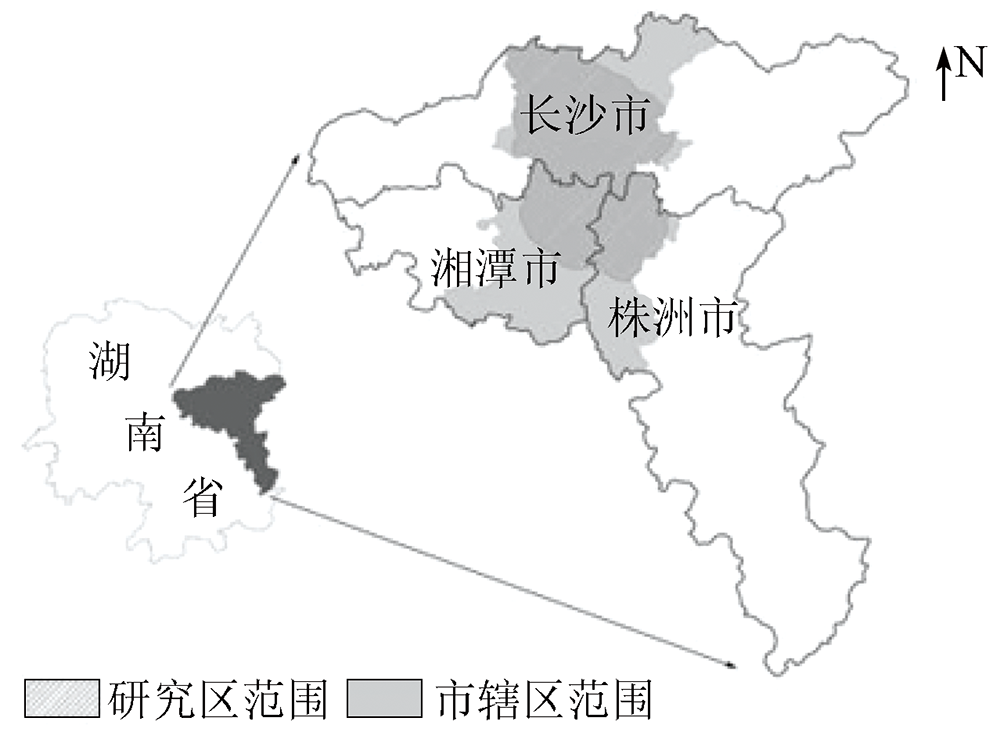
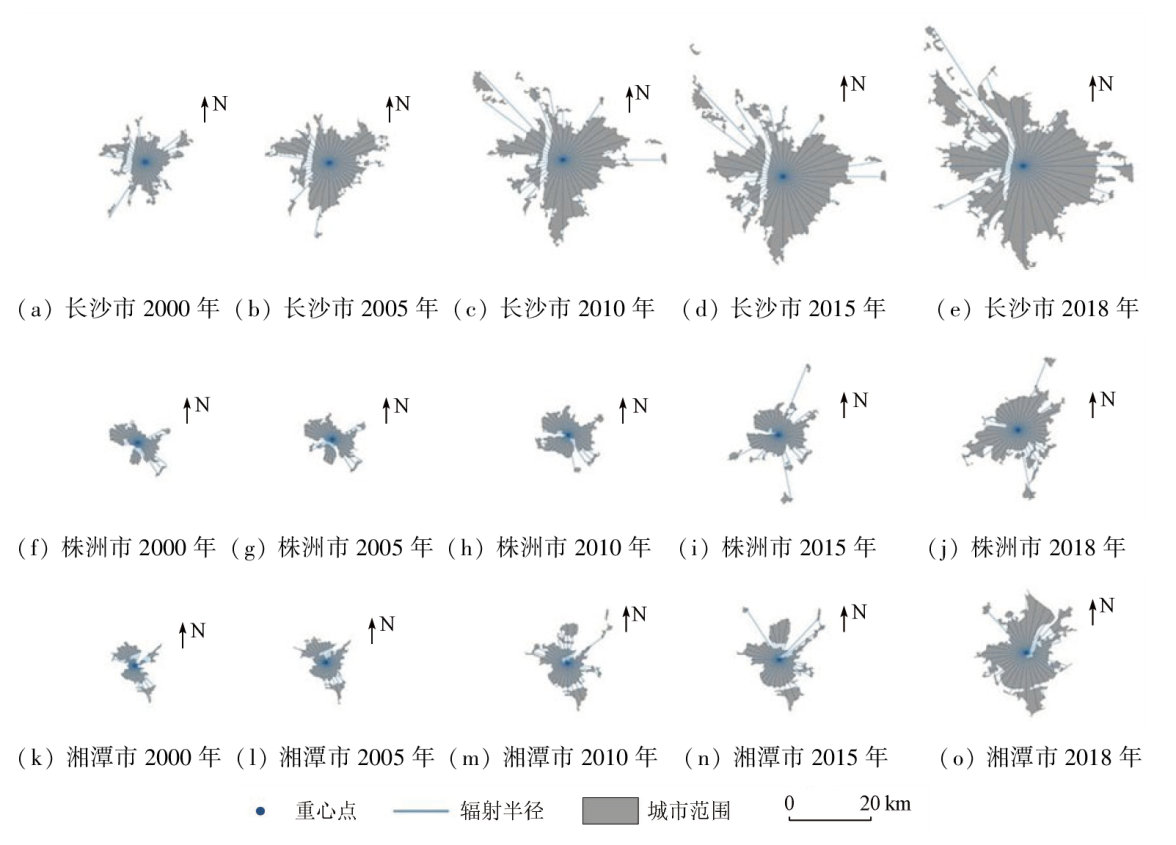
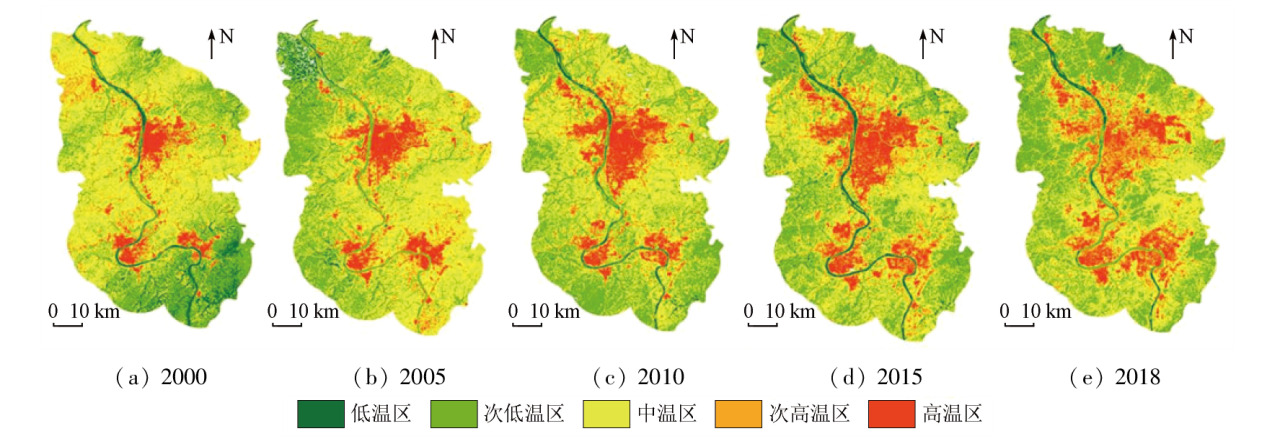
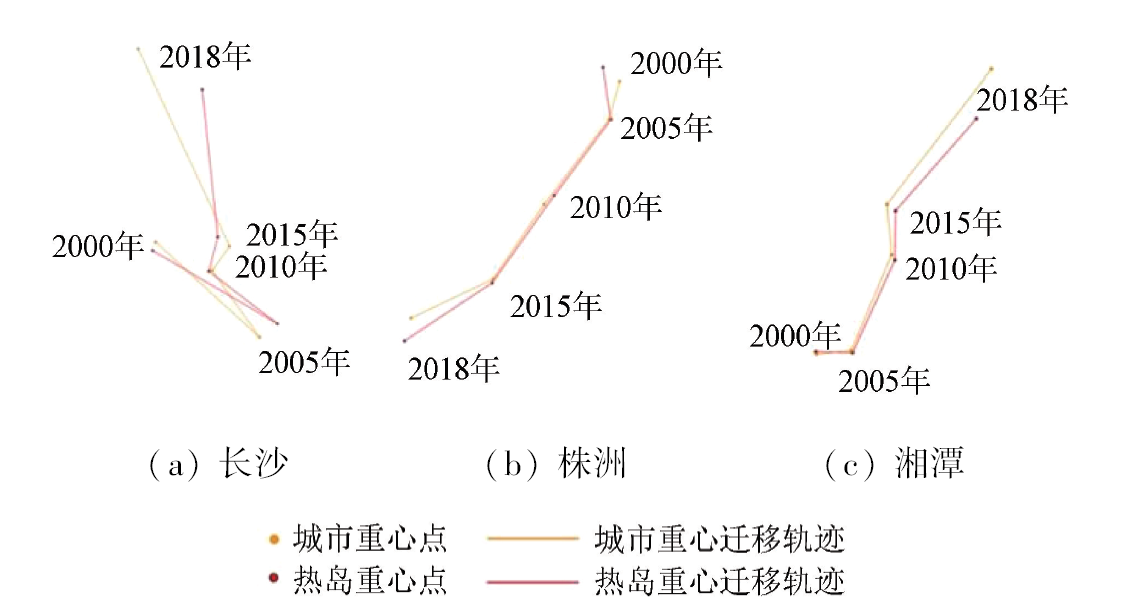
The urban heat island effect is closely linked with the well-being of urban residents. Rapid urbanization has further accelerated urban expansion. This is accompanied by an increasingly significant urban heat island effect, especially in cities of central and western China in the past 20 years. To explore the relationship between the expansion of cities and urban agglomerations and the changes in the urban heat island effect, this study analyzed the expansion and spatial form variation of cities in the Changsha-Zhuzhou-Xiangtan urban agglomeration using the Boyce-Clark shape index. The land surface temperatures were derived through inversion using the practical single-channel algorithm based on the Google Earth Engine (GEE) platform. The temperature zones with different grades were determined using the mean-standard deviation method, followed by the definition and extraction of the range of the urban heat island effect. The urban center and heat island center were extracted, and the variation trends of the relationship between urban expansion and urban heat island effect were analyzed using the center shift method. The results show that the changes in the urban heat island effect were consistent with the expansion of the urban agglomeration and its cities. The results lead to the following conclusions: ① After 2015, the Changsha-Zhuzhou-Xiangtan urban agglomeration entered a critical period of rapid development; ② Urban expansion is the primary cause of the increase in the area of urban heat island effect; ③ The urban heat island center roughly shares the same variation trend with the urban center, and the urban heat island range increases in the direction roughly consistent with the urban expansion direction.
姚灵筠, 王力, 牛铮, 尹子琪, 付雨文. 2000—2018年长株潭城市群城市扩张及其热岛响应[J]. 自然资源遥感, 2024, 36(1): 162-168.
YAO Lingyun, WANG Li, NIU Zheng, YIN Ziqi, FU Yuwen. Urban expansion in the Changsha-Zhuzhou-Xiangtan urban agglomeration and its urban heat island effect from 2000 to 2018. Remote Sensing for Natural Resources, 2024, 36(1): 162-168.
Xiao R B, Ouyang Z Y, Li W F, et al. A review of the eco-environmental consequences of urban heat islands[J]. Acta Ecologica Sinica, 2005, 25(8):2055-2060.
[2]
Li D, Bou-Zeid E. Synergistic Interactions between urban heat islands and heat waves:The impact in cities is larger than the sum of its parts[J]. Journal of Applied Meteorology and Climatology, 2013, 52(9):2051-2064.
doi: 10.1175/JAMC-D-13-02.1
Xie M M, Wang Y L, Fu M C. An overview and perspective about causative factors of surface urban heat island effects[J]. Progress in Geography, 2011, 30(1):35-41.
doi: 10.11820/dlkxjz.2011.01.004
Chen A L, Sun R H, Chen L D. Studies on urban heat island from a landscape pattern view:A review[J]. Acta Ecologica Sinica, 2012, 32(14):4553-4565.
doi: 10.5846/stxb
Hu N L, Ren Z B, Dong Y L, et al. Spatio-temporal evolution of heat island effect and its driving factors in urban agglomerations of China[J]. Scientia Geographica Sinica, 2022, 42(9):1534-1545.
doi: 10.13249/j.cnki.sgs.2022.09.003
[7]
Tian P, Li J L, Cao L D, et al. Assessing spatiotemporal characteristics of urban heat islands from the perspective of an urban expansion and green infrastructure[J]. Sustainable Cities and Society, 2021, 74: 103208.
doi: 10.1016/j.scs.2021.103208
[8]
Nurwanda A, Honjo T. Analysis of land use change and expansion of surface urban heat island in Bogor city by remote sensing[J]. ISPRS International Journal of Geo-Information, 2018, 7(5):165.
doi: 10.3390/ijgi7050165
[9]
Gao Z, Hou Y, Chen W P. Enhanced sensitivity of the urban heat island effect to summer temperatures induced by urban expansion[J]. Environmental Research Letters, 2019, 14(9):094005.
doi: 10.1088/1748-9326/ab2740
[10]
Zhou D C, Xiao J F, Bonafoni S, et al. Satellite remote sensing of surface urban heat islands:Progress,challenges,and perspectives[J]. Remote Sensing, 2018, 11(1):48.
doi: 10.3390/rs11010048
Huang Q F. Effects of urban spatial morphology on urban heat island effect from multi-spatial scales perspectives[J]. Scientia Geographica Sinica, 2021, 41(10):1832-1842.
doi: 10.13249/j.cnki.sgs.2021.10.015
[12]
Zhao M Y, Cai H Y, Qiao Z, et al. Influence of urban expansion on the urban heat island effect in Shanghai[J]. International Journal of Geographical Information Science, 2016, 30(12):2421-2441.
doi: 10.1080/13658816.2016.1178389
[13]
Tu L L, Qin Z H, Li W J, et al. Surface urban heat island effect and its relationship with urban expansion in Nanjing,China[J]. Journal of Applied Remote Sensing, 2016, 10(2):026037.
doi: 10.1117/1.JRS.10.026037
[14]
湖南省统计局. 湖南统计年鉴[M]. 北京: 中国统计出版社, 2021.
Hunan Provincial Bureau of Statistics. Hunan Statistical Yearbook[M]. Beijing: China Statistics Press, 2021.
[15]
Li X C, Gong P, Zhou Y Y, et al. Mapping global urban boundaries from the global artificial impervious area (GAIA) data[J]. Environmental Research Letters, 2020, 15(9):094044.
doi: 10.1088/1748-9326/ab9be3
[16]
Boyce R R, Clark W A V. The concept of shape in geography[J]. Geographical Review, 1964, 54(4):561-572.
doi: 10.2307/212982
Xiong H, Zheng B H, Jia L. Urban space expansion in China under the interaction between the driving force and the restriction[J]. Economic Geography, 2016, 36(1):82-88.
Wang X S, Liu J Y, Zhuang D F, et al. Spatial-temporal changes of the shapes of Chinese cities[J]. Resources Science, 2005, 27(3):20-25.
[19]
Wang M M, Zhang Z J, Hu T, et al. A practical single-channel algorithm for land surface temperature retrieval:Application to landsat series data[J]. Journal of Geophysical Research: Atmospheres, 2019, 124(1):299-316.
doi: 10.1029/2018JD029330
Chen S L, Wang T X. Comparison analyses of equal interval method and mean-standard deviation method used to delimitate urban heat island[J]. Journal of Geo-Information Science, 2009, 11(2):145-150.
doi: 10.3724/SP.J.1047.2009.00145
Ren Z D, Huang Y, Tan H Z, et al. Multi-temporal analysis of urban heat island intensity variation in Binzhou City based on improved mean-standard deviation[J]. Desert and Oasis Meteorology, 2022, 16(2):40-47.
Yang Z W, Chen Y B, Wu Z F, et al. The coupling between construction land expansion and urban heat island expansion in Guangdong-Hong Kong-Macao Greater Bay[J]. Journal of Geo-Information Science, 2018, 20(11):1592-1603.
Fan J, Tao A J, Lyu C. The coupling mechanism of the centroids of economic gravity and population gravity and its effect on the regional gap in China[J]. Progress in Geography, 2010, 29(1):87-95.
doi: 10.11820/dlkxjz.2010.01.012
 2024, Vol. 36
  ), 王力1, 牛铮1,2, 尹子琪1,2, 付雨文1,2