

0 引言
生态环境是人类生存生活的重要基础。近年来,全球气候变化不断加剧,加之不同国家与区域城市化进程等土地开发利用活动日益剧烈,经济发展、资源利用、环境污染三者之间的矛盾愈发严重,对区域生态环境产生显著影响。在此背景下,开展区域生态环境精准监测与评估成为准确把握区域生态环境状况、辅助开展相关治理与规划的重要前提[1]。
生态环境状况是由多角度、多方面、多层次因素构成的复杂系统,须对其逐层分解进而开展综合定量评价[2]。作为对区域生态环境状况优劣程度判断的依据,国内外相关学者对此进行了大量研究。如生态足迹法、层次分析法和指标评价法等。Miao等[3]基于生态足迹方法测算安徽省生态足迹、生态环境承载力、生态赤字和生态盈余,以此评估生态环境的协调发展状态; 邵波等[4]基于层次分析方法构建了甘肃省生态环境质量综合评价指标体系并对生态环境进行综合全面的评价; 叶亚平等[5]和厉彦玲等[6]构建出生态环境质量综合评价系统,用于定量评价我国区域的生态环境状况。上述指标体系虽然能客观评价生态环境状况,然而由于缺乏统一标准,只能用于生态环境相对优劣程度的监测[5]。为此,国家环境保护部提出基于遥感数据与统计数据的生态指数(ecological index,EI)开展评价区域生态环境状况及变化趋势[7-8],规范了我国生态环境状况及变化趋势的标准指标评价体系及计算方法,在生态环境监测中得到广泛应用。然而,该指数是运用权重叠加等统计方法计算出的笼统数值,权重确定与指标获取等主观性较强,不利于开展流域等中、大尺度区域的研究。为此,国内学者[9⇓-11]从遥感和地理信息技术的角度提出了EI的改进模型。其中遥感生态环境指数(remote sensing ecological index,RSEI)基于遥感监测手段耦合人类所能切实感知生态环境优劣的指标[12],在区域生态环境监测与评价中得到了研究学者与管理部门的广泛重视。
洞庭湖流域是长江中下游重要生态区,其生态环境状况不仅对于本地区生态系统安全与社会经济发展具有重要作用,同时也对长江中下游其他地区生态安全产生重要影响。因此,如何科学准确地评价洞庭湖流域生态环境状况及其影响因素对于区域生态保护与规划具有重要作用。针对上述问题,本文采用长时序遥感数据,基于RSEI定量评估洞庭湖流域生态环境时空特征,定量解析自然因素与土地利用与覆盖变化(land use and cover change,LUCC)的影响方式与贡献率,以期为理解区域生态环境演化特征、指导生态环境治理提供科学依据[13]。
1 研究区概况与数据源
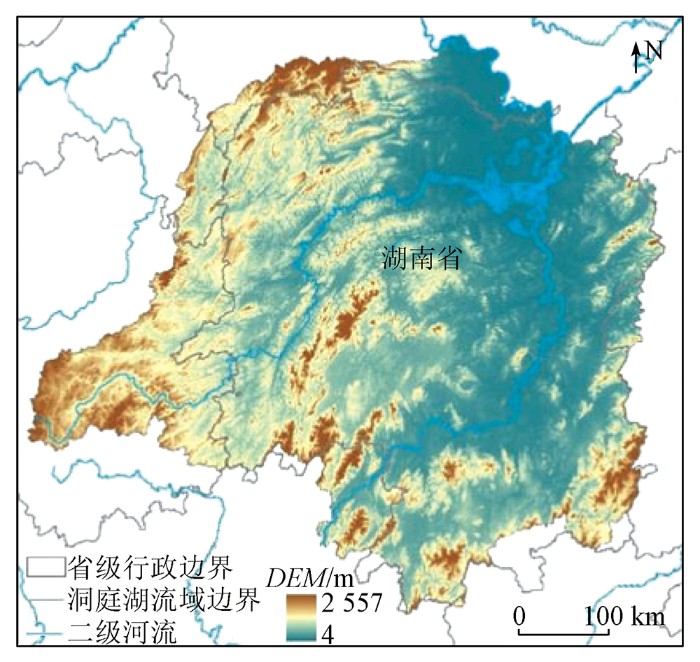
1.1 研究区概况
图1
1.2 数据来源
本文采用MODIS系列数据包括2010—2019年植被生长季(7—9月)地表反射率产品(MOD09A1)、植被指数产品(MOD13A3)、陆地表面温度产品(MOD11A2)和土地覆盖类型三级数据产品(MCD12Q1)。上述数据均来源于美国国家航空航天局(
2 研究方法
根据徐涵秋[12]构建的RSEI,基于MODIS数据获取4个独立生态指标: 绿度,采用归一化植被指数(normalized difference vegetation index,NDVI)计算; 湿度,使用湿度指数(WET)计算; 干度,使用基于MODIS的归一化建筑-裸土指数(normalized difference built-up and soil index,NDSI)计算; 热度,使用地表温度(land surface temperature,LST)计算,综合各指数所涵盖的生态意义定量评价流域范围生态环境状况:
式中,
2.1 绿度指标
式中:
2.2 湿度指标
式中:
2.3 干度指标
充分考虑裸土指数和建筑指数对生态干度状态的表达,结合新型的MODIS建筑指数和MODIS裸土指数计算平均值构建基于MODIS的干度指数NDSI[20]。
式中: NDBIM和BSIM分别为MODIS建筑指数和MODIS裸土指数;
2.4 热度指标
LST是气候变化的重要表现形式,也是驱使生态环境变化的重要因素。本研究直接采用MOD11A2地表温度数据产品,并将其转换为摄氏度用于提取研究区的地表温度空间分布状况。
式中:
2.5 遥感生态指数RSEI构建
基于NDVI,WET,NDSI和LST指标,进一步采用主成分分析方法构建遥感生态指标。为了消除不同指标的量纲对结果的影响,在计算主成分之前,对各个指标进行标准化处理,使指标值压缩在[0,1]之间,公式如下:
式中:
式中:
2.6 相关性分析
为探究RSEI与各影响因素之间的相关性,采用皮尔逊相关系数r计算。公式如下:
式中:
2.7 土地利用变化轨迹
式中:
2.8 土地利用变化贡献的定量评估方法
根据得到的土地利用变化轨迹Trac,计算研究时间阶段内各类型土地利用变化轨迹Trac所对应的单位RSEI变化平均值
式中: 将用地类型由x转变为y的区域的土地利用转化轨迹Trac标记为轨迹
3 结果与分析
3.1 各指标时空变化特征及对流域生态环境的影响
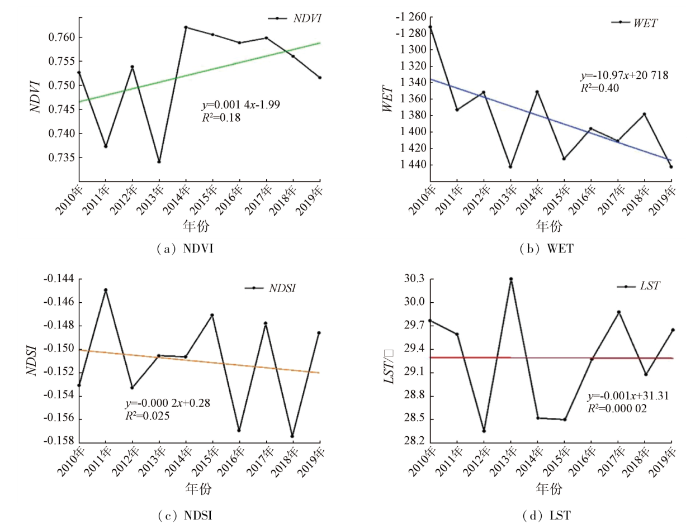
计算洞庭湖流域2010—2019年10 a间各生态指标年均值,结果如图2所示。由图可知,洞庭湖流域植被生长季NDVI总体呈现波动增长趋势(p<0.01)。湿度指标总体呈现波动下降趋势(p<0.01)。2013年,上述指标均出现研究期内最低值,主要原因可能是因为2013年作为洞庭湖流域夏季典型旱年,降雨匮乏,严重影响植被的生长发育,导致植被生物量显著降低。
图2
空间上(图3),NDVI总体呈现出“西高东低”阶梯式分布特点,高植被覆盖区主要集中在西部山区以及在流域东部沿山脉分布[25]。湘中盆地以及北部洞庭湖平原地势较为平坦、人口密度大,植被较稀疏[26]。北部洞庭湖平原、西部山区和流域内主要水系覆盖区域,湿度明显较高,而湘中盆地城市区域湿度则相对较低。NDSI是反映区域建筑用地面积和未利用地面积的综合指标,其空间特征与城市空间分布较一致。LST在城市化较快、建筑物分布密集区域的值明显更高。利用主成分分析统计方法构建RSEI,定量分析不同指标对流域生态系统质量的贡献特征。从表1可以看出,各年份第一主成分(PC1)方差贡献率均大于70%,其中2013年方差贡献率达到84.63%,表明PC1综合了4个生态指标的主要特征信息。进一步分析表明,NDVI与WET对PC1贡献为正数,而NDSI和LST则为负数[27]。从其贡献程度上,NDVI和LST对PC1贡献率相对较大[28]。
图3
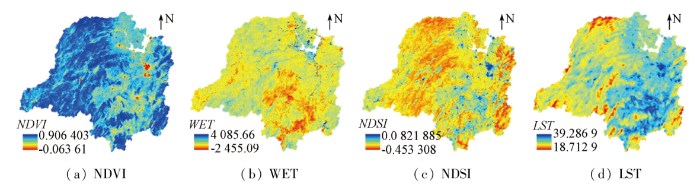
图3
生态指标空间分布特征
Fig.3
Spatial distribution characteristics of ecological indicators
表1 主成分分析结果
Tab.1
| 指标 | 2010年 | 2011年 | 2012年 | 2013年 | 2014年 | 2015年 | 2016年 | 2017年 | 2018年 | 2019年 |
|---|---|---|---|---|---|---|---|---|---|---|
| NDVI | 0.490 | 0.520 | 0.700 | 0.550 | 0.640 | 0.710 | 0.750 | 0.610 | 0.660 | 0.580 |
| WET | 0.068 | 0.095 | 0.056 | 0.052 | 0.068 | 0.041 | 0.054 | 0.053 | 0.066 | 0.088 |
| NDSI | -0.200 | -0.150 | -0.097 | -0.059 | -0.150 | -0.029 | -0.031 | -0.085 | -0.022 | -0.099 |
| LST | -0.840 | -0.840 | -0.700 | -0.830 | -0.750 | -0.700 | -0.650 | -0.790 | -0.750 | -0.800 |
| 特征值 | 0.009 | 0.009 | 0.006 | 0.009 | 0.005 | 0.005 | 0.006 | 0.008 | 0.007 | 0.009 |
| 方差贡献率/% | 77.700 | 81.100 | 76.800 | 84.600 | 73.500 | 78.300 | 82.800 | 80.800 | 81.800 | 82.800 |
3.2 洞庭湖流域生态环境状况时空特征
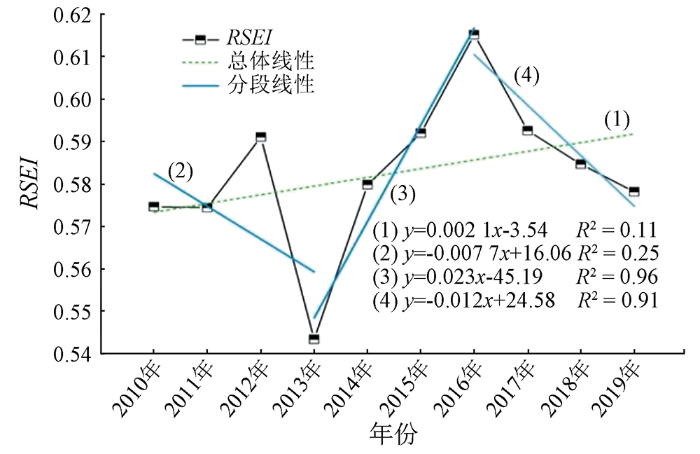
基于上述指标,定量评价2010—2019年洞庭湖流域生态环境状况。结果表明,洞庭湖流域生态环境总体状况良好,RSEI多年均值为0.58,并呈波动增长态势(p<0.01)(图4)。此外,不同阶段变化特征差异较大。2013年RSEI最低(0.54),主要原因是由于2013年的全局性干旱严重影响了该区域生态环境状况。随后,流域RSEI出现较强上升趋势,2016年到达峰值(0.62)。2016年以后RSEI下降,主要原因可能是研究区气候变化以及经济驱动下的城市扩张导致生态环境面临新一轮压力。
图4
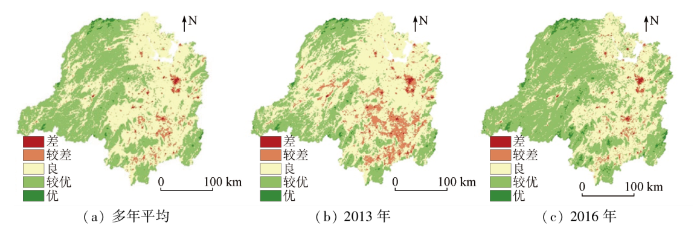
根据RSEI值将区域生态环境状况划分为差[0,0.2)、较差[0.2,0.4)、良好[0.4,0.6)、较优[0.6,0.8)、优[0.8,1][27],从表2和图5可以看出,其中生态状况等级为良好和较优所占比重最大(>85%)。多年平均统计结果表明(图5(a)),生态状况较优区域主要分布在西部武夷山区与雪峰山区、东部罗霄山脉,以及南部南岭山区,该地区植被覆盖度较高,土地利用类型以林地为主,人口密集程度相对较低,受人类活动影响小[29]。生态状况良好区域集中在洞庭湖流域的洞庭湖平原和湘中南丘陵地带。相反,受人类活动较强的长株潭城市群、湘中盆地以及沅江部分区域生态状况表较差。进一步对比分析极端条件下生态环境空间变化特征可以发现,在生态环境状况最差的2013年(图5(b)),恶化区域主要发生于流域中间的平原地区; 而生态环境状况最好的2016年(图5(c)),其改善区域主要发生于流域西部山区。因此,未来生态系统管理与规划时需要注意加强生态敏感性较脆弱的平原地区的保护力度,同时进一步强化山区林地对区域生态环境的正向促进作用。
表2 生态状况等级面积统计
Tab.2
| RSEI 质量 等级 | 多年均值 | 2013年 | 2016年 | |||
|---|---|---|---|---|---|---|
| 面积/ km2 | 占比/% | 面积/ km2 | 占比/% | 面积/ km2 | 占比/% | |
| 差 | 790 | 0.30 | 1 221 | 0.47 | 1 068 | 0.41 |
| 较差 | 10 488 | 4.01 | 25 712 | 9.84 | 8 525 | 3.26 |
| 良好 | 126 373 | 48.36 | 151 525 | 57.98 | 97 878 | 37.45 |
| 较优 | 121 676 | 46.56 | 80 449 | 30.78 | 148 124 | 56.68 |
| 优 | 2 016 | 0.77 | 246 | 0.93 | 5 748 | 2.20 |
图5
3.3 洞庭湖流域生态环境影响因素分析
本文进一步探索洞庭湖流域生态环境的影响因素。相关性分析结果表明,气温、降水和地形均与RSEI表现出较强的相关性,相关系数分别为0.81,0.55和0.73。此外,LUCC亦对生态环境具有较强影响,相关系数为0.67,具体如图6所示。林地RSEI最高(0.65),并随时间呈现缓慢增加趋势。其次是耕地(0.50)、草地(0.49)和水体与湿地(0.48)。
图6
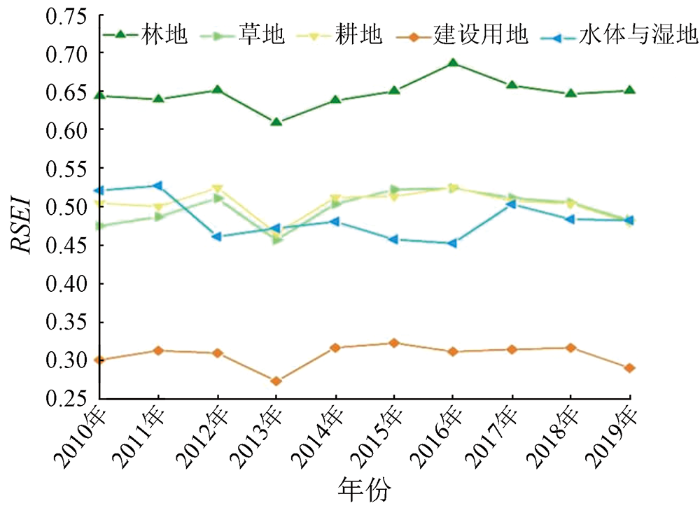
图6
2010—2019年不同地类RSEI年际生长季均值变化趋势
Fig.6
Trends of RSEI mean annual growth season in different land types from 2010 to 2019
表3 变化转换类型
Tab.3
| 土地利用转换类型 | 编号 | 面积/km2 | 占比/% |
|---|---|---|---|
| 永久林地 | 1111111111① | 143 243 | 54.81 |
| 永久草地 | 2222222222 | 50 340 | 19.26 |
| 永久耕地 | 3333333333 | 30 068 | 11.51 |
| 永久建筑用地 | 4444444444 | 3 081 | 1.18 |
| 永久水体与湿地 | 5555555555 | 1 526 | 0.58 |
| 林地→草地 | — | 3 798 | 1.45 |
| 草地→耕地 | — | 6 260 | 2.40 |
| 草地→林地 | — | 5 524 | 2.11 |
| 耕地→草地 | — | 4 315 | 1.65 |
①1,2,3,4,5分别表示林地、草地、耕地、建筑用地和水体与湿地等用地类型。
图7
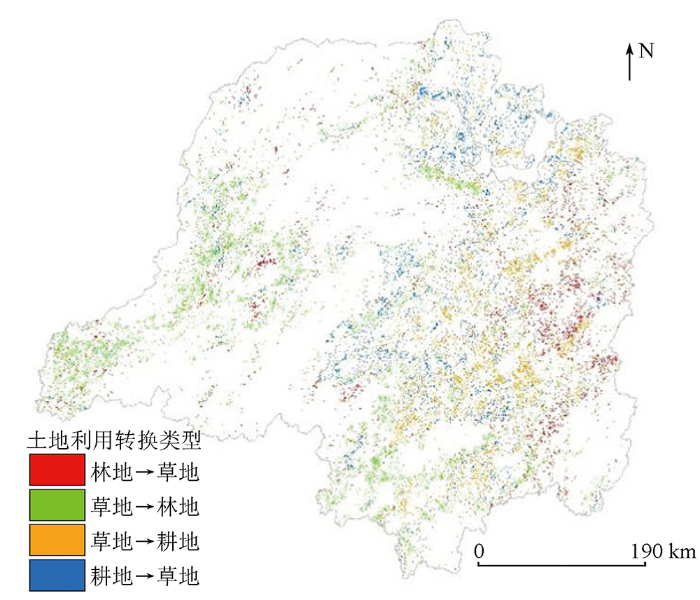
其中,“林地→草地”轨迹主要发生在流域东部边缘的罗霄山脉区域,“草地→林地”主要在流域的西部和东部山区,并呈带状分布。“耕地↔草地”交错转化区主要分布在地势较低的中部地区以及北部洞庭湖平原等粮食产区。
以土地类型不变区域RSEI变化值代表自然因素对遥感生态环境指数的影响,剔除土地变化区域RSEI变化值,从而得到LUCC的贡献特征。统计结果如表4所示,“草地→林地”、“草地→耕地”轨迹中LUCC对区域生态环境的贡献值分别为0.002 5和0.000 9,分别占所对应轨迹区域RSEI总变化量的46.30%和23.68%。另一方面,“林地→草地”、“耕地→草地”轨迹LUCC贡献值均为-0.000 4,分别占其RSEI总变化值的14.81%和44.44%。上述结果进一步证实,林地对于维系区域生态环境状况具有至关重要的作用。2000年以来,洞庭湖流域实行了植树造林、退耕还林、退田还湖还湿等一系列生态治理修复工程[30],森林等生态系统水源涵养、调蓄纳洪、土壤保持等功能的显著增强使流域生态环境状况得到有效提升。同时坚守耕地保护红线,充分考虑各生态系统之间相互依存、相互制约的关系,有利于实现山水林田湖草生命共同体理念[31]。
表4 土地利用变化轨迹贡献特征
Tab.4
| 土地利用 变化类型 | 轨迹编号 | 面积/ km2 | RSEI平 均变化率 | 贡献值 | 贡献 率/% |
|---|---|---|---|---|---|
| 林地→草地 | 1111111112 | 470 | 0.001 6 | -0.000 4 | 14.8 |
| 1111111122 | 651 | 0.001 7 | |||
| 1111111222 | 730 | 0.001 2 | |||
| 1111122222 | 227 | 0.000 9 | |||
| 1111222222 | 295 | 0.001 3 | |||
| 1112222222 | 467 | 0.002 2 | |||
| 1122222222 | 423 | 0.002 8 | |||
| 1222222222 | 535 | 0.003 3 | |||
| 草地→林地 | 2111111111 | 538 | 0.004 6 | 0.002 5 | 46.3 |
| 2211111111 | 677 | 0.004 9 | |||
| 2221111111 | 535 | 0.004 8 | |||
| 2222111111 | 609 | 0.005 6 | |||
| 2222211111 | 539 | 0.005 9 | |||
| 2222221111 | 299 | 0.006 0 | |||
| 2222222111 | 777 | 0.005 9 | |||
| 2222222211 | 1 140 | 0.005 3 | |||
| 2222222221 | 1 146 | 0.005 7 | |||
| 草地→耕地 | 2222222223 | 701 | 0.003 1 | 0.000 9 | 23.7 |
| 2222222233 | 816 | 0.003 6 | |||
| 2222222333 | 706 | 0.002 9 | |||
| 2222223333 | 310 | 0.003 6 | |||
| 2222233333 | 339 | 0.003 3 | |||
| 2222333333 | 409 | 0.004 1 | |||
| 2223333333 | 604 | 0.004 6 | |||
| 2233333333 | 906 | 0.004 4 | |||
| 2333333333 | 733 | 0.004 5 | |||
| 耕地→草地 | 3222222222 | 532 | -0.000 5 | -0.000 4 | 44.4 |
| 3322222222 | 360 | -0.001 4 | |||
| 3332222222 | 372 | -0.002 7 | |||
| 3333222222 | 422 | -0.003 0 | |||
| 3333322222 | 273 | -0.001 4 | |||
| 3333333222 | 574 | -0.001 3 | |||
| 3333333322 | 675 | -0.000 9 | |||
| 3333333332 | 1 107 | -0.000 5 |
4 讨论
本文针对当前广受关注的生态环境热点问题,面向多因子交互作用下LUCC影响方式不清、贡献特征不准的科学难题,基于长时序遥感数据,通过创新性引入“轨迹分析”方法,开展了洞庭湖流域生态环境时空特征及其影响因素分析研究,研究具有以下鲜明特点:
本文基于绿度、湿度、干度和热度4个生态指标构建了洞庭湖流域RSEI,进而研究了流域生态环境状况时空动态特征。总体而言,RSEI以其机制明确、易于实现等特点,有助于直观高效地展示区域生态环境现状,进而为生态环境管理与规划提供科学的理论支持。该方法利用主成分分析评估区域总体生态环境状况,但忽略了生态系统不同因子对系统作用存在的复杂非线性特征[32]。未来研究需在此基础上,进一步探讨不同因子对生态系统的非线性作用方式,构建更加符合生态环境复杂系统的评估指标与模型,提高区域生态环境评估的客观性与准确性。
5 结论
1)2010—2019年洞庭湖流域NDVI较高(NDVI=0.75),并呈不断绿化趋势(p<0.01)。WET总体呈现波动下降趋势(p<0.01),而NDSI与LST整体趋势较为平稳。空间上,高植被覆盖区域主要集中在西部山区以及在流域东部沿山脉分布,WET与流域水系分布呈现较强关联性,NDSI及LST空间特征与城市空间分布相一致,而LST较高的地方其NDVI相对较低。不同因子时空差异较大,需要因地制宜开展生态环境差异化治理与管理,促进区域生态环境质量提升。
2)洞庭湖流域整体生态环境状况较好,生态状况良好和较优区域占研究区总面积的85%以上。时间上,流域生态环境状况持续改善,RSEI呈现波动上升趋势(p<0.01)。空间上,生态环境状况较优区域集中分布在NDVI较高的西部、东部以及南部山区,而较差区域则分布在受人类活动较强的长株潭城市群、湘中盆地以及沅江部分区域。未来研究须在强化自然区域生态环境的同时,重点关注城市扩张土地利用变化对生态环境的潜在负面影响,实现生态环境保护与社会经济发展的协调可持续发展。
3)气温、降水及高程等自然因素与LUCC等人类活动均对区域生态环境具有重要影响。林地遥感生态环境指数RSEI最高(0.65),耕地(0.50)、草地(0.49)和水体与湿地(0.48)次之,而建筑用地值最低(0.31)。不同用地转化类型贡献对生态环境作用方式与贡献程度差异较大,“草地→林地”和“草地→耕地”转化对区域生态环境的改善具有促进作用。反之,林地和耕地向草地的转化可能会导致区域生态环境产生恶化。可以发现,LUCC对区域生态环境具有不可忽视的影响,从而为面向生态环境质量提升的国土空间规划奠定了理论依据。另一方面,不同土地类型转化的贡献特征差异较大,林地生态功能较强,未来需要在前期“退耕还林”等生态工程的基础上,进一步加强森林区域的保护力度,不断提升区域生态环境质量。
本文系统分析洞庭湖流域生态环境时空特征,并初步定量解析了LUCC影响方式与贡献特征。后续研究将在此基础上进一步探索不同因素对生态环境影响的内在物理机制及其交互作用,进而构建区域生态环境模拟模型,开展不同情景下生态环境的模拟与预测,为区域生态环境治理与规划提供可对比的辅助方案,促进区域生态环境与社会经济协调可持续发展。
参考文献
赣南稀土矿开发区生态环境遥感动态监测与评估
[J].
Eco-environmental dynamic monitoring and assessment of rare earth mining area in Southern Ganzhou Using Remote Sensing
[J].
生态环境动态监测与评价指标体系探讨
[J].
Preliminary study on construction of indicator system of dynamic monitoring and assessment of eco-environments
[J].
The studies of ecological environmental quality assessment in Anhui Province based on ecological footprint
[J].DOI:10.1016/j.ecolind.2015.08.040 URL [本文引用: 1]
甘肃省生态环境质量综合评价的AHP分析
[J].
AHP analysis on the integrated assessment for the eco-environment of Gansu Province
[J].
中国省域生态环境质量评价指标体系研究
[J].
A preliminary study on assessment indicator system of provincial eco-environmental quality in China
[J].
基于综合指数法的生态环境质量综合评价系统的设计与应用
[J].
Designing and application of comprehensive index method based ecological environment quality comprehensive evaluation system
[J].
生态环境状况指数模型在全国生态环境质量评价中的应用
[J].
The application of ecological environment index model on the national evaluation of ecological environment quality
[J].
RS和GIS支持下的自然生态环境评价——以南水北调雅砻江工程区为例
[J].
Integrated evaluation of eco-environment based on RS/GIS:A case study of the south-to-north water transfer project in Yalongjiang River
[J].
区域生态环境变化的遥感评价指数
[J].
A remote sensing index for assessment of regional ecological changes
[J].
基于遥感数据的新生态环境指数评价
[J].
DOI:10.13474/j.cnki.11-2246.2021.330
[本文引用: 1]

针对生态环境评价指数获取困难、评价标准各异的问题,本文提出了新生态环境指数(NEI),即以生物丰度指数、植被覆盖指数、干度指标、湿度指标及空气质量指数综合反映区域生态环境状况,并利用主成分分析法客观确定权重。结果表明,NEI的指标选取和结果均与《生态环境状况评价技术规范》中的生态环境指数(EI)具有较强可比性。但NEI指数具有结果量化、可视化及实时化的特点,对于评价区域生态环境状况具有较好的应用前景。
New ecological index evaluation based on remote sensing data
[J].
DOI:10.13474/j.cnki.11-2246.2021.330
[本文引用: 1]
According to the problems of difficulty in obtaining eco-environmental assessment index and different evaluation criteria, a new ecological index (NEI) is put forward. The index synthetically reflects the regional eco-environment status by biological richness index, vegetation coverage index, dryness index, wetness index and air quality index, and uses principal component analysis to objectively determine the weight. The results indicate that NEI's index selection and results have strong comparability with EI in "Technical Criterion for Ecosystem Status Evaluation". However, the NEI's index has the characteristics of quantification, visualization and real-time results, and has a good application prospect for evaluating the regional ecological environment.
城市遥感生态指数的创建及其应用
[J].
A remote sensing urban ecological index and its application
[J].
基于遥感生态指数的神东矿区生态环境变化监测
[J].
Monitoring ecological environment change based on remote sensing ecological index in Shendong mining area
[J].
近52年来洞庭湖流域气象干旱的时空分布特征
[J].
Temporal and spatial distribution characteristics of meteorological drought for recent 52 years in Dongting Lake basin
[J].
洞庭湖流域水资源承载力时空演变分析
[J].
Spatial-temporal evolution of water resources carrying capacity in Dongting Lake basin
[J].
1981—2000年中国陆地植被碳汇的估算
[J].
Estimation of carbon sinks of tervestrial vegetation in China from 1981 to 2000
[J].
基于遥感生态指数的雄安新区生态质量评估
[J].
Ecological quality assessment of Xiongan New Area based on remote sensing ecological index
[J].
基于缨帽变换的遥感图像融合方法研究
[J].
Research on remote sensing image fusion methods based on tasseled cap transformation
[J].
MODIS tasseled cap transformation and its utility
[C]//
基于MODIS的京津冀地区生态质量综合评价及其时空变化监测
[J].
MODIS-based comprehensive assessment and spatial-temporal change monitoring of ecological quality in Beijing-Tianjin-Hebei region
[J].
基于MODIS时序数据的秦巴山区生态环境质量动态监测及驱动力分析
[J].
Dynamic monitoring and driving forces of eco-environmental quality in the Qinba Mountains based on MODIS time-series data
[J].
基于遥感生态指数的平朔露天矿生态环境评价
[J].
Ecological environment evaluation based on remote sensing ecological index in Pingshuo Open-pit Mine
[J].
Trajectory based detection of forest-change impacts on surface soil moisture at a basin scale Poyang Lake Basin,China
[J].DOI:10.1016/j.jhydrol.2014.04.044 URL [本文引用: 2]
A greening world enhances the surface-air temperature difference
[J].
DOI:10.1016/j.scitotenv.2018.12.210
[本文引用: 1]
The surface-air temperature difference (Ts-Ta) is a critical variable for tracking climatic and environmental change. Vegetation has unavoidably affected the temperature by altering surface properties, while the magnitude of this effect has remained unknown. This study aimed to investigate the patterns of global Ts-Ta and quantify the contribution of vegetation change. Trend analysis, correlation analysis and a trajectory-based method were adopted for the investigation. The results demonstrated that the global Ts-Ta decreased by -0.140 K from 2001 to 2016. The greening trend covered 24.46% of the land and played a profound role in changing Ts-Ta. In particular, vegetation changes resulted in -0.0022 K, -0.0092 K and - 0.0043 K of the Ts-Ta decreases at the global, greening and browning levels, respectively accounting for 11.58%, 35.38% and 20.38% of the total decrease. Physically, vegetation influenced Ts-Ta mainly by altering atmospheric properties, rather than surface properties. Specifically, the greening of the surface reduced the albedo at a rate of -0.0003/year over 20% of the global land and enhanced atmospheric water vapor by 3 x 10(-5) g/m(3) over approximately 40% of the land. Meanwhile, the effect of vegetation change varied with coverage. A reduction in albedo caused by vegetation change occurred equally over different vegetated conditions, while the enhancement of atmospheric water vapor occurred mainly in sparsely (0.10 < NDVI < 0.30) and densely (0.55 < NDVI < 0.70) vegetated regions. Under these conditions, the vegetation change mainly affected Ts-Ta in sparsely vegetated regions (NDVI < 0.4). The results of this study are helpful for understanding the physical mechanism behind changes in global Ts-Ta and support climatic adaptation and environmental management. (C) 2018 Elsevier B.V.
2001-2013年洞庭湖流域植被覆盖度时空变化特征
[J].
DOI:10.3724/SP.J.1047.2016.01209
[本文引用: 2]
本文基于2001-2013年MODIS NDVI多时序数据,采用像元二分模型估算了洞庭湖流域植被覆盖度,分析了区域近13年来植被覆盖度的变化特征及趋势,并结合同期气象数据,阐明了植被覆盖度变化对气候因素的响应。结果表明:(1)近13年洞庭湖流域植被覆盖度的整体变化较为稳定,呈微弱减少趋势,速率为-0.3%/10a。(2)洞庭湖流域绝大部分区域植被覆盖状况良好,植被覆盖度呈自西向东递减趋势,高植被覆盖度及中高植被覆盖度占整个流域面积的88.63%,水体或低植被覆盖度及中低植被覆盖度仅占2.57%。(3)洞庭湖流域植被覆盖度变化趋势为北部强于南部、东部强于西部。流域内植被覆盖度极显著与显著减少的面积比例为5.30%、增加面积的比例为4.29%,植被覆盖度变化不显著占90.40%。该区域植被覆盖度变化受人为因素影响更大。
Spatial-temporal variations of vegetation coverage in the Lake Dongting Basin from 2001 to 2013
[J].
基于MODIS NDVI时序数据的湖南省植被变化研究
[J].
Study on vegetation change in Hunan Province based on MODIS NDVI time series data
[J].
基于遥感生态指数的甬江流域生态环境变化分析
[J].
Analysis of ecological environment changes in Yongjiang River basin based on remote sensing ecological index
[J].
基于遥感生态指数模型的渭南市生态环境质量动态监测与分析
[J].
DOI:10.13287/j.1001-9332.201612.024
[本文引用: 1]
本文基于1995和2015年的Landsat系列遥感影像,利用主成分分析法确定绿度、湿度、干度、热度4个指标的权重,采用遥感生态指数(RSEI)评价模型,对渭南市1995—2015年的生态环境质量进行监测与分析.结果表明: 1995—2015年,渭南市的生态环境质量总体呈上升趋势,RSEI均值由0.489上升至0.556;生态环境改善的地区主要分布在渭南市中部,占总面积的49.6%;生态环境退化的地区主要分布在韩城市部分矿区和渭南市南部区县(秦岭北麓渭南段),仅占总面积的15.4%.研究区生态环境质量受城市规划建设影响较大,但总体上其生态环境质量有所改善,得益于近年来该市对生态环境的关注与投入.
Dynamic monitoring and analysis of ecological environment in Weinan City,Northwest China based on RSEI model
[J].
洞庭湖流域生长季气象特旱对植被覆盖的影响
[J].
Impacts of meteorological extreme drought during growing season on vegetation cover in Dongting Lake basin
[J].
近40年来洞庭湖流域土地利用及生态风险时空演变分析
[J].
Spatial-temporal evolution of land use and ecological risk in Dongting Lake Basin during 1980—2018
[J].
基于生态系统服务视角的山水林田湖草生态保护与修复——以洞庭湖流域为例
[J].
Ecological protection and restoration of forest,wetland,grassland and cropland based on the perspective of ecosystem services:A case study in Dongting Lake Watershed
[J].
改进型遥感生态指数与RSEI的对比分析
[J].
Comparison between modified remote sensing ecological index and RSEI
[J].DOI:10.11834/jrs.20229338 URL [本文引用: 1]
洞庭湖流域植被覆盖变化及其协同治理
[J].
DOI:10.15957/j.cnki.jjdl.2022.04.021
[本文引用: 1]
植被覆盖变化是评估生态效应与治理成效的关键性因素之一。基于洞庭湖流域2000—2019年MODIS-NDVI和同期气温、降水、土地利用等相关数据,运用Sen+Mann-Kendall、Hurst指数、偏相关分析、残差分析等多种方法,全面分析了流域植被覆盖时空演化与未来变化趋势,主要结论如下:①年际变化上,流域生长季NVDI呈分阶段波动上升趋势,植被覆盖显著增加。②空间分布上,流域大部分区域植被覆盖状况良好,呈“西高东低”分布特征;但未来流域大部区域植被NDVI可能呈增长放缓或退化趋势。③气候影响因素上,流域生长季NDVI与降水和气温变化均呈正相关,但气温对植被生长的正向促进作用强于降水。④人类影响因素上,农业生产与生态工程建设对流域植被变化具有正面效应;土地利用变化对流域植被变化具有双重影响作用;城市扩张则是导致NDVI减少的主要因素之一。未来流域生态治理范围应重点关注残差呈持续减少特征的湖区沿线、经济较发达区域以及已建成经济区的周边扩展区域,构建“有为政府、有效市场、有机社会”三位一体的生态协同治理新格局。
Vegetation cover change in Dongting Lake basin and its coordination governance
[J].
DOI:10.15957/j.cnki.jjdl.2022.04.021
[本文引用: 1]
Vegetation cover change is one of the key factors to evaluate ecological effect and governance effect. Based on the NDVI data of the Dongting Lake basin from 2000 to 2019,and combined with the temperature,precipitation and land data of the same period,The research uses the methods of Sen+Mann-Kendall,Hurst index,partial correlation analysis,residual analysis methods together to analyze the characteristics of spatio-temporal changes and future trends of vegetation cover in Dongting Lake basin. The main conclusions are as follows: 1) In terms of time scale,NDVI in Dongting Lake basin shows a fluctuating growth trend from April to October,and the vegetation coverage is improved significantly. 2) In terms of spatial distribution,the pattern of vegetation coverage appears as characteristics of "higher value in the west of Dongting Lake basin and low value in the east". In the future,vegetation NDVI changes in most regions may show a slowing growth trend or a degrading trend. 3) In terms of climate factors,the NDVI is positively correlated with changes in precipitation and temperature,but the positive effect of temperature is stronger than precipitation. 4) In terms of human factors,agricultural production and ecological engineering construction have the positive effects on vegetation changes. Land use change has the dual effects on vegetation cover. Urban expansion is one of the main factors leading to the reduction of NDVI. In the future,the scope of ecological governance areas should focus on the areas along the Dongting Lake,the economically developed areas,and the surrounding expansion areas of established economic zones where it has the characteristics of continuous reduction in residuals,in order to build a new pattern of ecological coordination governance with a trinity of "effective government,effective market,and organic society".
