

0 引言
遥感技术因其高时效、大范围和低成本的优点,已经成为红树林分布信息获取的主要手段[5-6]。目前红树林遥感识别大多采用光学遥感数据,包括星载遥感和机载遥感[7⇓⇓⇓-11]。星载遥感数据具有大幅宽优势,常应用在大区域红树林分布监测中。Ma等[12]采用Landsat影像结合决策树方法提取了1985—2015年广东省红树林面积,并分析了30 a间红树林变化的驱动因子。Sentinel-2卫星具有更高的时空分辨率,成为近年来红树林识别的重要数据源。Xiao等[13]利用Sentinel-2等多源遥感数据生成了2018—2020年全球10 m空间分辨率的红树林分布数据LREIS_GLOBALMANGROVE_v2 (LREIS_GM2),并免费向公众公开。除了光学数据,合成孔径雷达(synthetic aperture Radar, SAR)数据和激光雷达(light detection and ranging,LiDAR)数据等也在红树林制图中发挥重要作用,尤其是联合多源遥感数据来提高制图精度已经成为目前研究的热点[14]。大范围的多源遥感影像处理带来了巨大的计算负担,2010年谷歌公司联合卡内基梅隆大学和美国地质调查局推出了遥感数据计算平台Google Earth Engine(GEE),能够提供多种遥感数据源和强大的并行算力,极大减轻了数据处理的压力[15],并已应用在大范围红树林提取工作中。Zhao等[16]基于GEE平台,利用Sentinel-1和Senintel-2数据,结合随机森林(random forest,RF)模型提取了中国沿海地区红树林分布。
尽管目前已有不少学者利用多源遥感数据提取了广东省甚至全国、全球的红树林分布地图,但这些工作主要采用特定一组特征进行制图,如何利用多源遥感特征设计最优特征组合来提高红树林制图精度仍有待探索。本研究以2021年广东省红树林为研究对象,利用多源遥感数据充分提取光谱、散射、地形和纹理等特征,探究红树林识别的最佳特征组合,最后基于GEE平台生成高精度的广东省红树林地图,并与现有红树林产品进行对比,验证本文制图结果的可靠性。本研究通过挖掘多源遥感数据的最优特征组合实现红树林精准识别,成果有望为大范围红树林遥感制图提供科学参考。
1 研究区概况及数据源
1.1 研究区概况
图1
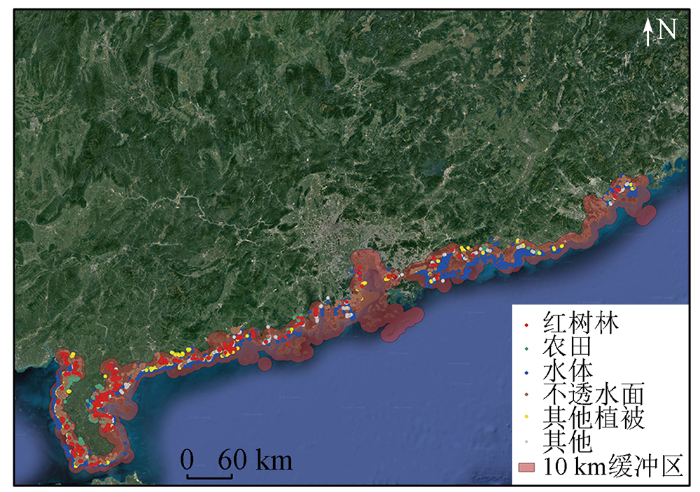
图1
研究区位置及样本数据分布示意图
Fig.1
Location of the study area and distribution of sample data
1.2 数据源及其预处理
本研究所用数据包括Setninel-1数据、Setinel-2数据、SRTMGL1_003数据和样本数据。Sentinel-1和Sentinel-2均属于欧洲航天局“哥白尼计划” 地球观测卫星。Sentinel-1载有 C波段SAR,可实现单极化和双极化等不同极化方式。本文采用Sentinel-1的地距多视影像数据,该数据分辨率为 5 m×20 m,成像工作模式为干涉测量宽幅模式,极化方式为VV/VH。Sentinel-2卫星提供多光谱影像,共有13个波段。本文选用Sentinel-2数据中的level-2A数据,该数据已经经过几何纠正、辐射校正和大气校正,并包含质量波段,可用来去除影像中的云。数字高程模型数据(digital elevation model,DEM)对地貌划分和海岸资源识别具有重要作用[19],本研究采用的DEM数据为SRTMGL1_003产品,该产品反映2000年的全球地表起伏状态,空间分辨率为1″(约30 m)[20]。以上数据来源于GEE,为了统一空间分辨率,将这些数据重采样至10 m,同时对Sentinel-2数据进行去云处理,对Sentinel-1数据进行去噪滤波,相关预处理工作均通过GEE平台完成。
样本数据基于2021年实地调研和谷歌高分辨影像目视解译获得,共得到红树林样本点1 020个。另外,本研究还搜集了其他样本,包括: 不透水面、水体、农田、其他植被和其他类型(包括潮滩、沙石等),这些样本的数量与红树林样本数基本保持一致,分别为: 1 155,1 008,1 067,1 189和1 055个,所有样本按7∶3比例随机划分为训练集和测试集。
2 研究方法
2.1 特征优选与组合设计
表1 植被指数计算公式
Tab.1
| 指数名称 | 计算公式① |
|---|---|
| 归一化植被指数 | NDVI= |
| 地表水指数 | LSWI= |
| 修正归一化差异水体指数 | MNDWI= |
| 淹没红树林指数 | IMFI= |
红边归一化植被指数 | RENDVI= |
①式中Red,Green,Blue,NIR,SWIR1,RE1和RE2分别为Sentinel-2数据中红光、绿光、蓝光、近红外、短波红外1、红边1和红边2波段的反射率。
纹理信息反映纹理基元在空间上的灰度分布情况,本文采用近红外波段生成灰度共生矩阵来提取常用的6种纹理信息[26]: 角二阶矩(Asm)、对比度(Contrast)、相关性(Corr)、方差(Var)、逆差矩(Idm)和熵(Ent); 散射信息来源于Sentinel-1数据中的VV和VH后向散射系数; 地形信息利用DEM数据提取高程(Elevation)、坡向(Aspect)、阴影(Shape)和坡度(Slope)特征。
为了探究红树林识别的最佳特征组合,首先利用RF模型对所有特征进行重要性排序,然后从高到低依次加入特征重新训练模型,以分类精度达到最佳时的特征集合为优选特征集合,最后以4类特征进行排列组合得到15种特征组合。
2.2 RF分类方法
RF分类方法属于一种集成学习,它是由多棵决策树组成,不同树之间没有关联,当RF进行决策时会将多数决策树的判断结果作为最终的输出。构造RF一般包括4个步骤: 首先确定决策树的数量T,然后从原始样本(样本总数为N)中有放回地随机选择n个样本为每个决策树构建训练集; 假设样本属性总数为M,在决策树的节点分裂时,随机选择m个属性(m≤M)并从中选择1个属性作为该节点的分裂属性; 在决策树形成的过程中,不断重复第二步来进行分裂,直到不能分裂为止; 重复以上步骤,完成所有决策树的构建,形成最终的RF模型。根据上述RF的构成可知决策树的数量T和树节点预选属性个数m是2个重要参数。本研究中T取值为常用的200,m取值为属性数量的均方根。RF在处理高维数据时具有优势,其在样本和属性上的随机策略可以减少预测误差并降低样本中噪声的影响。另外,RF在进行预测时还能产生特征重要性排序。这些优势使得它成为遥感制图领域应用最广的机器学习模型之一[29-30]。
2.3 精度评估方法
本研究采用混淆矩阵、总体精度、Kappa系数、制图精度和用户精度来综合评价红树林分类结果。混淆矩阵可以准确反映每类样本分类状况,它通过预测类型和真实类型的二维矩阵反映作物正确分类和误分的情况。
总体精度(overall accuracy,OA)表示每个样本的预测类型与真实类型一致的概率,其计算公式为:
式中: N为样本总数; c为类别总数; Pkk为Pij的特殊形式,前者表示真实类别k正确预测的样本数,后者为将真实类别i预测为j的样本数量。
用户精度UA是从分类结果中任取一个样本,其预测结果与实际类型一致的概率,计算公式为:
制图精度PA是相对于真实数据中的任意一个随机样本,分类图上同一地点的分类结果与其相一致的条件概率,计算公式为:
Kappa系数是用于一致性检验的指标,公式为:
3 结果与分析
3.1 特征优选与分析
通过RF模型对提取的56个特征进行重要性排序,然后按照重要性从大到小依次加入到新的特征集,重新训练模型来分析模型精度与特征个数的关系(图2)。可以看出,模型分类精度先随特征数量增加而上升,后面逐渐稳定,当特征数为40时取得最大精度(即图中红色节点),OA为92.25%。
图2
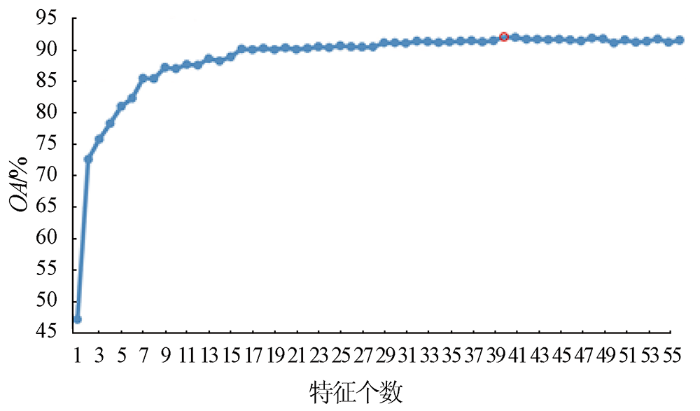
图2
分类精度与特征数量的关系
Fig.2
Relationship between classification accuracy and number of features
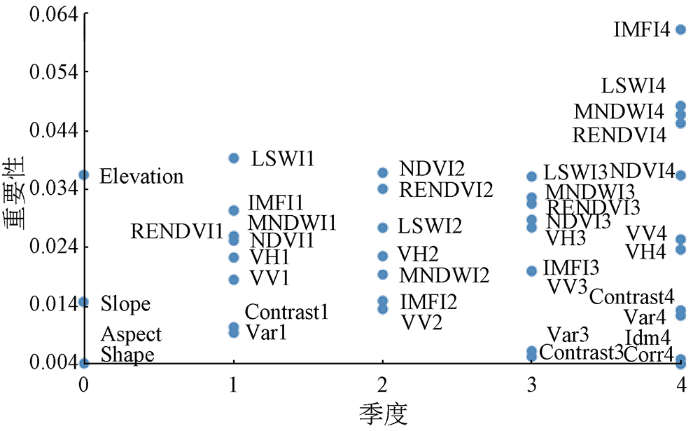
以前40个重要特征为优选特征进行时序分析(图3),其中季度为0表示非时序特征。结果显示相同类型的特征在第四季度的重要性大都高于其他季度,而其他季度的特征重要性差异并不明显。这种重要性分布规律主要是因为第四季度是一般植物的休眠期(如互花米草和碱蓬等),而红树林是常绿植物,因此在第四季度红树林的可分性会更高。从特征类型来看,光学特征的重要性明显高于散射特征,纹理特征的重要性最弱,地形特征中的高程信息对红树林分类具有重要作用,而坡向和阴影的重要性不高。这主要是因为光学特征中的植被指数可以有效分离水体和不透水面,同时指示不同类型植被的水分和叶绿素含量,相对于散射和纹理信息,可以提供更重要的分离信息。地形中高程信息可以指示植被的生长环境,减少高程较高的植被对红树林分类的影响。
图3
本研究依据特征的类型进行排列组合,最终构建15种特征组合,包括地形特征(组合1),纹理特征(组合2),散射特征(组合3),光谱特征(组合4),纹理特征+地形特征(组合5),纹理特征+散射特征(组合6),散射特征+地形特征(组合7),光谱特征+纹理特征(组合8),光谱特征+地形特征(组合9),光谱特征+散射特征(组合10),纹理特征+散射特征+地形特征(组合11),光谱特征+纹理特征+散射特征(组合12),光谱特征+纹理特征+地形特征(组合13),光谱特征+散射特征+地形特征(组合14),所有特征(组合15)。其中,组合1—4为单一类型特征,具体组成如表2所示,其他组合的具体特征由这4个组合加和形成。
表2 组合1—4的具体特征
Tab.2
| 组合序号 | 特征类型 | 具体特征 |
|---|---|---|
| 1 | 地形特征 | Elevation,Slope,Aspect,Shade |
| 2 | 纹理特征 | Contrast4,Var4,Contrast1,Var1,Var3,Contrast3,Idm4,Corr4 |
| 3 | 散射特征 | VH3,VV4,VH4,VH2,VH1,VV3,VV1,VV2 |
| 4 | 光谱特征 | IMFI4,MNDWI4,LSWI4,RENDVI4,LSWI1,NDVI2,NDVI4,LSWI3,RENDVI2,MNDWI3,RENDVI3,IMFI1,MNDWI1,NDVI3,LSWI2,RENDVI1,NVI1,IMFI3,MNDWI2,IMFI3 |
3.2 红树林分类精度分析
对每种特征组合,分别利用RF模型进行训练和测试,得到的分类精度结果如图4所示。总体来说,随着特征类型增加,模型精度逐渐提高,其中组合15的精度最高,OA为92.25%,Kappa系数为0.91。单一类型特征组合中,光谱特征组合的识别精度最高,OA和Kappa系数分别为88.56%和0.86,仅使用散射、地形或纹理特征无法取得有效识别精度,Kappa系数均低于0.6。2种类型特征组合中,光谱特征与其他特征的组合可以取得比单一光谱特征更高的识别精度,其中光谱特征与散射特征组合后的精度最高,OA为90.46%,Kappa系数为0.89。散射特征、地形特征和纹理特征两两组合后的识别精度也远大于单一特征组,说明更多特征信息有利于提升分类精度。3种类型的特征组合均可以取得较好识别精度(Kappa>0.75),其中组合14(光谱+散射+地形)的精度最高,而组合11(散射+地形+纹理)由于缺少关键的光谱特征,其精度表现最低,OA为80.25%,Kappa系数为0.763。
图4
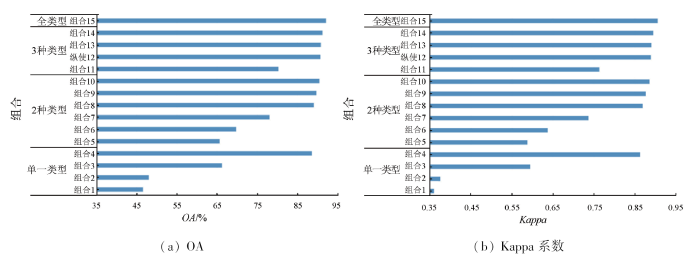
图4
不同特征组合的识别精度
Fig.4
Classification accuracy of different feature combinations
图5为不同特征组合的混淆矩阵,类别中0—5分别表示其他、红树林、农田、不透水面、其他植被和水体。单一特征类型中,组合1—3除水体外,剩余类别之间的混分现象都比较严重,其中红树林正确分类样本不足1/3。组合4中各个类别的分类精度都比较高,只有农田和其他植被之间存在较为严重的混分,其他植被更容易被误分为农田。2种特征类型中,组合5—7相对于其对应的单一类型特征组合,不同类别样本的正确分类数有明显提升。组合8—9是在组合4(光谱)基础上加入了其他类型特征,通过补充更多的信息,之前混分的农田样本有所减少。组合14是3种类型特征中的最佳组合,除了部分其他植被样本容易被分为农田外,剩余类别的识别精度都很高。组合15包含所有类型特征,也是精度最高的特征组合。与组合14相比,组合15增加了纹理特征,使得其他类型和不透水面的精度有所增加,不透水面的正确样本增加尤为明显。此外,组合15中红树林分类精度为0.95,是所有特征组合中最高的精度。此外,本研究选取了总精度较高的特征组合11—15,分别计算了它们的用户精度和制图精度(表3)。
图5

图5
不同特征组合在测试集上的混淆矩阵
Fig.5
Confusion matrix for different combinations of features on the testing dataset
表3 组合11—15的用户精度和制图精度
Tab.3
| 指标 | 类别 | 组合15 | 组合14 | 组合13 | 组合12 | 组合11 |
|---|---|---|---|---|---|---|
| 用户 精度 | 其他 | 91.19 | 89.34 | 89.26 | 88.16 | 76.28 |
| 红树林 | 95.86 | 95.53 | 96.73 | 94.84 | 86.23 | |
| 农田 | 85.17 | 83.52 | 81.58 | 83.24 | 78.25 | |
| 不透水面 | 95.10 | 94.67 | 92.82 | 94.74 | 78.49 | |
| 其他植被 | 90.70 | 89.91 | 89.68 | 88.76 | 78.21 | |
| 水体 | 96.45 | 95.45 | 96.75 | 95.76 | 83.30 | |
| 制图 精度 | 其他 | 91.19 | 89.62 | 91.51 | 88.99 | 74.84 |
| 红树林 | 95.25 | 94.62 | 93.67 | 93.04 | 91.14 | |
| 农田 | 94.82 | 93.52 | 93.20 | 93.20 | 83.82 | |
| 不透水面 | 96.77 | 93.84 | 94.72 | 95.01 | 79.18 | |
| 其他植被 | 84.10 | 83.83 | 81.94 | 83.02 | 70.62 | |
| 水体 | 92.52 | 92.86 | 91.16 | 92.18 | 84.01 |
从用户精度来看,组合15在红树林、农田、不透水面、其他植被和其他这5个类别的精度最高,组合13水体取得了最佳精度; 从制图精度来看,组合15在红树林、农田、不透水面和其他植被的精度最佳,组合14在水体的精度最好,组合13可以在其他类别取得最好的制图精度。总体来看,组合15无论是在用户精度还是制图精度都要优于其他组合,特别是红树林,在2种评价指标中均能达到最佳精度。
3.3 红树林制图分析
基于GEE平台,利用特征组合15和RF模型生成了覆盖整个广东省沿岸的红树林分布(图6),并统计了各个城市沿海内外10 km范围内的红树林面积。可以看出,广东省沿海的潮州、汕头、揭阳、汕尾、惠州、深圳、东莞、广州、中山、珠海、江门、阳江、茂名和湛江14座城市均有红树林的分布。从面积上看,广东省红树林总面积为150.40 km2,从北到南呈现递增趋势。其中,北部地区从潮州到惠州的红树林较少,中部地区的深圳、中山和珠海分布有一定的红树林,3个城市的红树林总计约41.78 km2,占广东省红树林总面积的27.78%,南部地区是红树林的集中带,江门、阳江和湛江的海岸带均有不少红树林分布,特别是湛江市,红树林面积达80.58 km2,占总面积的53.58%。
图6
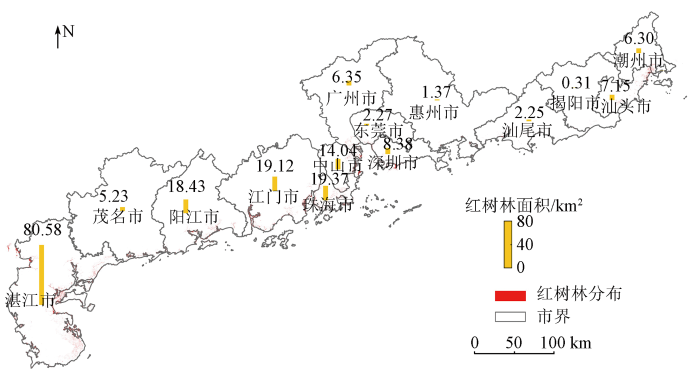
图6
广东省沿海城市红树林分布与统计
Fig.6
Mangrove distribution and statistics in coastal cities of Guangdong Province
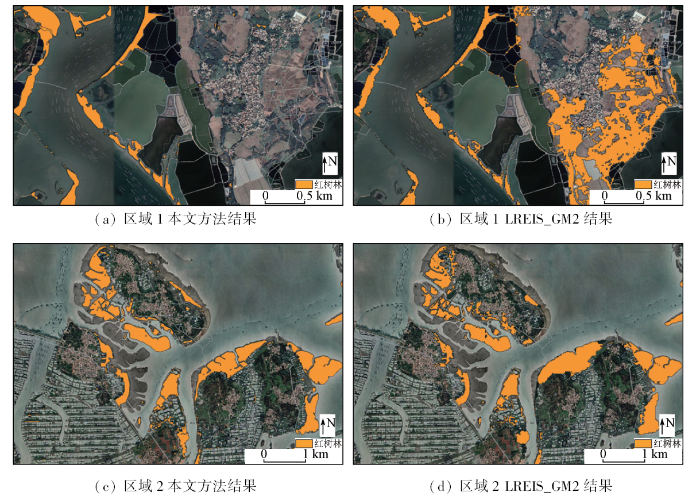
为了进一步评价红树林分布的可靠性,本研究选择红树林分布最集中的湛江市的2个区域进行分析,并和中科院公开发布的2020年红树林数据集(LREIS_GM2)进行对比(图7)。其中,区域1左上角为21°3'43″N, 110°11'57″E,右下角为21°2'22″N, 110°14'12″E; 区域2左上角为20°41'21″N, 110°19'52″E, 右下角为20°38'34″N, 110°24'21″E。需要注意的是,虽然本研究制作的是2021年红树林地图,LREIS_GM2为2020年,但选择的局部区域,从卫星影像看2 a间地物并没有明显变化。在图7中区域1中,本文方法结果(图7(a))可以正确识红树林和不透水面,而LREIS_GM2数据将很多不透水面错分为了红树林(图7(b))。图7中区域2主要是岛屿,本文方法结果可以将海岛边缘的红树林准确提取出来(图7(c)),而LREIS_GM2提取的红树林并不连贯(图7(d)),而且将岛屿内部的其他地物识别为了红树林。可见,本文方法结果要优于LREIS_GM2,主要原因可能是: 首先,本研究利用多源遥感数据的最优特征组合进行制图,有效的特征能更好提取红树林; 其次,本研究聚焦于广东省,而LREIS_ GM2的制图范围是全球,大范围的地理异质性也会影响模型的精度。
图7
4 结论
本研究充分利用多源遥感特征,设计了包含光谱、散射、纹理和地形4种类型的15种特征组合,通过对比分析得到红树林识别的最佳特征组合,利用GEE平台获取了高精度的广东省红树林分布,并取得了比已有红树林产品更好的精度。得到主要结论如下:
1)对多源特征进行重要性分析,发现4种特征类型中光谱特征最为重要,其次是散射、地形和纹理,另外,冬季的特征重要性普遍要比其他季节的特征高。
2)利用RF对特征依次建模,发现模型精度先随特征数量增加而上升,在第40个特征达到最佳精度,之后更多的特征并不会使得模型精度提升。
3)从优选的特征集合中设计了15种特征组合,对每种特征组合进行精度验证,结果显示类型越丰富的特征组合精度越高,包含全部4种类型的特征组合取得了最佳识别精度,总体精度为92.25%,Kappa系数为0.91。
4)通过与LREIS_GM2数据对比,本研究利用最优特征组合生成的红树林分布更为可靠。结果显示,2021年广东省沿岸红树林总面积为150.40 km2,红树林分布从北到南呈增多趋势,其中湛江市的红树林最多。
通过探究红树林制图中的最优特征组合,在多特征参数支持下实现了广东省红树林精确提取。本研究后续将验证最优特征组合在其他地区的普适性,同时开展算法设计工作,进一步提升红树林制图精度。
参考文献
Remote sensing of mangrove forest phenology and its environmental drivers
[J].DOI:10.1016/j.rse.2017.11.009 URL [本文引用: 1]
中国红树林湿地物种多样性及其形成
[J].
Species diversity in mangrove wetlands of China and its causation analyses
[J].
多源遥感影像红树林信息提取方法比较
[J].
Comparison of different metho-ds of mangrove extraction from multi-source remote sensing images
[J].
广东红树林资源的保护与开发
[J].
Protection and development of mangrove resources in Guangdong Province
[J].
Observation and monitoring of mangrove forests using remote sensing:Opportunities and challenges
[J].DOI:10.3390/rs8090783 URL [本文引用: 1]
Mapping of mangrove forest land cover change along the Kenya coastline using Landsat imagery
[J].DOI:10.1016/j.ocecoaman.2011.12.004 URL [本文引用: 1]
Estimating mangrove forest volume using terrestrial laser scanning and UAV-derived structure-from-motion
[J].
DOI:10.3390/drones3020032
URL
[本文引用: 1]

Mangroves provide a variety of ecosystem services, which can be related to their structuralcomplexity and ability to store carbon in the above ground biomass (AGB). Quantifying AGB inmangroves has traditionally been conducted using destructive, time-consuming, and costlymethods, however, Structure-from-Motion Multi-View Stereo (SfM-MVS) combined withunmanned aerial vehicle (UAV) imagery may provide an alternative. Here, we compared the abilityof SfM-MVS with terrestrial laser scanning (TLS) to capture forest structure and volume in threemangrove sites of differing stand age and species composition. We describe forest structure in termsof point density, while forest volume is estimated as a proxy for AGB using the surface differencingmethod. In general, SfM-MVS poorly captured mangrove forest structure, but was efficient incapturing the canopy height for volume estimations. The differences in volume estimations betweenTLS and SfM-MVS were higher in the juvenile age site (42.95%) than the mixed (28.23%) or mature(12.72%) age sites, with a higher stem density affecting point capture in both methods. These resultscan be used to inform non-destructive, cost-effective, and timely assessments of forest structure orAGB in mangroves in the future.
无人机遥感与XGBoost的红树林物种分类
[J].
Mangrove species classification with UAV-based remote sensing data and XGBoost
[J].DOI:10.11834/jrs.20210281 URL [本文引用: 1]
基于Google Earth Engine的1986—2018 年广东红树林年际变化遥感分析
[J].
DOI:10.13284/j.cnki.rddl.003268
[本文引用: 1]
以广东沿海红树林为研究对象,结合谷歌地球引擎(GEE)云计算平台,以1986—2018年32期3 359景Landsat系列卫星遥感影像为数据源,采用随机森林(RF)方法提取1986—2018年广东省红树林面积,比较全省沿海城市红树林年际时空变化特征,并从景观斑块角度分析广东省红树林斑块演变特征。结果表明:1)1986—2018年红树林遥感分类总体精度均高于90%,广东省沿岸红树林面积总体呈先减少后增加的趋势,且其在2014年后变化幅度逐渐减小。2)从各沿海城市来看,红树林共分布在14个市内,其中湛江和阳江是红树林面积分布最大的2个城市;各市红树林面积变化可分为先减后增、波动增加和无明显变化3类。3)1986—2018年广东省红树林斑块数量总体呈减少趋势,但斑块平均面积(MPS)呈上升趋势,红树林破碎化程度减轻。获取年际红树林面积分布信息和空间结构变化趋势,可为红树林合理开发与保护提供数据和参考,服务于红树林生态恢复和精细化管理。
Analysis of mangrove annual changes in Guangdong Province during 1986—2018 based on Google Earth Engine
[J].
A new vegetation index to detect periodically submerged mangrove forest using single-tide Sentinel-2 imagery
[J].
DOI:10.3390/rs11172043
URL
[本文引用: 2]
Mangrove forests are tropical trees and shrubs that grow in sheltered intertidal zones. Accurate mapping of mangrove forests is a great challenge for remote sensing because mangroves are periodically submerged by tidal floods. Traditionally, multi-tides images were needed to remove the influence of water; however, such images are often unavailable due to rainy climates and uncertain local tidal conditions. Therefore, extracting mangrove forests from a single-tide imagery is of great importance. In this study, reflectance of red-edge bands in Sentinel-2 imagery were utilized to establish a new vegetation index that is sensitive to submerged mangrove forests. Specifically, red and short-wave near infrared bands were used to build a linear baseline; the average reflectance value of four red-edge bands above the baseline is defined as the Mangrove Forest Index (MFI). To evaluate MFI, capabilities of detecting mangrove forests were quantitatively assessed between MFI and four widely used vegetation indices (VIs). Additionally, the practical roles of MFI were validated by applying it to three mangrove forest sites globally. Results showed that: (1) theoretically, Jensen–Shannon divergence demonstrated that a submerged mangrove forest and water pixels have the largest distance in MFI compared to other VIs. In addition, the boxplot showed that all submerged mangrove forests could be separated from the water background in the MFI image. Furthermore, in the MFI image, to separate mangrove forests and water, the threshold is a constant that is equal to zero. (2) Practically, after applying the MFI to three global sites, 99–102% of submerged mangrove forests were successfully extracted by MFI. Although there are still some uncertainties and limitations, the MFI offers great benefits in accurately mapping mangrove forests as well as other coastal and aquatic vegetation worldwide.
Mapping China’s mangroves based on an object-oriented classification of Landsat imagery
[J].DOI:10.1007/s13157-013-0449-2 URL [本文引用: 1]
Change detection of mangrove forests in coastal Guangdong during the past three decades based on remote sensing data
[J].
DOI:10.3390/rs11080921
URL
[本文引用: 2]
Mangrove forests are among the most productive ecosystems on Earth and mainly grow at tropical and subtropical latitudes. They provide many important ecological and societal functions. However, rapid spatiotemporal variations in mangroves have been observed worldwide, especially in the coastal zones of developing areas, and the integrity of mangroves has been significantly affected by anthropogenic activities in recent decades. The goal of this study was to determine the spatiotemporal characteristics of mangrove distribution over the past 30 years in Guangdong Province. This goal was achieved by classifying multi-temporal Landsat images using a decision tree method based on Classification and Regression Tree (CART) algorithm. The driving forces resulting in these spatiotemporal variations of mangroves were then discussed. Our analysis revealed that the classification method used in this study yielded good accuracy, with an overall accuracy and kappa coefficient of higher than 90% and 0.8, respectively. In Guangdong province, the mangrove forests covered areas of 9305, 9556, 6793, and 9700 ha in 1985, 1995, 2005, and 2015, respectively, with remarkable inter-annual changes. Mangrove forests are mainly located in Western Guangdong, and few are located in Eastern Guangdong. The distribution of mangrove patches became more fragmented from 1985 to 2005 and less fragmented from 2005 to 2015, and the distribution pattern in 2015 showed stronger connectivity than that in 1985. Natural factors, such as temperature, sea level rise, extreme weather events, and the length of the coastline, have macroscopic effects on the distribution of mangrove forests. Anthropogenic activities, such as deforestation, urbanization, and aquaculture development, have negative effects on the distribution of mangroves. On the other hand, the establishment of nature reserves has positive effects on the distribution of mangroves. The findings of this study provide a reference for the management and protection of mangroves, which is of great practical significance.
10-m global mangrove classification products of 2018—2020[DS/OL]
机载LiDAR在红树林林分平均高估算中的应用
[J].
Application of airborne LiDAR in the estimation of the mean height of mangrove stand
[J].
Google Earth Engine:Planetary-scale geospatial analysis for everyone
[J].DOI:10.1016/j.rse.2017.06.031 URL [本文引用: 1]
10-m-resolution mangrove maps of China derived from multi-source and multi-temporal satellite observations
[J].DOI:10.1016/j.isprsjprs.2020.10.001 URL [本文引用: 1]
Virtual increase or latent loss? A reassessment of mangrove populations and their conservation in Guangdong,southern China
[J].DOI:10.1016/j.marpolbul.2016.06.083 URL [本文引用: 1]
广东省红树林资源变化遥感监测
[J].
Remote sensing monitoring of the mangrove forests resources of Guangdong Province
[J].
海岸带地类统计模型中DEM空间尺度优选方法
[J].
An optimization method of DEM resolution for land type statistical model of coastal zones
[J].
The shuttle Radar topography mission
[J].
Red and photographic infrared linear combinations for monitoring vegetation
[J].DOI:10.1016/0034-4257(79)90013-0 URL [本文引用: 1]
Mapping paddy rice agriculture in southern China using multi-temporal MODIS images
[J].DOI:10.1016/j.rse.2004.12.009 URL [本文引用: 1]
Modification of normalised difference water index (NDWI) to enhance open water features in remotely sensed imagery
[J].DOI:10.1080/01431160600589179 URL [本文引用: 1]
Evaluating the effectiveness of using vegetation indices based on red-edge reflectance from Sentinel-2 to estimate gross primary productivity
[J].
DOI:10.3390/rs11111303
URL
[本文引用: 1]
Gross primary productivity (GPP) is the most important component of terrestrial carbon flux. Red-edge (680–780 nm) reflectance is sensitive to leaf chlorophyll content, which is directly correlated with photosynthesis as the pigment pool, and it has the potential to improve GPP estimation. The European Space Agency (ESA) Sentinel-2A and B satellites provide red-edge bands at 20-m spatial resolution on a five-day revisit period, which can be used for global estimation of GPP. Previous studies focused mostly on improving cropland GPP estimation using red-edge bands. In this study, we firstly evaluated the relationship between eight vegetation indices (VIs) retrieved from Sentinel-2 imagery in association with incident photosynthetic active radiation (PARin) and carbon flux tower GPP (GPPEC) across three forest and two grassland sites in Australia. We derived a time series of five red-edge VIs and three non-red-edge VIs over the CO2 flux tower footprints at 16-day time intervals and compared both temporal and spatial variations. The results showed that the relationship between the red-edge index (CIr, ρ 783 ρ 705 − 1 ) multiplied by PARin and GPPEC had the highest correlation (R2 = 0.77, root-mean-square error (RMSE) = 0.81 gC∙m−2∙day−1) at the two grassland sites. The CIr also showed consistency (rRMSE defined as RMSE/mean GPP, lower than 0.25) across forest and grassland sites. The high spatial resolution of the Sentinel-2 data provided more detailed information to adequately characterize the GPP variance at spatially heterogeneous areas. The high revisit period of Sentinel-2 exhibited temporal variance in GPP at the grassland sites; however, at forest sites, the flux-tower-based GPP variance could not be fully tracked by the limited satellite images. These results suggest that the high-spatial-resolution red-edge index from Sentinel-2 can improve large-scale spatio-temporal GPP assessments.
Google Earth Engine支持下的江苏省夏收作物遥感提取
[J].
DOI:10.12082/dqxxkx.2019.180420
[本文引用: 1]
江苏省是农作物种植大省,国家统计局统计数据显示,江苏省近10年冬小麦、冬油菜的总播种面积分列全国第五、第七,快速准确地获取冬小麦和冬油菜的空间分布对于该省的农业发展具有重意义。基于单机的传统遥感分类能够准确获取农作物的空间分布信息,但是耗时较长。随着地理大数据与云平台、云计算的发展,Google Earth Engine(GEE)作为一个基于云平台的全球尺度地理空间分析平台,为快速遥感分类带来了新的机遇。本文基于GEE,使用Sentinel-2数据快速提取了江苏省2017年冬小麦与冬油菜的空间分布。首先,利用GEE获得覆盖江苏省119景无云质优的Sentinel-2影像;其次,在此基础上分别计算了遥感指数、纹理特征、地形特征,并完成原始特征的构建与优化;最后,分别试验了朴素贝叶斯、支持向量机、分类回归树和随机森林4种分类器,比较了各分类器的分类精度,并提取了冬小麦与冬油菜的空间分布信息。得出以下结论:①GEE能够快速完成覆盖江苏省影像数据的去云、镶嵌、裁剪及特征构建等预处理,较本地处理具有明显优势;②J-M距离值位于前两位且大于1将特征数量从28个压缩到11个,有效压缩了原始特征空间;③光谱+纹理+地形特征组合训练,朴素贝叶斯、支持向量机、分类回归树、随机森林的平均验证精度分别为61%、87%、89%、92%。
Extraction of summer crop in Jiangsu based on Google Earth Engine
[J].
A hybrid data balancing method for classification of imbalanced training data within Google Earth Engine:Case studies from mountainous regions
[J].
DOI:10.3390/rs12203301
URL
[本文引用: 1]
Distribution of Land Cover (LC) classes is mostly imbalanced with some majority LC classes dominating against minority classes in mountainous areas. Although standard Machine Learning (ML) classifiers can achieve high accuracies for majority classes, they largely fail to provide reasonable accuracies for minority classes. This is mainly due to the class imbalance problem. In this study, a hybrid data balancing method, called the Partial Random Over-Sampling and Random Under-Sampling (PROSRUS), was proposed to resolve the class imbalance issue. Unlike most data balancing techniques which seek to fully balance datasets, PROSRUS uses a partial balancing approach with hundreds of fractions for majority and minority classes to balance datasets. For this, time-series of Landsat-8 and SRTM topographic data along with various spectral indices and topographic data were used over three mountainous sites within the Google Earth Engine (GEE) cloud platform. It was observed that PROSRUS had better performance than several other balancing methods and increased the accuracy of minority classes without a reduction in overall classification accuracy. Furthermore, adopting complementary information, particularly topographic data, considerably increased the accuracy of minority classes in mountainous areas. Finally, the obtained results from PROSRUS indicated that every imbalanced dataset requires a specific fraction(s) for addressing the class imbalance problem, because different datasets contain various characteristics.
Improved land cover map of Iran using Sentinel imagery within Google Earth Engine and a novel automatic workflow for land cover classification using migrated training samples
[J].DOI:10.1016/j.isprsjprs.2020.07.013 URL [本文引用: 1]
In-season crop mapping with GF-1/WFV data by combining object-based image analysis and random forest
[J].DOI:10.3390/rs9111184 URL [本文引用: 1]
Random forest classification of salt marsh vegetation habitats using quad-polarimetric airborne SAR,elevation and optical RS data
[J].DOI:10.1016/j.rse.2014.04.010 URL [本文引用: 1]
