

0 引言
地表温度(land surface temperature,LST)作为研究驱动地表与大气之间能量交换的关键参数[1],对全球气候变化、蒸散发、环境监测、水资源管理和地热异常勘探等有重要意义[2⇓⇓-5]。随着热红外遥感的发展,国内外学者基于卫星热红外数据开展了较多的研究,并提出了不同的LST反演算法,如辐射传输方程法[6]、单通道算法[7]、劈窗算法[8]、多波段算法[9]等方法。由于对地物热辐射信息敏感,Landsat卫星的热红外波段被广泛的应用于LST变化的监测中,例如,Maulana等[10]利用Landsat8 OLI/TIRS图像和GEE(Google Earth Engine)处理LST的时间序列数据,进行LST的有效监测,泗水市的平均LST在2016年之后不断上升,热舒适性越来越差; Kimothi等[11]利用Landsat TM传感器数据和MDFA(multifractal detrended fluctuation analysis)对喜马拉雅山脉的LST进行时空分析,表明城市化加剧了热岛效应的影响。Galve等[12]使用单通道算法和分裂窗法对陆地卫星数据进行温度反演,对高对比度半干旱农业生态系统的地表温度做出估计评估; Bradtke[13]通过Landsat8的热红外传感器采集数据,使用IdePix算法进行分析处理,得到波罗的海高分辨率海面温度图。现有研究为地表温度反演提供了技术支撑,但多针对平坦地表,对于地形复杂的地表如山区研究较少。研究表明,地表温度与下垫面指数有关,常用的下垫面指数包含归一化建筑指数(normalized difference built-up index,NDBI)、归一化植被指数(normalized differential vegetation index,NDVI)和归一化水汽指数(normalized difference moisture index,NDMI)等。Guha等[14]利用1988—2019年陆地卫星数据,经过线性检验得到了地表温度与NDVI呈负相关,与NDBI呈正相关的结论; Mallick等[15]验证了NDMI与地表温度的相关性,得到了二者之间呈负相关的结论,并提出可以利用NDMI对地表温度进行预测。此外,地表温度还与土地覆盖类型有关。Rehman等[16]对比了30 a间研究区内各类土地覆盖物的面积变化及各类地物所对应的地表温度状况,得到了建成区地表温度显著大于其他区域的结果; 钱乐祥等[17]计算了研究区土地覆盖类型的地表温度平均值,发现城市、建筑用地温度相对较高,而耕地、水体、森林等相对较低。同时,地表温度还受地形变化等影响,尤其在地形复杂区。SimÓ等[18]使用Landsat和MODIS数据进行复杂地形的地表温度反演,并与真实值进行比较,得到巴利阿里群岛大学更详细的地表温度测量方法; Peng等[19]结合高程、坡度、坡向与阴影地貌等因素,得出地表温度与高程、坡度呈负相关,与坡向关系不显著,与阴影地貌呈显著的线性相关的结论; 赵伟等[20]进一步提出了随坡度向南,地表温度逐渐上升的变化趋势,并从3个因素方面分别论证了冬季地表温度受地形因子的影响更加敏感。因此,对于地形复杂区域地表温度的定量化分析,应该综合考虑不同的下垫面参数、土地覆被以及地形因子等。
延河流域位于黄土高原地区,是黄土丘壑区的典型流域,该区地形复杂,水土流失严重。由于易侵蚀性和区域干旱缺水的特点,同时加上气候变化和人类活动的影响,该地区是全球气候变化响应的敏感区域之一[21]。为准确获取该区的地表温度,本研究以Landsat8为遥感数据源,利用大气校正法反演地表温度,提取影像NDBI,NDVI和NDMI指数,分析地表温度时空变化特征及其与地表参数、土地利用类型以及地形参数的关系,准确刻画该区的地表温度,从而为地形复杂区的地表水热环境研究提供支持。
1 研究区概况及数据源
1.1 研究区概况
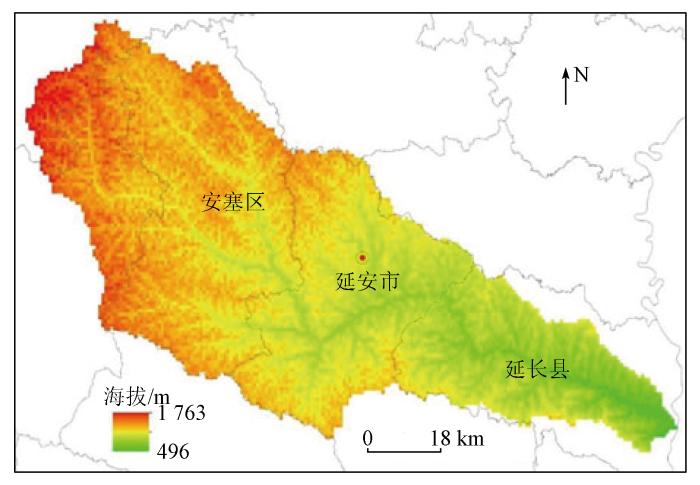
图1
1.2 数据来源及预处理
1.2.1 数据来源
研究数据包括遥感数据、土地利用数据以及研究区矢量数据。本研究选取2015年、2018年、2020年的Landsat8 OLI/TIRS影像作为研究基础影像源,时相分别为2015-07-01、2018-05-22和2020-05-11,影像均来源于地理空间数据云平台(
1.2.2 数据预处理
借助ENVI5.6软件对下载的遥感影像进行辐射定标、大气校正、图像镶嵌等预处理,通过延河流域矢量边界进行裁剪,从而得到研究范围。温度反演数据为NetCDF格式,通过ArcGIS10.8软件进行数据格式转换、裁剪以及栅格计算,得到研究区验证数据。由于土地利用类型众多,根据研究需要将其分类并重新编码,分别为耕地、林地、草地、水体、建设用地5个土地利用类型。
2 研究方法
2.1 大气校正法
式中:
然后通过普朗克函数[26]得到地表温度反演公式,即
式中:
2.2 均值-标准差法温度分级
表1 温度等级划分依据
Tab.1
| 等级 | 划分依据① |
|---|---|
| 高温区 | |
| 次高温区 | |
| 中温区 | |
| 次中温区 | |
| 低温区 |
①:
2.3 温度空间转移矩阵方法
系统分析中对系统状态与状态转移的定量描述叫作空间转移矩阵[29]。通过转移矩阵变化,对延河流域LST变化进行度量分析,清晰表达LST的格局变化趋势。温度转移矩阵的数字形式表述为:
式中: S为研究区面积;
2.4 LST相关参数获取
2.4.1 下垫面指数提取
下垫面主要包括土壤、植被和河流等,它们显著影响着地形、气候和季风等与LST相关的因素[30]。本文通过提取不同的下垫面指数来反映不同时空下LST的变化情况。
式中:
2)NDVI是由地物光谱信息推算得出的反映地表植被状况的参数[32],能够反映植被覆盖程度及其生长状况,其值越大表明植被覆盖度越高。NDVI的计算公式为:
式中
3)NDMI指数是依据短波红外与近红外波段反射率之间的差异来反映地物水汽含量的,因为这2个波段的差异主要是由于吸收水分所造成的[33]。NDMI的计算公式为:
2.4.2 地理环境因子提取
由于研究区地形复杂,起伏较大,因此考虑地理环境因子对地表温度的影响。利用DEM数据,从海拔、坡度、坡向3个方面定量分析地表温度的时空分布和变化特征。通过使用ArcGIS软件对DEM数据进行表面分析,再通过重分类、色彩渲染、制图输出得到海拔、坡度、坡向图,并根据研究区地形特征,对地形因子进行等级划分。海拔按绝对高度划分为[495,1 000) m、[1 000~1 250) m、[1 250~1 500) m、[1 500~1 795) m共4个等级; 坡度划分为平坡[0,5)°、缓坡[5~15)°、斜坡[15~25)°、陡坡[25~35)°和急坡[35~90)°共5个等级; 坡向划分为平缓坡(0°)、阴坡([337.5,360)°和[0,67.5)°)、半阴坡([67.5~112.5)°和[292.5~337.5)°)、阳坡([157.5~247.5°)、半阳坡([112.5~157.5)°和[247.5~292.5)°)。
2.5 LST与下垫面指数数据处理
对LST与各下垫面指数进行相关分析之前,首先进行数据的提取和预处理。利用ENVI软件去除指数计算中的异常值,并对其进行归一化处理,计算公式为:
式中:
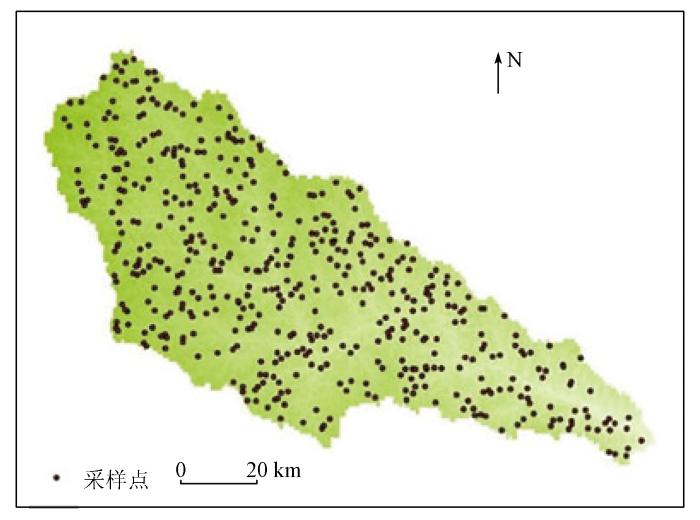
利用ArcMap软件导入归一化处理后的各下垫面指数与反演得到的LST数据,在影像范围内生成500个随机点(图2),提取各年份的NDBI,NDVI,NDMI指数和LST值。利用SPSS软件对属性表信息进行分析,研究其协同关系。
图2
3 结果与分析
3.1 LST反演结果与分析
LST反演结果显示,延河流域2015年7月1日平均地表温度为35.14 ℃,2018年5月22日平均地表温度为20.45 ℃,2015年7月1日LST标准差最大,达3.12 ℃(表2)。虽然选取的遥感影像为晴天且无云,质量较好,但LST的大小会受如植被、土壤、下垫面性质等影响,导致影像误差产生,因此2018年温度反演的值较2015年和2020年偏低。
表2 2015—2020年延河流域温度变化
Tab.2
| 日期 | 最小值 | 最大值 | 平均值 | 标准差 |
|---|---|---|---|---|
| 2015-07-01 | 24.80 | 45.61 | 35.14 | 3.12 |
| 2018-05-22 | 17.05 | 26.85 | 20.45 | 1.52 |
| 2020-05-11 | 18.23 | 34.27 | 26.51 | 3.06 |
采用LST产品对反演LST进行精度验证,首先将Landsat数据重采样至与反演数据空间分辨率一致,然后对Landsat数据与验证数据进行配准,随机生成500个有效点,分别提取LST数据并进行相关性分析,结果显示,2015年相关系数达0.569,2018年相关系数达0.675,2020年相关系数达0.632,相关系数均大于0.5,较好地满足了研究需要。因此采用大气校正法反演LST具有可行性。
从延河流域温度等级分布可以看出(图3),总体温度呈现西北高、东南低的现象。这也与当地植被带一一对应,从黄土高原腹地的沙化干草原到森林草原带、再到森林灌木、乔木带,LST逐渐降低。此外,对于此区域的城市有较高的LST,这与城市的下垫面、人类聚集、气候等因素有关。
图3
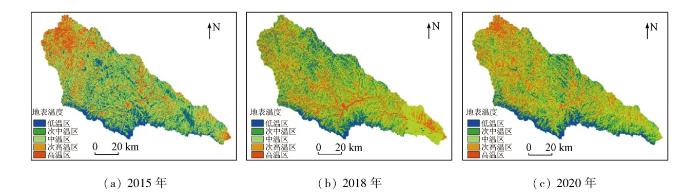
图3
不同年份延河流域温度等级分布
Fig.3
Temperature grade distribution in Yanhe River Basin in different years
3.2 LST时空变化特征
2015年、2018年、2020年这3 a的温度等级空间转移情况可分为2015—2018和2018—2020年2个阶段。由温度转移矩阵表3、表4可知,2015—2018年,低温区面积总体呈现减少,共减少2 240.19 hm2,主要是次中温区和中温区的面积转出较大; 次中温区面积减小9 132.12 hm2,为低温区减少面积的4倍多,面积转出主要是次高温区和中温区; 中温区面积由2015年的284 729.49 hm2增加到2018年的297 531.09 hm2,总面积增加12 801.6 hm2; 次高温区面积增加5 597.01 hm2,从中温区转入至次高温区面积最多,达9 508.14 hm2; 高温区面积减少7 026.63 hm2。2018—2020年,低温区面积有所减少,主要是中温区和次高温区的转入面积较少; 次中温区面积总体略有增加,共增加689.58 hm2,主要是中温区的转入面积较大,净转入7 516.98 hm2; 中温区面积变化最大,为面积减少最多的热场区域,共减少9 769.77 hm2,主要是次中温区转出面积较大; 次高温区和高温区面积总有所增加,次高温区面积增加3 637.08 hm2,高温区面积增加7 391.97 hm2。从2015—2020年总体上来看,低温区、次中温区、次高温区面积有所减少,中温区面积增加较大,高温区面积略有增加。究其原因,一方面,随着水土保持工程力度加大,热环境变暖速度有所降低; 另一方面,随着城市的进一步建设与不合理的种植林地等因素的产生,导致部分地区热环境不减反增,对热环境带来一定的不良影响。
表3 2015—2018年温度转移矩阵
Tab.3
| 2018年 2015年 | 低温区 | 次中温区 | 中温区 | 次高温区 | 高温区 | 总计 |
|---|---|---|---|---|---|---|
| 低温区 | 70 525.80 | 28 347.93 | 26 502.39 | 1 450.08 | 524.88 | 127 351.08 |
| 次中温区 | 25 225.74 | 31 915.98 | 55 129.95 | 5 688.27 | 1 629.54 | 119 589.48 |
| 中温区 | 24 373.44 | 38 485.35 | 144 142.47 | 50 651.64 | 27 076.60 | 284 729.49 |
| 次高温区 | 3 529.08 | 7 680.42 | 41 143.50 | 29 623.86 | 29 656.80 | 111 633.66 |
| 高温区 | 1 456.83 | 4 027.68 | 30 612.78 | 29 816.82 | 58 754.50 | 124 668.63 |
| 总计 | 125 110.89 | 110 457.36 | 297 531.09 | 117 230.67 | 117 642.32 | 767 972.34 |
表4 2018—2020年温度转移矩阵
Tab.4
| 2020年 2018年 | 低温区 | 次中温区 | 中温区 | 次高温区 | 高温区 | 总计 |
|---|---|---|---|---|---|---|
| 低温区 | 78 520.59 | 25 666.65 | 19 162.17 | 1 434.60 | 326.88 | 125 110.89 |
| 次中温区 | 27 076.41 | 35 266.68 | 41 553.27 | 5 112.90 | 1 448.19 | 110 457.45 |
| 中温区 | 17 520.75 | 49 070.25 | 164 683.71 | 44 563.14 | 21 693.24 | 297 531.09 |
| 次高温区 | 27.63 | 1 087.47 | 47 982.33 | 38 024.91 | 30 108.33 | 117 230.67 |
| 高温区 | 16.65 | 55.98 | 14 379.84 | 3 1732.20 | 71 457.66 | 117 642.33 |
| 总计 | 123 162.03 | 111 147.03 | 287 761.32 | 120 867.75 | 125 034.30 | 767 972.43 |
3.3 LST与土地覆盖类型变化分析
通过使用空间分析方法,将2015年、2018年、2020年土地利用遥感分类数据与Landsat地表温度反演数据在ArcGIS中进行分区统计和面积量算,得到各年份土地类型的面积与在温度分级下各土地类型占该土地类型总面积的比重,该比重用
分区LST数值用
评价得分如表5所示。虽然各年份各土地类型的分数略有差异,但从总体来看,延河流域2015—2020年3期各下垫面覆盖类型的LST均呈现为水域<林地<草地<耕地<建设用地的特征。因此,通过合理增加水域和林地面积,可有效降低研究区LST,从而减少干旱天气的发生。
表5 各土地类型在不同年份的温度评分情况
Tab.5
| 土地利用类型 | 2015年 | 2018年 | 2020年 |
|---|---|---|---|
| 耕地 | 2.497 67 | 2.652 77 | 2.602 38 |
| 林地 | 4.507 34 | 3.775 78 | 4.213 32 |
| 草地 | 2.809 73 | 2.622 07 | 2.857 82 |
| 水域 | 4.884 62 | 3.763 21 | 4.234 66 |
| 建设用地 | 2.215 39 | 1.542 80 | 2.026 44 |
3.4 LST与地表参数定量分析
3.4.1 LST与地表参数的回归分析
使用ArcGIS10.8软件随机生成500个样本点,提取各样本点的NDBI,NDMI,NDVI和LST,通过转换工具将点值数据转换为Excel数据,使用SPSS软件进行回归分析,通过对比、实验和验证,获得最佳拟合方程和定量关系,如表6所示。从回归方程可以看出,LST与NDBI呈现正向增长关系,而NDVI,NDMI与LST呈负相关。以2015年为例,NDBI每上升0.1,将产生2.37~5.78 ℃的LST作用; NDMI每增加0.1,LST下降3.4 ℃; NDVI每增加0.1,LST下降2.4 ℃。NDBI与LST呈指数关系,建筑物越多越密集,LST升温越快。
表6 NDBI,NDMI,NDVI与LST的定量关系
Tab.6
| 年份 | 回归分析① | ||
|---|---|---|---|
| 2015年 | |||
| 2018年 | |||
| 2020年 | |||
①所有回归方程均通过1%显著性检验。
3.4.2 地表参数分布的时空特征
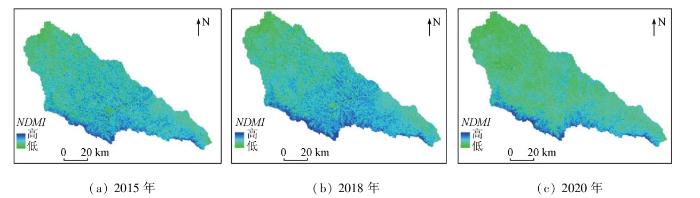
通过在ENVI软件中对预处理过的影像进行相关波段运算,之后对数据进行正向化、归一化处理。通过ArcGIS软件进行专题制图表达,得到2015—2020年NDBI,NDVI和NDMI结果如图4—6所示。2015—2020年,通过NDBI发现建筑物覆盖度有所上升,这与城市扩张、工业生产、居民住房条件改善等因素有关。分析NDVI发现,整体植被覆盖度呈现中等偏下水平,在延安市区植被覆盖度明显较低,林地类型有较高的植被指数。NDMI总体呈现西北低、东南高的空间分布格局,2015年为3 a中NDMI最高的年份。由于气候变化以及不合理的退耕还林等因素,从时间序列上看,NDMI呈现下降趋势。此外,由于遥感图像自身误差以及图像处理误差,导致部分地区指数表现明显,出现数值过高或过低现象。
图4
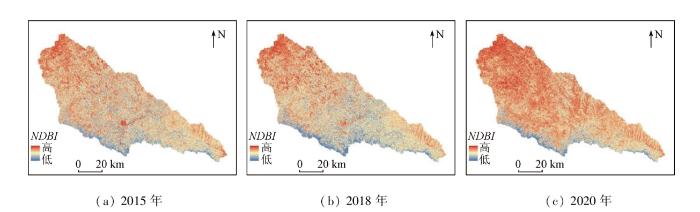
图5
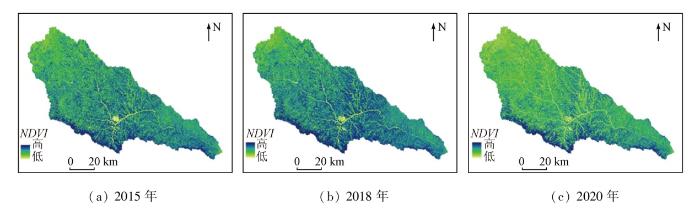
图6
3.4.3 地表温度与地理因素变化统计分析
使用ArcGIS10.8软件进行分区统计分析,得到2015年、2018年和2020年海拔、坡度、坡向与地表平均温度的分类统计值,如图7、表7—9所示。随着海拔升高,地表平均温度逐渐降低,与气温垂直递减规律相类似。延河流域海拔最高等级区与最低等级区地表平均温度相差0.86~1.47 ℃; 坡度对地表温度有一定影响,在2015年、2018年、2020年均呈现为平坡地表平均温度最高,急坡地表平均温度最低,随着坡度的升高LST逐渐降低,这与太阳辐射等因素有关,坡度越缓,地表在正午接收的热量越高;对于不同的坡向,LST也呈现不同程度的差异。阳坡地表平均温度最高,半阳坡、平缓坡、半阴坡平均温度依次降低,阴坡平均温度最低。2015年阳坡与阴坡平均温度相差0.98℃,2018年相差1.07℃,2020年相差1.37℃,阴阳坡LST差异较大。
图7
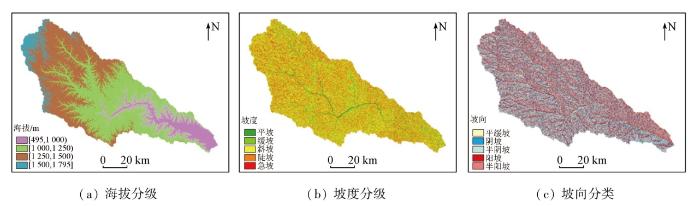
图7
延河流域地形因子分级分类图
Fig.7
Topographic factor classification map of Yanhe River Basin
表7 2015年LST与地形因素分类统计
Tab.7
| 海拔等级 | 坡度分级 | 坡向分类 | |||
|---|---|---|---|---|---|
| 高程/m | 平均 温度/℃ | 坡度 | 平均 温度/℃ | 坡向 | 平均 温度/℃ |
| [495,1 000) | 35.42 | 平坡 | 35.82 | 阳坡 | 35.71 |
| [1 000,1 250) | 35.03 | 缓坡 | 35.33 | 半阳坡 | 35.49 |
| [1 250,1 500) | 34.67 | 斜坡 | 35.28 | 平缓坡 | 35.26 |
| [1 500,1 795) | 34.56 | 陡坡 | 35.06 | 半阴坡 | 35.07 |
| 急坡 | 34.93 | 阴坡 | 34.73 | ||
表8 2018年LST与地形因素分类统计
Tab.8
| 海拔等级 | 坡度分级 | 坡向分类 | |||
|---|---|---|---|---|---|
| 高程/m | 平均 温度/℃ | 坡度 | 平均 温度/℃ | 坡向 | 平均 温度/℃ |
| [495,1 000) | 21.48 | 平坡 | 21.18 | 阳坡 | 21.23 |
| [1 000,1 250) | 20.55 | 缓坡 | 20.51 | 半阳坡 | 20.67 |
| [1 250,1 500) | 20.05 | 斜坡 | 20.43 | 平缓坡 | 20.52 |
| [1 500,1 795) | 20.01 | 陡坡 | 20.38 | 半阴坡 | 20.39 |
| 急坡 | 20.34 | 阴坡 | 20.16 | ||
表9 2020年LST与地形因素分类统计
Tab.9
| 海拔等级 | 坡度分级 | 坡向分类 | |||
|---|---|---|---|---|---|
| 高程/m | 平均 温度/℃ | 坡度 | 平均 温度/℃ | 坡向 | 平均 温度/℃ |
| [495,1 000) | 27.27 | 平坡 | 27.38 | 阳坡 | 27.22 |
| [1 000,1 250) | 26.88 | 缓坡 | 26.75 | 半阳坡 | 27.09 |
| [1 250,1 500) | 26.42 | 斜坡 | 26.54 | 平缓坡 | 26.72 |
| [1 500,1 795) | 26.29 | 陡坡 | 26.41 | 半阴坡 | 26.35 |
| 急坡 | 26.27 | 阴坡 | 25.85 | ||
4 结论与讨论
4.1 结论
本文以地处黄土高原的延河流域为例,选取了2015年、2018年、2020年Landsat8遥感影像,借助RS和GIS技术支持,利用大气校正法对LST进行了反演,并在此基础上提取了NDVI,NDBI和NDMI指数,运用空间转移矩阵分析了延河流域LST的空间变化状况,此外,综合土地利用类型进行综合评分,定量分析了不同土地利用类型对LST的影响,结论如下:
1)根据温度空间变异矩阵,2015—2020年,低温区、次中温区、次高温区面积有所减少,中温区面积增加较大,高温区面积略有增加。
2)分析不同土地覆盖类型地表温度变化,发现各下垫面覆盖类型的LST均呈现为水域<林地<草地<耕地<建设用地。水域和林地的面积增加有利于LST的降低,而建设用地的增加会造成LST的异常升高。
3)对地表参数进行定量分析,发现延河流域LST变化与地表参数变化存在显著相关性,NDBI与LST变化呈正相关性,为热环境效应的贡献面; NDVI和NDMI与LST变化呈负相关性,二者处于热环境效应的抑制面,且NDBI与LST关系呈指数型,建筑物越密集对LST影响越大。
4)对地形因素进行分析,发现随着海拔的升高,LST逐渐降低,与气温随海拔的变化趋势一致; 坡度越大,LST越低,到达地面的热量越少; 不同坡向LST有差异,其中阴坡与阳坡LST差异最大,阳坡LST显著高于阴坡LST。
4.2 讨论
地形复杂区LST,不仅受宏观尺度上的纬度、海陆位置、大气环流等因素的影响,还受土地利用类型、植被、地形、建筑指数等因素的影响。因此,综合考虑不同的下垫面参数、土地覆被以及地形因子,是地形复杂区域地表温度的定量化分析的研究趋势。同时,根据下垫面指数与土地利用结构来看,林地与水域对异常高温起到重要的抑制作用,而建筑用地对高温具有正向促进作用。研究区处于半干旱气候区,夏季高温多雷阵雨,冬季寒冷干燥,水资源也不充裕,若贸然增加水域面积,则会带来一系列问题,比如夏季极易可能发生山体滑坡、崩塌、泻溜等重力侵蚀现象,造成严重的水土流失现象。因此,合理种植林草是延河流域治理水土流失、抑制热环境变化的根本措施。目前黄土高原人工林营造使得该区域变绿明显,但同时消耗了大量土壤水分,导致人工林深层土壤出现了大面积的干燥化现象,对区域生态系统稳定性带来威胁。因此,在因地制宜、合理种植林草的同时,实施山水林田湖草沙一体化生态保护和修复,提高生态系统稳定性和可持续性,可为改善生态环境脆弱区提供一定的参考。
参考文献
A wedge strategy for mitigation of urban warming in future climate scenarios
[J].
Algorithm development for land surface temperature retrieval:Application to Chinese Gaofen-5 data
[J].
Estimation of hourly and daily evapotranspiration and soil moisture using downscaled LST over various urban surfaces
[J].
A thermal-based remote sensing technique for routine mapping of land-surface carbon,water and energy fluxes from field to regional scales
[J].
Monitoring of thermal activity at the Hatchobaru-Otake geothermal area in Japan using multi-Source satellite images:With comparisons of methods,and solar and seasonal effects
[J].
基于Landsat8遥感影像的地表温度反演方法对比研究
[J].
DOI:10.11924/j.issn.1000-6850.casb18120100
[本文引用: 1]

随着数据的自由共享,Landsat8系列卫星的遥感数据已经成为地表温度反演的重要数据之一。本文基于Landsat8数据的地表温度反演算法,选择大兴安岭地区漠河市作为研究区域。采用基于Landsat8热红外波段的辐射传输模型法、单窗方法、劈窗算法等不同方法对地表温度进行反演,探究高纬度地区地表温度分布规律,并运用野外实测地温数据进行验证。结果表明:针对本研究区的3种地表温度反演的拟合效果都较好,温度误差在1℃左右,其中辐射传输方程法所得结果精度更高,可为高纬度地区夏季地表温度反演与冻土退化等研究提供一定的参考价值。
Comparison study on land surface temperature retrieval algorithms based on Landsat8 remote sensing image
[J].
Revision of the single-channel algorithm for land surface temperature retrieval from Landsat thermal-infrared data
[J].
A practical split-window algorithm for retrieving land surface temperature from Landsat8 data and a case study of an urban area in China
[J].
Atmospheric water vapor retrieval from Landsat8 thermal infrared images
[J].
Monitoring of land surface temperature in Surabaya,Indonesia from 2013-2021 using Landsat8 imagery and Google Earth Engine
[J].
Spatio-temporal fluctuations analysis of land surface temperature (LST) using Remote Sensing data (LANDSAT TM5/8) and multifractal technique to characterize the urban heat Islands (UHIs)
[J].
Assessment of land surface temperature estimates from Landsat8-TIRS in a high-contrast semiarid agroecosystem,algorithms intercomparison
[J].
Landsat8 data as a source of high resolution sea surface temperature maps in the Baltic Sea
[J].
Annual assessment on the relationship between land surface temperature and six remote sensing indices using Landsat data from 1988 to 2019
[J].
Land surface emissivity retrieval based on moisture index from LANDSAT TM satellite data over heterogeneous surfaces of Delhi city
[J].
Land-Use/Land Cover changes contribute to land surface temperature:A case study of the upper Indus basin of Pakistan
[J].
珠江三角洲土地覆盖变化对地表温度的影响
[J].
Influence of land cover change on land surface temperature in Zhujiang delta
[J].
DOI:10.11821/xb200505007
[本文引用: 1]
The Zhujiang Delta has experienced a rapid land cover change, especially urban expansion over the past 25 years due to accelerated economic growth. This paper reports an investigation into the application of the integration of remote sensing and geographic information systems (GIS) for detecting land cover change and urban growth, and assessing their impact on land surface temperature in the region. Remote sensing techniques were used to carry out land use/cover change detection by using multitemporal Landsat TM/ETM data, and retrieve out the land surface temperature by using single Landsat TM/ETM 6 thermal infrared data. The integration of remote sensing and GIS was further applied to examine the impact of land cover change and urban growth on land surface temperatures. The results revealed a notable and uneven urban growth in the study area. This urban development has raised land surface radiant temperature by 8.9K in the urbanized area. The integration of remote sensing and GIS was found to be effective in monitoring and analyzing urban growth patterns, and in evaluating urbanization impact on land surface temperature.
Landsat and local land surface temperatures in a heterogeneous terrain compared to MODIS values
[J].
Correlation analysis of land surface temperature and topographic elements in Hangzhou,China
[J].
基于Landsat8热红外遥感数据的山地地表温度地形效应研究
[J].
A study on land surface temperature terrain effect over mountainous area based on Landsat8 Thermal infrared data
[J].
基于RHESSys模型的延河流域水文要素定量模拟
[J].
Quantitative simulation of hydrological elements based on RHESSys model in Yanhe River basin
[J].
延安市退耕还林前后土地利用动态变化分析
[J].
Analysis on land use dynamic changes of pre and post returning farmland to forestland in Yan’an City
[J].
延河流域水沙变化及其对降水和土地利用变化的响应
[J].
Runoff and sediment changes and their responses to precipitation and land use change in the Yanhe river basin
[J].
基于Landsat8数据的地表温度反演及分析研究——以武汉市为例
[J].
Land surface temperature retrieval and result analysis based on Landsat8 data in Wuhan City
[J].
A retrieval method for land surface temperatures based on UAV broadband thermal infrared images via the three-dimensional look-up table
[J].
A mono-window algorithm for retrieving land surface temperature from Landsat TM data and its application to the Israel-Egypt border region
[J].
Evaluation of spatial and temporal distribution changes of LST using Landsat images (case study:Tehran)
[J].
延安市地表热环境与下垫面指数的关系研究
[J].
Relationship between surface thermal environment and underlying surface index in Yan’an City
[J].
基于地理探测器的喀什市地表热场空间分异及影响因素分析
[J].
Analysis of spatial differentiation and influencing factors of surface thermal field in Kashgar City based on geographic detector
[J].
What are hot and what are not in an urban landscape:Quantifying and explaining the land surface temperature pattern in Beijing,China
[J].
一种利用TM图像自动提取城镇用地信息的有效方法
[J].
An effective approach to automatically extract urban land-use from TM Imagery
[J].
南京市热环境与地表覆被的时空尺度效应及驱动机制研究
[J].
DOI:10.16258/j.cnki.1674-5906.2020.07.015
[本文引用: 2]
可下载PDF全文。
Spatio-temporal scale effect and driving mechanism of thermal environment and land surface cover in Nanjing
[J].
归一化水汽指数与地表温度的关系
[J].
Relationship between normalized difference moisture index and land surface temperature
[J].
DOI:10.11821/yj2008060015
[本文引用: 1]
Remote sensing of urban heat islands (UHIs) has traditionally used the Normalized Difference Vegetation Index (NDVI) as the indicator of vegetation abundance to estimate the relationship land surface temperature (LST) and vegetation. This study investigates the applicability of Normalized Difference Moisture Index (NDMI) as an alternative indicator. This paper compares the Normalized Difference Vegetation Index (NDVI) and Normalized Difference Moisture Index (NDMI) as indicators of surface urban heat island effects in Landsat imagery by investigating the relationships between the Land Surface Temperature (LST), NDMI, and the NDVI. Landsat Thematic Mapper (TM) and Enhanced Thematic Mapper Plus (ETM+) data were used to estimate the LST through the single window algorithm from three different months for the Zhujiang Delta area. Maps of NDVI and NDMI for three different data were generated from band 3, band 4 and band 5 of TM/ETM+ imageries, respectively. The relationships between the LST, NDMI, and the NDVI were analyzed supported by Geographic Information System (GIS). Our analysis indicates that there is stronger linear relationship between LST and NDMI for all three months, whereas the relationship between LST and NDVI is much weaker and varies by different months. With the change of seasons from summer to autumn, the linear correlation relationship between LST and NDMI was gradually lowered. This result suggests that NDMI provides a complementary metric to the traditionally applied NDVI for analyzing LST quantitatively over the three months for surface urban heat island studies using thermal infrared remote sensing in an urbanized environment.
