A thermal-based remote sensing technique for routine mapping of land-surface carbon,water and energy fluxes from field to regional scales
1
2008
... 地表温度(land surface temperature,LST)作为区域和全球尺度地表水热过程的重要参数,被广泛应用于许多领域[1-2],例如城市热岛效应监测、监测火灾和土地覆盖变化、评估地表干旱和管理水资源等[3⇓⇓⇓⇓-8].通过热红外遥感可获取区域或全球尺度的LST的时空信息.与地面测量的方式相比,遥感观测空间覆盖范围更广且可重复观测[9].然而,受到热红外传感器硬件特性以及热红外电磁波无法穿透云层的限制,目前无法获取兼顾高时空分辨率的LST产品[10].针对这个缺点,国内外学者在云下LST重建和LST空间降尺度这2个方面开展了大量的研究. ...
Improved estimates of monthly land surface temperature from MODIS using a diurnal temperature cycle (DTC) model
1
2020
... 地表温度(land surface temperature,LST)作为区域和全球尺度地表水热过程的重要参数,被广泛应用于许多领域[1-2],例如城市热岛效应监测、监测火灾和土地覆盖变化、评估地表干旱和管理水资源等[3⇓⇓⇓⇓-8].通过热红外遥感可获取区域或全球尺度的LST的时空信息.与地面测量的方式相比,遥感观测空间覆盖范围更广且可重复观测[9].然而,受到热红外传感器硬件特性以及热红外电磁波无法穿透云层的限制,目前无法获取兼顾高时空分辨率的LST产品[10].针对这个缺点,国内外学者在云下LST重建和LST空间降尺度这2个方面开展了大量的研究. ...
Thermal remote sensing of urban climates
1
2003
... 地表温度(land surface temperature,LST)作为区域和全球尺度地表水热过程的重要参数,被广泛应用于许多领域[1-2],例如城市热岛效应监测、监测火灾和土地覆盖变化、评估地表干旱和管理水资源等[3⇓⇓⇓⇓-8].通过热红外遥感可获取区域或全球尺度的LST的时空信息.与地面测量的方式相比,遥感观测空间覆盖范围更广且可重复观测[9].然而,受到热红外传感器硬件特性以及热红外电磁波无法穿透云层的限制,目前无法获取兼顾高时空分辨率的LST产品[10].针对这个缺点,国内外学者在云下LST重建和LST空间降尺度这2个方面开展了大量的研究. ...
Active fire detection and characterization with the advanced spaceborne thermal emission and reflection radiometer (ASTER)
1
2008
... 地表温度(land surface temperature,LST)作为区域和全球尺度地表水热过程的重要参数,被广泛应用于许多领域[1-2],例如城市热岛效应监测、监测火灾和土地覆盖变化、评估地表干旱和管理水资源等[3⇓⇓⇓⇓-8].通过热红外遥感可获取区域或全球尺度的LST的时空信息.与地面测量的方式相比,遥感观测空间覆盖范围更广且可重复观测[9].然而,受到热红外传感器硬件特性以及热红外电磁波无法穿透云层的限制,目前无法获取兼顾高时空分辨率的LST产品[10].针对这个缺点,国内外学者在云下LST重建和LST空间降尺度这2个方面开展了大量的研究. ...
Downscaling AVHRR land surface temperatures for improved surface urban heat island intensity estimation
1
2009
... 地表温度(land surface temperature,LST)作为区域和全球尺度地表水热过程的重要参数,被广泛应用于许多领域[1-2],例如城市热岛效应监测、监测火灾和土地覆盖变化、评估地表干旱和管理水资源等[3⇓⇓⇓⇓-8].通过热红外遥感可获取区域或全球尺度的LST的时空信息.与地面测量的方式相比,遥感观测空间覆盖范围更广且可重复观测[9].然而,受到热红外传感器硬件特性以及热红外电磁波无法穿透云层的限制,目前无法获取兼顾高时空分辨率的LST产品[10].针对这个缺点,国内外学者在云下LST重建和LST空间降尺度这2个方面开展了大量的研究. ...
Use of Landsat thermal imagery in monitoring evapotranspiration and managing water resources
1
2012
... 地表温度(land surface temperature,LST)作为区域和全球尺度地表水热过程的重要参数,被广泛应用于许多领域[1-2],例如城市热岛效应监测、监测火灾和土地覆盖变化、评估地表干旱和管理水资源等[3⇓⇓⇓⇓-8].通过热红外遥感可获取区域或全球尺度的LST的时空信息.与地面测量的方式相比,遥感观测空间覆盖范围更广且可重复观测[9].然而,受到热红外传感器硬件特性以及热红外电磁波无法穿透云层的限制,目前无法获取兼顾高时空分辨率的LST产品[10].针对这个缺点,国内外学者在云下LST重建和LST空间降尺度这2个方面开展了大量的研究. ...
Spatial and temporal monitoring of drought based on land surface temperature,Freetown City,Sierra Leone,West Africa
1
2021
... 地表温度(land surface temperature,LST)作为区域和全球尺度地表水热过程的重要参数,被广泛应用于许多领域[1-2],例如城市热岛效应监测、监测火灾和土地覆盖变化、评估地表干旱和管理水资源等[3⇓⇓⇓⇓-8].通过热红外遥感可获取区域或全球尺度的LST的时空信息.与地面测量的方式相比,遥感观测空间覆盖范围更广且可重复观测[9].然而,受到热红外传感器硬件特性以及热红外电磁波无法穿透云层的限制,目前无法获取兼顾高时空分辨率的LST产品[10].针对这个缺点,国内外学者在云下LST重建和LST空间降尺度这2个方面开展了大量的研究. ...
Retrieval of land-use/land cover change (LUCC) maps and urban expansion dynamics of hyderabad,pakistan via landsat datasets and support vector machine framework
1
2021
... 地表温度(land surface temperature,LST)作为区域和全球尺度地表水热过程的重要参数,被广泛应用于许多领域[1-2],例如城市热岛效应监测、监测火灾和土地覆盖变化、评估地表干旱和管理水资源等[3⇓⇓⇓⇓-8].通过热红外遥感可获取区域或全球尺度的LST的时空信息.与地面测量的方式相比,遥感观测空间覆盖范围更广且可重复观测[9].然而,受到热红外传感器硬件特性以及热红外电磁波无法穿透云层的限制,目前无法获取兼顾高时空分辨率的LST产品[10].针对这个缺点,国内外学者在云下LST重建和LST空间降尺度这2个方面开展了大量的研究. ...
Satellite-derived land surface temperature:Current status and perspectives
1
2013
... 地表温度(land surface temperature,LST)作为区域和全球尺度地表水热过程的重要参数,被广泛应用于许多领域[1-2],例如城市热岛效应监测、监测火灾和土地覆盖变化、评估地表干旱和管理水资源等[3⇓⇓⇓⇓-8].通过热红外遥感可获取区域或全球尺度的LST的时空信息.与地面测量的方式相比,遥感观测空间覆盖范围更广且可重复观测[9].然而,受到热红外传感器硬件特性以及热红外电磁波无法穿透云层的限制,目前无法获取兼顾高时空分辨率的LST产品[10].针对这个缺点,国内外学者在云下LST重建和LST空间降尺度这2个方面开展了大量的研究. ...
A vegetation index based technique for spatial sharpening of thermal imagery
3
2007
... 地表温度(land surface temperature,LST)作为区域和全球尺度地表水热过程的重要参数,被广泛应用于许多领域[1-2],例如城市热岛效应监测、监测火灾和土地覆盖变化、评估地表干旱和管理水资源等[3⇓⇓⇓⇓-8].通过热红外遥感可获取区域或全球尺度的LST的时空信息.与地面测量的方式相比,遥感观测空间覆盖范围更广且可重复观测[9].然而,受到热红外传感器硬件特性以及热红外电磁波无法穿透云层的限制,目前无法获取兼顾高时空分辨率的LST产品[10].针对这个缺点,国内外学者在云下LST重建和LST空间降尺度这2个方面开展了大量的研究. ...
... 常用的LST空间降尺度方法可以分为2种类型: 时空融合算法和基于回归的方法.时空融合算法结合2种LST产品的高时间分辨率和高空间分辨率的特点,获取高时空分辨率的LST产品.Gao等[29]提出的时空自适应反射率融合模型(spatial and temporal adaptive reflectance fusion model,STARFM)用一对初始时刻的高/低空间分辨率图像和一张目标时刻的低空间分辨率图像作为输入,高空间分辨率像元值由邻近且同质的相似像元加权而来.STARFM算法应用于森林地区、农田地区以及作物和森林的混合区域的结果表明,该算法可以精确估计高空间分辨率数据.然而STARFM算法基于地表覆盖类型和系统误差在初始时刻至目标时刻内保持不变的假设,因此该算法在极度异质性区域的精度有所降低[30].为提高STARFM算法在异质性区域的精度,可在原先的基础上,再增加一对低/高空间分辨率图像,用于计算低/高空间分辨率图像之间的转换系数[31].时空融合算法的输入数据条件较难满足,与之相比,基于回归的方法适用范围更广.该方法基于尺度不变的假设,获取低空间分辨率的尺度因子与LST之间的回归关系,并利用回归关系与高空间分辨率的尺度因子重建高空间分辨率的LST.热图像锐化算法(thermal sharpening,TsHARP)中使用简单的一次多项式作为回归工具,并选择植被覆盖度作为尺度因子,该模型在植被区域的精度较高[10].为提高基于回归的方法在异质性区域的精度,有学者选择可见光—近红外波段的像元亮度值或反射率、光谱指数等作为尺度因子[32⇓⇓⇓-36].目前,基于回归的方法中的回归工具通常选择机器学习模型,例如ANN、随机森林模型和XGBoost模型[37⇓⇓-40]等. ...
... 随后,基于尺度不变的假设[10],使用高空间分辨率降尺度因子作为回归模型的输入,得到高空间分辨率LST的预测值,即 ...
Evaluation of the relationship between air and land surface temperature under clear- and cloudy-sky conditions
1
2011
... 云下LST重建的方法可分为统计回归方法、基于LST时空信息的方法、基于地表能量平衡方程的方法、基于被动微波的方法和基于温度年循环(annual temperature cycle,ATC)模型的方法5类.统计回归方法通过建立晴空条件下LST和相关变量(如气温、风速)的回归方程来估算云下LST[11].随着机器学习的发展,回归工具从简单的线性回归扩展到人工神经网络(artificial neural network,ANN)模型[12]、极端梯度提升树(extreme gradient boosting,XGBoost)模型[13-14]等机器学习方法.基于LST时空信息的方法中包含时间重建算法、空间插值算法以及同时利用LST时间信息和空间信息的算法.时间重建算法中常在邻近时刻寻找与目标时刻的缺失像元具有相似时间变化的晴空像元,并利用晴空像元的信息重建目标时刻的LST[15].空间插值算法包括反距离加权[16]、样条函数[17]与克里金插值[18]等.由于时间重建算法与空间插值算法不适用于缺失值范围较大的情况,因而在其基础上,发展了同时利用时间信息与空间信息的算法[19⇓⇓-22].以上2类通常仅使用晴空LST的信息,仅得到LST的理论晴空值.基于地表能量平衡方程的方法根据相邻的晴空LST和气象数据计算云下LST.Jin等[23]使用地表能量平衡方程计算晴空LST与云下LST之间的差异,估计云下LST.然而,地表能量平衡模型的参数化存在很大的不确定性[24].基于被动微波的方法利用微波可以穿透云层的特点来获取云下LST[25-26].Zhang等[27]结合重建的被动微波亮度温度与热红外数据估计1 km全天候LST.然而被动微波数据的空间分辨率较低,对结果精度有一定程度的影响.基于ATC模型的方法通过构建LST的年变化曲线来估计云下LST,该方法可使用较少的观测值来估计LST的时间序列,适用于LST存在大量缺失值的情况.Zou等[28]将气温和归一化差异植被指数(normalized difference vegetation index,NDVI)引入传统的ATC模型,构建LST的时间变化曲线. ...
Prediction of high spatio-temporal resolution land surface temperature under cloudy conditions using microwave vegetation index and ANN
1
2016
... 云下LST重建的方法可分为统计回归方法、基于LST时空信息的方法、基于地表能量平衡方程的方法、基于被动微波的方法和基于温度年循环(annual temperature cycle,ATC)模型的方法5类.统计回归方法通过建立晴空条件下LST和相关变量(如气温、风速)的回归方程来估算云下LST[11].随着机器学习的发展,回归工具从简单的线性回归扩展到人工神经网络(artificial neural network,ANN)模型[12]、极端梯度提升树(extreme gradient boosting,XGBoost)模型[13-14]等机器学习方法.基于LST时空信息的方法中包含时间重建算法、空间插值算法以及同时利用LST时间信息和空间信息的算法.时间重建算法中常在邻近时刻寻找与目标时刻的缺失像元具有相似时间变化的晴空像元,并利用晴空像元的信息重建目标时刻的LST[15].空间插值算法包括反距离加权[16]、样条函数[17]与克里金插值[18]等.由于时间重建算法与空间插值算法不适用于缺失值范围较大的情况,因而在其基础上,发展了同时利用时间信息与空间信息的算法[19⇓⇓-22].以上2类通常仅使用晴空LST的信息,仅得到LST的理论晴空值.基于地表能量平衡方程的方法根据相邻的晴空LST和气象数据计算云下LST.Jin等[23]使用地表能量平衡方程计算晴空LST与云下LST之间的差异,估计云下LST.然而,地表能量平衡模型的参数化存在很大的不确定性[24].基于被动微波的方法利用微波可以穿透云层的特点来获取云下LST[25-26].Zhang等[27]结合重建的被动微波亮度温度与热红外数据估计1 km全天候LST.然而被动微波数据的空间分辨率较低,对结果精度有一定程度的影响.基于ATC模型的方法通过构建LST的年变化曲线来估计云下LST,该方法可使用较少的观测值来估计LST的时间序列,适用于LST存在大量缺失值的情况.Zou等[28]将气温和归一化差异植被指数(normalized difference vegetation index,NDVI)引入传统的ATC模型,构建LST的时间变化曲线. ...
Reconstruction of all-weather daytime and nighttime MODIS Aqua-Terra land surface temperature products using an XGBoost approach
1
2021
... 云下LST重建的方法可分为统计回归方法、基于LST时空信息的方法、基于地表能量平衡方程的方法、基于被动微波的方法和基于温度年循环(annual temperature cycle,ATC)模型的方法5类.统计回归方法通过建立晴空条件下LST和相关变量(如气温、风速)的回归方程来估算云下LST[11].随着机器学习的发展,回归工具从简单的线性回归扩展到人工神经网络(artificial neural network,ANN)模型[12]、极端梯度提升树(extreme gradient boosting,XGBoost)模型[13-14]等机器学习方法.基于LST时空信息的方法中包含时间重建算法、空间插值算法以及同时利用LST时间信息和空间信息的算法.时间重建算法中常在邻近时刻寻找与目标时刻的缺失像元具有相似时间变化的晴空像元,并利用晴空像元的信息重建目标时刻的LST[15].空间插值算法包括反距离加权[16]、样条函数[17]与克里金插值[18]等.由于时间重建算法与空间插值算法不适用于缺失值范围较大的情况,因而在其基础上,发展了同时利用时间信息与空间信息的算法[19⇓⇓-22].以上2类通常仅使用晴空LST的信息,仅得到LST的理论晴空值.基于地表能量平衡方程的方法根据相邻的晴空LST和气象数据计算云下LST.Jin等[23]使用地表能量平衡方程计算晴空LST与云下LST之间的差异,估计云下LST.然而,地表能量平衡模型的参数化存在很大的不确定性[24].基于被动微波的方法利用微波可以穿透云层的特点来获取云下LST[25-26].Zhang等[27]结合重建的被动微波亮度温度与热红外数据估计1 km全天候LST.然而被动微波数据的空间分辨率较低,对结果精度有一定程度的影响.基于ATC模型的方法通过构建LST的年变化曲线来估计云下LST,该方法可使用较少的观测值来估计LST的时间序列,适用于LST存在大量缺失值的情况.Zou等[28]将气温和归一化差异植被指数(normalized difference vegetation index,NDVI)引入传统的ATC模型,构建LST的时间变化曲线. ...
Reconstructing all-weather daytime land surface temperature based on energy balance considering the cloud radiative effect
1
2022
... 云下LST重建的方法可分为统计回归方法、基于LST时空信息的方法、基于地表能量平衡方程的方法、基于被动微波的方法和基于温度年循环(annual temperature cycle,ATC)模型的方法5类.统计回归方法通过建立晴空条件下LST和相关变量(如气温、风速)的回归方程来估算云下LST[11].随着机器学习的发展,回归工具从简单的线性回归扩展到人工神经网络(artificial neural network,ANN)模型[12]、极端梯度提升树(extreme gradient boosting,XGBoost)模型[13-14]等机器学习方法.基于LST时空信息的方法中包含时间重建算法、空间插值算法以及同时利用LST时间信息和空间信息的算法.时间重建算法中常在邻近时刻寻找与目标时刻的缺失像元具有相似时间变化的晴空像元,并利用晴空像元的信息重建目标时刻的LST[15].空间插值算法包括反距离加权[16]、样条函数[17]与克里金插值[18]等.由于时间重建算法与空间插值算法不适用于缺失值范围较大的情况,因而在其基础上,发展了同时利用时间信息与空间信息的算法[19⇓⇓-22].以上2类通常仅使用晴空LST的信息,仅得到LST的理论晴空值.基于地表能量平衡方程的方法根据相邻的晴空LST和气象数据计算云下LST.Jin等[23]使用地表能量平衡方程计算晴空LST与云下LST之间的差异,估计云下LST.然而,地表能量平衡模型的参数化存在很大的不确定性[24].基于被动微波的方法利用微波可以穿透云层的特点来获取云下LST[25-26].Zhang等[27]结合重建的被动微波亮度温度与热红外数据估计1 km全天候LST.然而被动微波数据的空间分辨率较低,对结果精度有一定程度的影响.基于ATC模型的方法通过构建LST的年变化曲线来估计云下LST,该方法可使用较少的观测值来估计LST的时间序列,适用于LST存在大量缺失值的情况.Zou等[28]将气温和归一化差异植被指数(normalized difference vegetation index,NDVI)引入传统的ATC模型,构建LST的时间变化曲线. ...
Patch-based information reconstruction of cloud-contaminated multitemporal images
1
2014
... 云下LST重建的方法可分为统计回归方法、基于LST时空信息的方法、基于地表能量平衡方程的方法、基于被动微波的方法和基于温度年循环(annual temperature cycle,ATC)模型的方法5类.统计回归方法通过建立晴空条件下LST和相关变量(如气温、风速)的回归方程来估算云下LST[11].随着机器学习的发展,回归工具从简单的线性回归扩展到人工神经网络(artificial neural network,ANN)模型[12]、极端梯度提升树(extreme gradient boosting,XGBoost)模型[13-14]等机器学习方法.基于LST时空信息的方法中包含时间重建算法、空间插值算法以及同时利用LST时间信息和空间信息的算法.时间重建算法中常在邻近时刻寻找与目标时刻的缺失像元具有相似时间变化的晴空像元,并利用晴空像元的信息重建目标时刻的LST[15].空间插值算法包括反距离加权[16]、样条函数[17]与克里金插值[18]等.由于时间重建算法与空间插值算法不适用于缺失值范围较大的情况,因而在其基础上,发展了同时利用时间信息与空间信息的算法[19⇓⇓-22].以上2类通常仅使用晴空LST的信息,仅得到LST的理论晴空值.基于地表能量平衡方程的方法根据相邻的晴空LST和气象数据计算云下LST.Jin等[23]使用地表能量平衡方程计算晴空LST与云下LST之间的差异,估计云下LST.然而,地表能量平衡模型的参数化存在很大的不确定性[24].基于被动微波的方法利用微波可以穿透云层的特点来获取云下LST[25-26].Zhang等[27]结合重建的被动微波亮度温度与热红外数据估计1 km全天候LST.然而被动微波数据的空间分辨率较低,对结果精度有一定程度的影响.基于ATC模型的方法通过构建LST的年变化曲线来估计云下LST,该方法可使用较少的观测值来估计LST的时间序列,适用于LST存在大量缺失值的情况.Zou等[28]将气温和归一化差异植被指数(normalized difference vegetation index,NDVI)引入传统的ATC模型,构建LST的时间变化曲线. ...
Spatial interpolation of climatic variables using land surface temperature and modified inverse distance weighting
1
2015
... 云下LST重建的方法可分为统计回归方法、基于LST时空信息的方法、基于地表能量平衡方程的方法、基于被动微波的方法和基于温度年循环(annual temperature cycle,ATC)模型的方法5类.统计回归方法通过建立晴空条件下LST和相关变量(如气温、风速)的回归方程来估算云下LST[11].随着机器学习的发展,回归工具从简单的线性回归扩展到人工神经网络(artificial neural network,ANN)模型[12]、极端梯度提升树(extreme gradient boosting,XGBoost)模型[13-14]等机器学习方法.基于LST时空信息的方法中包含时间重建算法、空间插值算法以及同时利用LST时间信息和空间信息的算法.时间重建算法中常在邻近时刻寻找与目标时刻的缺失像元具有相似时间变化的晴空像元,并利用晴空像元的信息重建目标时刻的LST[15].空间插值算法包括反距离加权[16]、样条函数[17]与克里金插值[18]等.由于时间重建算法与空间插值算法不适用于缺失值范围较大的情况,因而在其基础上,发展了同时利用时间信息与空间信息的算法[19⇓⇓-22].以上2类通常仅使用晴空LST的信息,仅得到LST的理论晴空值.基于地表能量平衡方程的方法根据相邻的晴空LST和气象数据计算云下LST.Jin等[23]使用地表能量平衡方程计算晴空LST与云下LST之间的差异,估计云下LST.然而,地表能量平衡模型的参数化存在很大的不确定性[24].基于被动微波的方法利用微波可以穿透云层的特点来获取云下LST[25-26].Zhang等[27]结合重建的被动微波亮度温度与热红外数据估计1 km全天候LST.然而被动微波数据的空间分辨率较低,对结果精度有一定程度的影响.基于ATC模型的方法通过构建LST的年变化曲线来估计云下LST,该方法可使用较少的观测值来估计LST的时间序列,适用于LST存在大量缺失值的情况.Zou等[28]将气温和归一化差异植被指数(normalized difference vegetation index,NDVI)引入传统的ATC模型,构建LST的时间变化曲线. ...
Estimating daily land surface temperatures in mountainous environments by reconstructed MODIS LST data
1
2010
... 云下LST重建的方法可分为统计回归方法、基于LST时空信息的方法、基于地表能量平衡方程的方法、基于被动微波的方法和基于温度年循环(annual temperature cycle,ATC)模型的方法5类.统计回归方法通过建立晴空条件下LST和相关变量(如气温、风速)的回归方程来估算云下LST[11].随着机器学习的发展,回归工具从简单的线性回归扩展到人工神经网络(artificial neural network,ANN)模型[12]、极端梯度提升树(extreme gradient boosting,XGBoost)模型[13-14]等机器学习方法.基于LST时空信息的方法中包含时间重建算法、空间插值算法以及同时利用LST时间信息和空间信息的算法.时间重建算法中常在邻近时刻寻找与目标时刻的缺失像元具有相似时间变化的晴空像元,并利用晴空像元的信息重建目标时刻的LST[15].空间插值算法包括反距离加权[16]、样条函数[17]与克里金插值[18]等.由于时间重建算法与空间插值算法不适用于缺失值范围较大的情况,因而在其基础上,发展了同时利用时间信息与空间信息的算法[19⇓⇓-22].以上2类通常仅使用晴空LST的信息,仅得到LST的理论晴空值.基于地表能量平衡方程的方法根据相邻的晴空LST和气象数据计算云下LST.Jin等[23]使用地表能量平衡方程计算晴空LST与云下LST之间的差异,估计云下LST.然而,地表能量平衡模型的参数化存在很大的不确定性[24].基于被动微波的方法利用微波可以穿透云层的特点来获取云下LST[25-26].Zhang等[27]结合重建的被动微波亮度温度与热红外数据估计1 km全天候LST.然而被动微波数据的空间分辨率较低,对结果精度有一定程度的影响.基于ATC模型的方法通过构建LST的年变化曲线来估计云下LST,该方法可使用较少的观测值来估计LST的时间序列,适用于LST存在大量缺失值的情况.Zou等[28]将气温和归一化差异植被指数(normalized difference vegetation index,NDVI)引入传统的ATC模型,构建LST的时间变化曲线. ...
Regression-kriging technique to downscale satellite-derived land surface temperature in heterogeneous agricultural landscape
1
2015
... 云下LST重建的方法可分为统计回归方法、基于LST时空信息的方法、基于地表能量平衡方程的方法、基于被动微波的方法和基于温度年循环(annual temperature cycle,ATC)模型的方法5类.统计回归方法通过建立晴空条件下LST和相关变量(如气温、风速)的回归方程来估算云下LST[11].随着机器学习的发展,回归工具从简单的线性回归扩展到人工神经网络(artificial neural network,ANN)模型[12]、极端梯度提升树(extreme gradient boosting,XGBoost)模型[13-14]等机器学习方法.基于LST时空信息的方法中包含时间重建算法、空间插值算法以及同时利用LST时间信息和空间信息的算法.时间重建算法中常在邻近时刻寻找与目标时刻的缺失像元具有相似时间变化的晴空像元,并利用晴空像元的信息重建目标时刻的LST[15].空间插值算法包括反距离加权[16]、样条函数[17]与克里金插值[18]等.由于时间重建算法与空间插值算法不适用于缺失值范围较大的情况,因而在其基础上,发展了同时利用时间信息与空间信息的算法[19⇓⇓-22].以上2类通常仅使用晴空LST的信息,仅得到LST的理论晴空值.基于地表能量平衡方程的方法根据相邻的晴空LST和气象数据计算云下LST.Jin等[23]使用地表能量平衡方程计算晴空LST与云下LST之间的差异,估计云下LST.然而,地表能量平衡模型的参数化存在很大的不确定性[24].基于被动微波的方法利用微波可以穿透云层的特点来获取云下LST[25-26].Zhang等[27]结合重建的被动微波亮度温度与热红外数据估计1 km全天候LST.然而被动微波数据的空间分辨率较低,对结果精度有一定程度的影响.基于ATC模型的方法通过构建LST的年变化曲线来估计云下LST,该方法可使用较少的观测值来估计LST的时间序列,适用于LST存在大量缺失值的情况.Zou等[28]将气温和归一化差异植被指数(normalized difference vegetation index,NDVI)引入传统的ATC模型,构建LST的时间变化曲线. ...
A physical model-based method for retrieving urban land surface temperatures under cloudy conditions
1
2019
... 云下LST重建的方法可分为统计回归方法、基于LST时空信息的方法、基于地表能量平衡方程的方法、基于被动微波的方法和基于温度年循环(annual temperature cycle,ATC)模型的方法5类.统计回归方法通过建立晴空条件下LST和相关变量(如气温、风速)的回归方程来估算云下LST[11].随着机器学习的发展,回归工具从简单的线性回归扩展到人工神经网络(artificial neural network,ANN)模型[12]、极端梯度提升树(extreme gradient boosting,XGBoost)模型[13-14]等机器学习方法.基于LST时空信息的方法中包含时间重建算法、空间插值算法以及同时利用LST时间信息和空间信息的算法.时间重建算法中常在邻近时刻寻找与目标时刻的缺失像元具有相似时间变化的晴空像元,并利用晴空像元的信息重建目标时刻的LST[15].空间插值算法包括反距离加权[16]、样条函数[17]与克里金插值[18]等.由于时间重建算法与空间插值算法不适用于缺失值范围较大的情况,因而在其基础上,发展了同时利用时间信息与空间信息的算法[19⇓⇓-22].以上2类通常仅使用晴空LST的信息,仅得到LST的理论晴空值.基于地表能量平衡方程的方法根据相邻的晴空LST和气象数据计算云下LST.Jin等[23]使用地表能量平衡方程计算晴空LST与云下LST之间的差异,估计云下LST.然而,地表能量平衡模型的参数化存在很大的不确定性[24].基于被动微波的方法利用微波可以穿透云层的特点来获取云下LST[25-26].Zhang等[27]结合重建的被动微波亮度温度与热红外数据估计1 km全天候LST.然而被动微波数据的空间分辨率较低,对结果精度有一定程度的影响.基于ATC模型的方法通过构建LST的年变化曲线来估计云下LST,该方法可使用较少的观测值来估计LST的时间序列,适用于LST存在大量缺失值的情况.Zou等[28]将气温和归一化差异植被指数(normalized difference vegetation index,NDVI)引入传统的ATC模型,构建LST的时间变化曲线. ...
Generation of MODIS-like land surface temperatures under all-weather conditions based on a data fusion approach
1
2020
... 云下LST重建的方法可分为统计回归方法、基于LST时空信息的方法、基于地表能量平衡方程的方法、基于被动微波的方法和基于温度年循环(annual temperature cycle,ATC)模型的方法5类.统计回归方法通过建立晴空条件下LST和相关变量(如气温、风速)的回归方程来估算云下LST[11].随着机器学习的发展,回归工具从简单的线性回归扩展到人工神经网络(artificial neural network,ANN)模型[12]、极端梯度提升树(extreme gradient boosting,XGBoost)模型[13-14]等机器学习方法.基于LST时空信息的方法中包含时间重建算法、空间插值算法以及同时利用LST时间信息和空间信息的算法.时间重建算法中常在邻近时刻寻找与目标时刻的缺失像元具有相似时间变化的晴空像元,并利用晴空像元的信息重建目标时刻的LST[15].空间插值算法包括反距离加权[16]、样条函数[17]与克里金插值[18]等.由于时间重建算法与空间插值算法不适用于缺失值范围较大的情况,因而在其基础上,发展了同时利用时间信息与空间信息的算法[19⇓⇓-22].以上2类通常仅使用晴空LST的信息,仅得到LST的理论晴空值.基于地表能量平衡方程的方法根据相邻的晴空LST和气象数据计算云下LST.Jin等[23]使用地表能量平衡方程计算晴空LST与云下LST之间的差异,估计云下LST.然而,地表能量平衡模型的参数化存在很大的不确定性[24].基于被动微波的方法利用微波可以穿透云层的特点来获取云下LST[25-26].Zhang等[27]结合重建的被动微波亮度温度与热红外数据估计1 km全天候LST.然而被动微波数据的空间分辨率较低,对结果精度有一定程度的影响.基于ATC模型的方法通过构建LST的年变化曲线来估计云下LST,该方法可使用较少的观测值来估计LST的时间序列,适用于LST存在大量缺失值的情况.Zou等[28]将气温和归一化差异植被指数(normalized difference vegetation index,NDVI)引入传统的ATC模型,构建LST的时间变化曲线. ...
A two-step deep learning framework for mapping gapless all-weather land surface temperature using thermal infrared and passive microwave data
1
2022
... 云下LST重建的方法可分为统计回归方法、基于LST时空信息的方法、基于地表能量平衡方程的方法、基于被动微波的方法和基于温度年循环(annual temperature cycle,ATC)模型的方法5类.统计回归方法通过建立晴空条件下LST和相关变量(如气温、风速)的回归方程来估算云下LST[11].随着机器学习的发展,回归工具从简单的线性回归扩展到人工神经网络(artificial neural network,ANN)模型[12]、极端梯度提升树(extreme gradient boosting,XGBoost)模型[13-14]等机器学习方法.基于LST时空信息的方法中包含时间重建算法、空间插值算法以及同时利用LST时间信息和空间信息的算法.时间重建算法中常在邻近时刻寻找与目标时刻的缺失像元具有相似时间变化的晴空像元,并利用晴空像元的信息重建目标时刻的LST[15].空间插值算法包括反距离加权[16]、样条函数[17]与克里金插值[18]等.由于时间重建算法与空间插值算法不适用于缺失值范围较大的情况,因而在其基础上,发展了同时利用时间信息与空间信息的算法[19⇓⇓-22].以上2类通常仅使用晴空LST的信息,仅得到LST的理论晴空值.基于地表能量平衡方程的方法根据相邻的晴空LST和气象数据计算云下LST.Jin等[23]使用地表能量平衡方程计算晴空LST与云下LST之间的差异,估计云下LST.然而,地表能量平衡模型的参数化存在很大的不确定性[24].基于被动微波的方法利用微波可以穿透云层的特点来获取云下LST[25-26].Zhang等[27]结合重建的被动微波亮度温度与热红外数据估计1 km全天候LST.然而被动微波数据的空间分辨率较低,对结果精度有一定程度的影响.基于ATC模型的方法通过构建LST的年变化曲线来估计云下LST,该方法可使用较少的观测值来估计LST的时间序列,适用于LST存在大量缺失值的情况.Zou等[28]将气温和归一化差异植被指数(normalized difference vegetation index,NDVI)引入传统的ATC模型,构建LST的时间变化曲线. ...
Reconstruction of land surface temperature under cloudy conditions from Landsat8 data using annual temperature cycle model
1
2022
... 云下LST重建的方法可分为统计回归方法、基于LST时空信息的方法、基于地表能量平衡方程的方法、基于被动微波的方法和基于温度年循环(annual temperature cycle,ATC)模型的方法5类.统计回归方法通过建立晴空条件下LST和相关变量(如气温、风速)的回归方程来估算云下LST[11].随着机器学习的发展,回归工具从简单的线性回归扩展到人工神经网络(artificial neural network,ANN)模型[12]、极端梯度提升树(extreme gradient boosting,XGBoost)模型[13-14]等机器学习方法.基于LST时空信息的方法中包含时间重建算法、空间插值算法以及同时利用LST时间信息和空间信息的算法.时间重建算法中常在邻近时刻寻找与目标时刻的缺失像元具有相似时间变化的晴空像元,并利用晴空像元的信息重建目标时刻的LST[15].空间插值算法包括反距离加权[16]、样条函数[17]与克里金插值[18]等.由于时间重建算法与空间插值算法不适用于缺失值范围较大的情况,因而在其基础上,发展了同时利用时间信息与空间信息的算法[19⇓⇓-22].以上2类通常仅使用晴空LST的信息,仅得到LST的理论晴空值.基于地表能量平衡方程的方法根据相邻的晴空LST和气象数据计算云下LST.Jin等[23]使用地表能量平衡方程计算晴空LST与云下LST之间的差异,估计云下LST.然而,地表能量平衡模型的参数化存在很大的不确定性[24].基于被动微波的方法利用微波可以穿透云层的特点来获取云下LST[25-26].Zhang等[27]结合重建的被动微波亮度温度与热红外数据估计1 km全天候LST.然而被动微波数据的空间分辨率较低,对结果精度有一定程度的影响.基于ATC模型的方法通过构建LST的年变化曲线来估计云下LST,该方法可使用较少的观测值来估计LST的时间序列,适用于LST存在大量缺失值的情况.Zou等[28]将气温和归一化差异植被指数(normalized difference vegetation index,NDVI)引入传统的ATC模型,构建LST的时间变化曲线. ...
A generalized algorithm for retrieving cloudy sky skin temperature from satellite thermal infrared radiances
1
2000
... 云下LST重建的方法可分为统计回归方法、基于LST时空信息的方法、基于地表能量平衡方程的方法、基于被动微波的方法和基于温度年循环(annual temperature cycle,ATC)模型的方法5类.统计回归方法通过建立晴空条件下LST和相关变量(如气温、风速)的回归方程来估算云下LST[11].随着机器学习的发展,回归工具从简单的线性回归扩展到人工神经网络(artificial neural network,ANN)模型[12]、极端梯度提升树(extreme gradient boosting,XGBoost)模型[13-14]等机器学习方法.基于LST时空信息的方法中包含时间重建算法、空间插值算法以及同时利用LST时间信息和空间信息的算法.时间重建算法中常在邻近时刻寻找与目标时刻的缺失像元具有相似时间变化的晴空像元,并利用晴空像元的信息重建目标时刻的LST[15].空间插值算法包括反距离加权[16]、样条函数[17]与克里金插值[18]等.由于时间重建算法与空间插值算法不适用于缺失值范围较大的情况,因而在其基础上,发展了同时利用时间信息与空间信息的算法[19⇓⇓-22].以上2类通常仅使用晴空LST的信息,仅得到LST的理论晴空值.基于地表能量平衡方程的方法根据相邻的晴空LST和气象数据计算云下LST.Jin等[23]使用地表能量平衡方程计算晴空LST与云下LST之间的差异,估计云下LST.然而,地表能量平衡模型的参数化存在很大的不确定性[24].基于被动微波的方法利用微波可以穿透云层的特点来获取云下LST[25-26].Zhang等[27]结合重建的被动微波亮度温度与热红外数据估计1 km全天候LST.然而被动微波数据的空间分辨率较低,对结果精度有一定程度的影响.基于ATC模型的方法通过构建LST的年变化曲线来估计云下LST,该方法可使用较少的观测值来估计LST的时间序列,适用于LST存在大量缺失值的情况.Zou等[28]将气温和归一化差异植被指数(normalized difference vegetation index,NDVI)引入传统的ATC模型,构建LST的时间变化曲线. ...
Construction of cloud-free MODIS-like land surface temperatures coupled with a regional weather research and forecasting (WRF) model
1
2022
... 云下LST重建的方法可分为统计回归方法、基于LST时空信息的方法、基于地表能量平衡方程的方法、基于被动微波的方法和基于温度年循环(annual temperature cycle,ATC)模型的方法5类.统计回归方法通过建立晴空条件下LST和相关变量(如气温、风速)的回归方程来估算云下LST[11].随着机器学习的发展,回归工具从简单的线性回归扩展到人工神经网络(artificial neural network,ANN)模型[12]、极端梯度提升树(extreme gradient boosting,XGBoost)模型[13-14]等机器学习方法.基于LST时空信息的方法中包含时间重建算法、空间插值算法以及同时利用LST时间信息和空间信息的算法.时间重建算法中常在邻近时刻寻找与目标时刻的缺失像元具有相似时间变化的晴空像元,并利用晴空像元的信息重建目标时刻的LST[15].空间插值算法包括反距离加权[16]、样条函数[17]与克里金插值[18]等.由于时间重建算法与空间插值算法不适用于缺失值范围较大的情况,因而在其基础上,发展了同时利用时间信息与空间信息的算法[19⇓⇓-22].以上2类通常仅使用晴空LST的信息,仅得到LST的理论晴空值.基于地表能量平衡方程的方法根据相邻的晴空LST和气象数据计算云下LST.Jin等[23]使用地表能量平衡方程计算晴空LST与云下LST之间的差异,估计云下LST.然而,地表能量平衡模型的参数化存在很大的不确定性[24].基于被动微波的方法利用微波可以穿透云层的特点来获取云下LST[25-26].Zhang等[27]结合重建的被动微波亮度温度与热红外数据估计1 km全天候LST.然而被动微波数据的空间分辨率较低,对结果精度有一定程度的影响.基于ATC模型的方法通过构建LST的年变化曲线来估计云下LST,该方法可使用较少的观测值来估计LST的时间序列,适用于LST存在大量缺失值的情况.Zou等[28]将气温和归一化差异植被指数(normalized difference vegetation index,NDVI)引入传统的ATC模型,构建LST的时间变化曲线. ...
A framework for the retrieval of all-weather land surface temperature at a high spatial resolution from polar-orbiting thermal infrared and passive microwave data
1
2017
... 云下LST重建的方法可分为统计回归方法、基于LST时空信息的方法、基于地表能量平衡方程的方法、基于被动微波的方法和基于温度年循环(annual temperature cycle,ATC)模型的方法5类.统计回归方法通过建立晴空条件下LST和相关变量(如气温、风速)的回归方程来估算云下LST[11].随着机器学习的发展,回归工具从简单的线性回归扩展到人工神经网络(artificial neural network,ANN)模型[12]、极端梯度提升树(extreme gradient boosting,XGBoost)模型[13-14]等机器学习方法.基于LST时空信息的方法中包含时间重建算法、空间插值算法以及同时利用LST时间信息和空间信息的算法.时间重建算法中常在邻近时刻寻找与目标时刻的缺失像元具有相似时间变化的晴空像元,并利用晴空像元的信息重建目标时刻的LST[15].空间插值算法包括反距离加权[16]、样条函数[17]与克里金插值[18]等.由于时间重建算法与空间插值算法不适用于缺失值范围较大的情况,因而在其基础上,发展了同时利用时间信息与空间信息的算法[19⇓⇓-22].以上2类通常仅使用晴空LST的信息,仅得到LST的理论晴空值.基于地表能量平衡方程的方法根据相邻的晴空LST和气象数据计算云下LST.Jin等[23]使用地表能量平衡方程计算晴空LST与云下LST之间的差异,估计云下LST.然而,地表能量平衡模型的参数化存在很大的不确定性[24].基于被动微波的方法利用微波可以穿透云层的特点来获取云下LST[25-26].Zhang等[27]结合重建的被动微波亮度温度与热红外数据估计1 km全天候LST.然而被动微波数据的空间分辨率较低,对结果精度有一定程度的影响.基于ATC模型的方法通过构建LST的年变化曲线来估计云下LST,该方法可使用较少的观测值来估计LST的时间序列,适用于LST存在大量缺失值的情况.Zou等[28]将气温和归一化差异植被指数(normalized difference vegetation index,NDVI)引入传统的ATC模型,构建LST的时间变化曲线. ...
Estimation of all-weather 1 km MODIS land surface temperature for humid summer days
1
2020
... 云下LST重建的方法可分为统计回归方法、基于LST时空信息的方法、基于地表能量平衡方程的方法、基于被动微波的方法和基于温度年循环(annual temperature cycle,ATC)模型的方法5类.统计回归方法通过建立晴空条件下LST和相关变量(如气温、风速)的回归方程来估算云下LST[11].随着机器学习的发展,回归工具从简单的线性回归扩展到人工神经网络(artificial neural network,ANN)模型[12]、极端梯度提升树(extreme gradient boosting,XGBoost)模型[13-14]等机器学习方法.基于LST时空信息的方法中包含时间重建算法、空间插值算法以及同时利用LST时间信息和空间信息的算法.时间重建算法中常在邻近时刻寻找与目标时刻的缺失像元具有相似时间变化的晴空像元,并利用晴空像元的信息重建目标时刻的LST[15].空间插值算法包括反距离加权[16]、样条函数[17]与克里金插值[18]等.由于时间重建算法与空间插值算法不适用于缺失值范围较大的情况,因而在其基础上,发展了同时利用时间信息与空间信息的算法[19⇓⇓-22].以上2类通常仅使用晴空LST的信息,仅得到LST的理论晴空值.基于地表能量平衡方程的方法根据相邻的晴空LST和气象数据计算云下LST.Jin等[23]使用地表能量平衡方程计算晴空LST与云下LST之间的差异,估计云下LST.然而,地表能量平衡模型的参数化存在很大的不确定性[24].基于被动微波的方法利用微波可以穿透云层的特点来获取云下LST[25-26].Zhang等[27]结合重建的被动微波亮度温度与热红外数据估计1 km全天候LST.然而被动微波数据的空间分辨率较低,对结果精度有一定程度的影响.基于ATC模型的方法通过构建LST的年变化曲线来估计云下LST,该方法可使用较少的观测值来估计LST的时间序列,适用于LST存在大量缺失值的情况.Zou等[28]将气温和归一化差异植被指数(normalized difference vegetation index,NDVI)引入传统的ATC模型,构建LST的时间变化曲线. ...
Estimation of 1-km all-weather remotely sensed land surface temperature based on reconstructed spatial-seamless satellite passive microwave brightness temperature and thermal infrared data
1
2020
... 云下LST重建的方法可分为统计回归方法、基于LST时空信息的方法、基于地表能量平衡方程的方法、基于被动微波的方法和基于温度年循环(annual temperature cycle,ATC)模型的方法5类.统计回归方法通过建立晴空条件下LST和相关变量(如气温、风速)的回归方程来估算云下LST[11].随着机器学习的发展,回归工具从简单的线性回归扩展到人工神经网络(artificial neural network,ANN)模型[12]、极端梯度提升树(extreme gradient boosting,XGBoost)模型[13-14]等机器学习方法.基于LST时空信息的方法中包含时间重建算法、空间插值算法以及同时利用LST时间信息和空间信息的算法.时间重建算法中常在邻近时刻寻找与目标时刻的缺失像元具有相似时间变化的晴空像元,并利用晴空像元的信息重建目标时刻的LST[15].空间插值算法包括反距离加权[16]、样条函数[17]与克里金插值[18]等.由于时间重建算法与空间插值算法不适用于缺失值范围较大的情况,因而在其基础上,发展了同时利用时间信息与空间信息的算法[19⇓⇓-22].以上2类通常仅使用晴空LST的信息,仅得到LST的理论晴空值.基于地表能量平衡方程的方法根据相邻的晴空LST和气象数据计算云下LST.Jin等[23]使用地表能量平衡方程计算晴空LST与云下LST之间的差异,估计云下LST.然而,地表能量平衡模型的参数化存在很大的不确定性[24].基于被动微波的方法利用微波可以穿透云层的特点来获取云下LST[25-26].Zhang等[27]结合重建的被动微波亮度温度与热红外数据估计1 km全天候LST.然而被动微波数据的空间分辨率较低,对结果精度有一定程度的影响.基于ATC模型的方法通过构建LST的年变化曲线来估计云下LST,该方法可使用较少的观测值来估计LST的时间序列,适用于LST存在大量缺失值的情况.Zou等[28]将气温和归一化差异植被指数(normalized difference vegetation index,NDVI)引入传统的ATC模型,构建LST的时间变化曲线. ...
Enhanced modeling of annual temperature cycles with temporally discrete remotely sensed thermal observations
2
2018
... 云下LST重建的方法可分为统计回归方法、基于LST时空信息的方法、基于地表能量平衡方程的方法、基于被动微波的方法和基于温度年循环(annual temperature cycle,ATC)模型的方法5类.统计回归方法通过建立晴空条件下LST和相关变量(如气温、风速)的回归方程来估算云下LST[11].随着机器学习的发展,回归工具从简单的线性回归扩展到人工神经网络(artificial neural network,ANN)模型[12]、极端梯度提升树(extreme gradient boosting,XGBoost)模型[13-14]等机器学习方法.基于LST时空信息的方法中包含时间重建算法、空间插值算法以及同时利用LST时间信息和空间信息的算法.时间重建算法中常在邻近时刻寻找与目标时刻的缺失像元具有相似时间变化的晴空像元,并利用晴空像元的信息重建目标时刻的LST[15].空间插值算法包括反距离加权[16]、样条函数[17]与克里金插值[18]等.由于时间重建算法与空间插值算法不适用于缺失值范围较大的情况,因而在其基础上,发展了同时利用时间信息与空间信息的算法[19⇓⇓-22].以上2类通常仅使用晴空LST的信息,仅得到LST的理论晴空值.基于地表能量平衡方程的方法根据相邻的晴空LST和气象数据计算云下LST.Jin等[23]使用地表能量平衡方程计算晴空LST与云下LST之间的差异,估计云下LST.然而,地表能量平衡模型的参数化存在很大的不确定性[24].基于被动微波的方法利用微波可以穿透云层的特点来获取云下LST[25-26].Zhang等[27]结合重建的被动微波亮度温度与热红外数据估计1 km全天候LST.然而被动微波数据的空间分辨率较低,对结果精度有一定程度的影响.基于ATC模型的方法通过构建LST的年变化曲线来估计云下LST,该方法可使用较少的观测值来估计LST的时间序列,适用于LST存在大量缺失值的情况.Zou等[28]将气温和归一化差异植被指数(normalized difference vegetation index,NDVI)引入传统的ATC模型,构建LST的时间变化曲线. ...
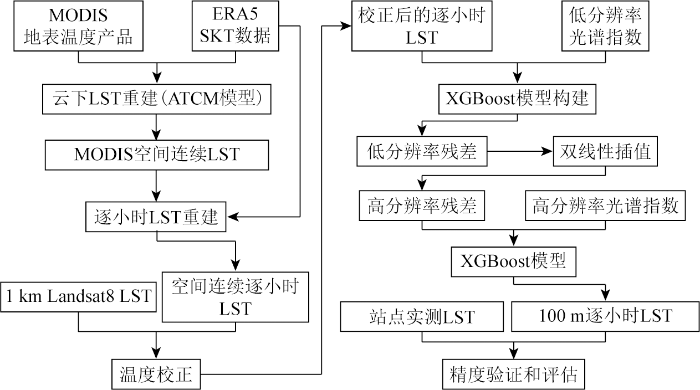
... 在传统的ATC模型中引入ERA5的SKT作为辅助变量,并利用晴空LST观测值、对应的天数以及SKT数据估计ATCM模型的参数,最后在ATCM模型中代入参数以及缺失值时刻,估计有云时刻的LST.LST和SKT的周期性年变化可表示为地球公转带来的稳定变化和局部天气变化引起的非稳定变化之和[28],计算公式为: ...
On the blending of the Landsat and MODIS surface reflectance:Predicting daily Landsat surface reflectance
1
2006
... 常用的LST空间降尺度方法可以分为2种类型: 时空融合算法和基于回归的方法.时空融合算法结合2种LST产品的高时间分辨率和高空间分辨率的特点,获取高时空分辨率的LST产品.Gao等[29]提出的时空自适应反射率融合模型(spatial and temporal adaptive reflectance fusion model,STARFM)用一对初始时刻的高/低空间分辨率图像和一张目标时刻的低空间分辨率图像作为输入,高空间分辨率像元值由邻近且同质的相似像元加权而来.STARFM算法应用于森林地区、农田地区以及作物和森林的混合区域的结果表明,该算法可以精确估计高空间分辨率数据.然而STARFM算法基于地表覆盖类型和系统误差在初始时刻至目标时刻内保持不变的假设,因此该算法在极度异质性区域的精度有所降低[30].为提高STARFM算法在异质性区域的精度,可在原先的基础上,再增加一对低/高空间分辨率图像,用于计算低/高空间分辨率图像之间的转换系数[31].时空融合算法的输入数据条件较难满足,与之相比,基于回归的方法适用范围更广.该方法基于尺度不变的假设,获取低空间分辨率的尺度因子与LST之间的回归关系,并利用回归关系与高空间分辨率的尺度因子重建高空间分辨率的LST.热图像锐化算法(thermal sharpening,TsHARP)中使用简单的一次多项式作为回归工具,并选择植被覆盖度作为尺度因子,该模型在植被区域的精度较高[10].为提高基于回归的方法在异质性区域的精度,有学者选择可见光—近红外波段的像元亮度值或反射率、光谱指数等作为尺度因子[32⇓⇓⇓-36].目前,基于回归的方法中的回归工具通常选择机器学习模型,例如ANN、随机森林模型和XGBoost模型[37⇓⇓-40]等. ...
Combining kernel-driven and fusion-based methods to generate daily high-spatial-resolution land surface temperatures
1
2019
... 常用的LST空间降尺度方法可以分为2种类型: 时空融合算法和基于回归的方法.时空融合算法结合2种LST产品的高时间分辨率和高空间分辨率的特点,获取高时空分辨率的LST产品.Gao等[29]提出的时空自适应反射率融合模型(spatial and temporal adaptive reflectance fusion model,STARFM)用一对初始时刻的高/低空间分辨率图像和一张目标时刻的低空间分辨率图像作为输入,高空间分辨率像元值由邻近且同质的相似像元加权而来.STARFM算法应用于森林地区、农田地区以及作物和森林的混合区域的结果表明,该算法可以精确估计高空间分辨率数据.然而STARFM算法基于地表覆盖类型和系统误差在初始时刻至目标时刻内保持不变的假设,因此该算法在极度异质性区域的精度有所降低[30].为提高STARFM算法在异质性区域的精度,可在原先的基础上,再增加一对低/高空间分辨率图像,用于计算低/高空间分辨率图像之间的转换系数[31].时空融合算法的输入数据条件较难满足,与之相比,基于回归的方法适用范围更广.该方法基于尺度不变的假设,获取低空间分辨率的尺度因子与LST之间的回归关系,并利用回归关系与高空间分辨率的尺度因子重建高空间分辨率的LST.热图像锐化算法(thermal sharpening,TsHARP)中使用简单的一次多项式作为回归工具,并选择植被覆盖度作为尺度因子,该模型在植被区域的精度较高[10].为提高基于回归的方法在异质性区域的精度,有学者选择可见光—近红外波段的像元亮度值或反射率、光谱指数等作为尺度因子[32⇓⇓⇓-36].目前,基于回归的方法中的回归工具通常选择机器学习模型,例如ANN、随机森林模型和XGBoost模型[37⇓⇓-40]等. ...
A flexible spatiotemporal method for fusing satellite images with different resolutions
1
2016
... 常用的LST空间降尺度方法可以分为2种类型: 时空融合算法和基于回归的方法.时空融合算法结合2种LST产品的高时间分辨率和高空间分辨率的特点,获取高时空分辨率的LST产品.Gao等[29]提出的时空自适应反射率融合模型(spatial and temporal adaptive reflectance fusion model,STARFM)用一对初始时刻的高/低空间分辨率图像和一张目标时刻的低空间分辨率图像作为输入,高空间分辨率像元值由邻近且同质的相似像元加权而来.STARFM算法应用于森林地区、农田地区以及作物和森林的混合区域的结果表明,该算法可以精确估计高空间分辨率数据.然而STARFM算法基于地表覆盖类型和系统误差在初始时刻至目标时刻内保持不变的假设,因此该算法在极度异质性区域的精度有所降低[30].为提高STARFM算法在异质性区域的精度,可在原先的基础上,再增加一对低/高空间分辨率图像,用于计算低/高空间分辨率图像之间的转换系数[31].时空融合算法的输入数据条件较难满足,与之相比,基于回归的方法适用范围更广.该方法基于尺度不变的假设,获取低空间分辨率的尺度因子与LST之间的回归关系,并利用回归关系与高空间分辨率的尺度因子重建高空间分辨率的LST.热图像锐化算法(thermal sharpening,TsHARP)中使用简单的一次多项式作为回归工具,并选择植被覆盖度作为尺度因子,该模型在植被区域的精度较高[10].为提高基于回归的方法在异质性区域的精度,有学者选择可见光—近红外波段的像元亮度值或反射率、光谱指数等作为尺度因子[32⇓⇓⇓-36].目前,基于回归的方法中的回归工具通常选择机器学习模型,例如ANN、随机森林模型和XGBoost模型[37⇓⇓-40]等. ...
Evaluation of the DisTrad thermal sharpening methodology for urban areas
1
2012
... 常用的LST空间降尺度方法可以分为2种类型: 时空融合算法和基于回归的方法.时空融合算法结合2种LST产品的高时间分辨率和高空间分辨率的特点,获取高时空分辨率的LST产品.Gao等[29]提出的时空自适应反射率融合模型(spatial and temporal adaptive reflectance fusion model,STARFM)用一对初始时刻的高/低空间分辨率图像和一张目标时刻的低空间分辨率图像作为输入,高空间分辨率像元值由邻近且同质的相似像元加权而来.STARFM算法应用于森林地区、农田地区以及作物和森林的混合区域的结果表明,该算法可以精确估计高空间分辨率数据.然而STARFM算法基于地表覆盖类型和系统误差在初始时刻至目标时刻内保持不变的假设,因此该算法在极度异质性区域的精度有所降低[30].为提高STARFM算法在异质性区域的精度,可在原先的基础上,再增加一对低/高空间分辨率图像,用于计算低/高空间分辨率图像之间的转换系数[31].时空融合算法的输入数据条件较难满足,与之相比,基于回归的方法适用范围更广.该方法基于尺度不变的假设,获取低空间分辨率的尺度因子与LST之间的回归关系,并利用回归关系与高空间分辨率的尺度因子重建高空间分辨率的LST.热图像锐化算法(thermal sharpening,TsHARP)中使用简单的一次多项式作为回归工具,并选择植被覆盖度作为尺度因子,该模型在植被区域的精度较高[10].为提高基于回归的方法在异质性区域的精度,有学者选择可见光—近红外波段的像元亮度值或反射率、光谱指数等作为尺度因子[32⇓⇓⇓-36].目前,基于回归的方法中的回归工具通常选择机器学习模型,例如ANN、随机森林模型和XGBoost模型[37⇓⇓-40]等. ...
A data mining approach for sharpening thermal satellite imagery over land
1
2012
... 常用的LST空间降尺度方法可以分为2种类型: 时空融合算法和基于回归的方法.时空融合算法结合2种LST产品的高时间分辨率和高空间分辨率的特点,获取高时空分辨率的LST产品.Gao等[29]提出的时空自适应反射率融合模型(spatial and temporal adaptive reflectance fusion model,STARFM)用一对初始时刻的高/低空间分辨率图像和一张目标时刻的低空间分辨率图像作为输入,高空间分辨率像元值由邻近且同质的相似像元加权而来.STARFM算法应用于森林地区、农田地区以及作物和森林的混合区域的结果表明,该算法可以精确估计高空间分辨率数据.然而STARFM算法基于地表覆盖类型和系统误差在初始时刻至目标时刻内保持不变的假设,因此该算法在极度异质性区域的精度有所降低[30].为提高STARFM算法在异质性区域的精度,可在原先的基础上,再增加一对低/高空间分辨率图像,用于计算低/高空间分辨率图像之间的转换系数[31].时空融合算法的输入数据条件较难满足,与之相比,基于回归的方法适用范围更广.该方法基于尺度不变的假设,获取低空间分辨率的尺度因子与LST之间的回归关系,并利用回归关系与高空间分辨率的尺度因子重建高空间分辨率的LST.热图像锐化算法(thermal sharpening,TsHARP)中使用简单的一次多项式作为回归工具,并选择植被覆盖度作为尺度因子,该模型在植被区域的精度较高[10].为提高基于回归的方法在异质性区域的精度,有学者选择可见光—近红外波段的像元亮度值或反射率、光谱指数等作为尺度因子[32⇓⇓⇓-36].目前,基于回归的方法中的回归工具通常选择机器学习模型,例如ANN、随机森林模型和XGBoost模型[37⇓⇓-40]等. ...
Hyperspectral imagery for disaggregation of land surface temperature with selected regression algorithms over different land use land cover scenes
1
2014
... 常用的LST空间降尺度方法可以分为2种类型: 时空融合算法和基于回归的方法.时空融合算法结合2种LST产品的高时间分辨率和高空间分辨率的特点,获取高时空分辨率的LST产品.Gao等[29]提出的时空自适应反射率融合模型(spatial and temporal adaptive reflectance fusion model,STARFM)用一对初始时刻的高/低空间分辨率图像和一张目标时刻的低空间分辨率图像作为输入,高空间分辨率像元值由邻近且同质的相似像元加权而来.STARFM算法应用于森林地区、农田地区以及作物和森林的混合区域的结果表明,该算法可以精确估计高空间分辨率数据.然而STARFM算法基于地表覆盖类型和系统误差在初始时刻至目标时刻内保持不变的假设,因此该算法在极度异质性区域的精度有所降低[30].为提高STARFM算法在异质性区域的精度,可在原先的基础上,再增加一对低/高空间分辨率图像,用于计算低/高空间分辨率图像之间的转换系数[31].时空融合算法的输入数据条件较难满足,与之相比,基于回归的方法适用范围更广.该方法基于尺度不变的假设,获取低空间分辨率的尺度因子与LST之间的回归关系,并利用回归关系与高空间分辨率的尺度因子重建高空间分辨率的LST.热图像锐化算法(thermal sharpening,TsHARP)中使用简单的一次多项式作为回归工具,并选择植被覆盖度作为尺度因子,该模型在植被区域的精度较高[10].为提高基于回归的方法在异质性区域的精度,有学者选择可见光—近红外波段的像元亮度值或反射率、光谱指数等作为尺度因子[32⇓⇓⇓-36].目前,基于回归的方法中的回归工具通常选择机器学习模型,例如ANN、随机森林模型和XGBoost模型[37⇓⇓-40]等. ...
Applicability of downscaling land surface temperature by using normalized difference sand index
1
2018
... 常用的LST空间降尺度方法可以分为2种类型: 时空融合算法和基于回归的方法.时空融合算法结合2种LST产品的高时间分辨率和高空间分辨率的特点,获取高时空分辨率的LST产品.Gao等[29]提出的时空自适应反射率融合模型(spatial and temporal adaptive reflectance fusion model,STARFM)用一对初始时刻的高/低空间分辨率图像和一张目标时刻的低空间分辨率图像作为输入,高空间分辨率像元值由邻近且同质的相似像元加权而来.STARFM算法应用于森林地区、农田地区以及作物和森林的混合区域的结果表明,该算法可以精确估计高空间分辨率数据.然而STARFM算法基于地表覆盖类型和系统误差在初始时刻至目标时刻内保持不变的假设,因此该算法在极度异质性区域的精度有所降低[30].为提高STARFM算法在异质性区域的精度,可在原先的基础上,再增加一对低/高空间分辨率图像,用于计算低/高空间分辨率图像之间的转换系数[31].时空融合算法的输入数据条件较难满足,与之相比,基于回归的方法适用范围更广.该方法基于尺度不变的假设,获取低空间分辨率的尺度因子与LST之间的回归关系,并利用回归关系与高空间分辨率的尺度因子重建高空间分辨率的LST.热图像锐化算法(thermal sharpening,TsHARP)中使用简单的一次多项式作为回归工具,并选择植被覆盖度作为尺度因子,该模型在植被区域的精度较高[10].为提高基于回归的方法在异质性区域的精度,有学者选择可见光—近红外波段的像元亮度值或反射率、光谱指数等作为尺度因子[32⇓⇓⇓-36].目前,基于回归的方法中的回归工具通常选择机器学习模型,例如ANN、随机森林模型和XGBoost模型[37⇓⇓-40]等. ...
Seasonal evaluation of downscaled land surface temperature:A case study in a humid tropical city
1
2019
... 常用的LST空间降尺度方法可以分为2种类型: 时空融合算法和基于回归的方法.时空融合算法结合2种LST产品的高时间分辨率和高空间分辨率的特点,获取高时空分辨率的LST产品.Gao等[29]提出的时空自适应反射率融合模型(spatial and temporal adaptive reflectance fusion model,STARFM)用一对初始时刻的高/低空间分辨率图像和一张目标时刻的低空间分辨率图像作为输入,高空间分辨率像元值由邻近且同质的相似像元加权而来.STARFM算法应用于森林地区、农田地区以及作物和森林的混合区域的结果表明,该算法可以精确估计高空间分辨率数据.然而STARFM算法基于地表覆盖类型和系统误差在初始时刻至目标时刻内保持不变的假设,因此该算法在极度异质性区域的精度有所降低[30].为提高STARFM算法在异质性区域的精度,可在原先的基础上,再增加一对低/高空间分辨率图像,用于计算低/高空间分辨率图像之间的转换系数[31].时空融合算法的输入数据条件较难满足,与之相比,基于回归的方法适用范围更广.该方法基于尺度不变的假设,获取低空间分辨率的尺度因子与LST之间的回归关系,并利用回归关系与高空间分辨率的尺度因子重建高空间分辨率的LST.热图像锐化算法(thermal sharpening,TsHARP)中使用简单的一次多项式作为回归工具,并选择植被覆盖度作为尺度因子,该模型在植被区域的精度较高[10].为提高基于回归的方法在异质性区域的精度,有学者选择可见光—近红外波段的像元亮度值或反射率、光谱指数等作为尺度因子[32⇓⇓⇓-36].目前,基于回归的方法中的回归工具通常选择机器学习模型,例如ANN、随机森林模型和XGBoost模型[37⇓⇓-40]等. ...
Downscaling land surface temperatures at regional scales with random forest regression
1
2016
... 常用的LST空间降尺度方法可以分为2种类型: 时空融合算法和基于回归的方法.时空融合算法结合2种LST产品的高时间分辨率和高空间分辨率的特点,获取高时空分辨率的LST产品.Gao等[29]提出的时空自适应反射率融合模型(spatial and temporal adaptive reflectance fusion model,STARFM)用一对初始时刻的高/低空间分辨率图像和一张目标时刻的低空间分辨率图像作为输入,高空间分辨率像元值由邻近且同质的相似像元加权而来.STARFM算法应用于森林地区、农田地区以及作物和森林的混合区域的结果表明,该算法可以精确估计高空间分辨率数据.然而STARFM算法基于地表覆盖类型和系统误差在初始时刻至目标时刻内保持不变的假设,因此该算法在极度异质性区域的精度有所降低[30].为提高STARFM算法在异质性区域的精度,可在原先的基础上,再增加一对低/高空间分辨率图像,用于计算低/高空间分辨率图像之间的转换系数[31].时空融合算法的输入数据条件较难满足,与之相比,基于回归的方法适用范围更广.该方法基于尺度不变的假设,获取低空间分辨率的尺度因子与LST之间的回归关系,并利用回归关系与高空间分辨率的尺度因子重建高空间分辨率的LST.热图像锐化算法(thermal sharpening,TsHARP)中使用简单的一次多项式作为回归工具,并选择植被覆盖度作为尺度因子,该模型在植被区域的精度较高[10].为提高基于回归的方法在异质性区域的精度,有学者选择可见光—近红外波段的像元亮度值或反射率、光谱指数等作为尺度因子[32⇓⇓⇓-36].目前,基于回归的方法中的回归工具通常选择机器学习模型,例如ANN、随机森林模型和XGBoost模型[37⇓⇓-40]等. ...
基于随机森林算法的地表温度降尺度研究
1
2018
... 常用的LST空间降尺度方法可以分为2种类型: 时空融合算法和基于回归的方法.时空融合算法结合2种LST产品的高时间分辨率和高空间分辨率的特点,获取高时空分辨率的LST产品.Gao等[29]提出的时空自适应反射率融合模型(spatial and temporal adaptive reflectance fusion model,STARFM)用一对初始时刻的高/低空间分辨率图像和一张目标时刻的低空间分辨率图像作为输入,高空间分辨率像元值由邻近且同质的相似像元加权而来.STARFM算法应用于森林地区、农田地区以及作物和森林的混合区域的结果表明,该算法可以精确估计高空间分辨率数据.然而STARFM算法基于地表覆盖类型和系统误差在初始时刻至目标时刻内保持不变的假设,因此该算法在极度异质性区域的精度有所降低[30].为提高STARFM算法在异质性区域的精度,可在原先的基础上,再增加一对低/高空间分辨率图像,用于计算低/高空间分辨率图像之间的转换系数[31].时空融合算法的输入数据条件较难满足,与之相比,基于回归的方法适用范围更广.该方法基于尺度不变的假设,获取低空间分辨率的尺度因子与LST之间的回归关系,并利用回归关系与高空间分辨率的尺度因子重建高空间分辨率的LST.热图像锐化算法(thermal sharpening,TsHARP)中使用简单的一次多项式作为回归工具,并选择植被覆盖度作为尺度因子,该模型在植被区域的精度较高[10].为提高基于回归的方法在异质性区域的精度,有学者选择可见光—近红外波段的像元亮度值或反射率、光谱指数等作为尺度因子[32⇓⇓⇓-36].目前,基于回归的方法中的回归工具通常选择机器学习模型,例如ANN、随机森林模型和XGBoost模型[37⇓⇓-40]等. ...
基于随机森林算法的地表温度鲁棒降尺度方法
1
2020
... 常用的LST空间降尺度方法可以分为2种类型: 时空融合算法和基于回归的方法.时空融合算法结合2种LST产品的高时间分辨率和高空间分辨率的特点,获取高时空分辨率的LST产品.Gao等[29]提出的时空自适应反射率融合模型(spatial and temporal adaptive reflectance fusion model,STARFM)用一对初始时刻的高/低空间分辨率图像和一张目标时刻的低空间分辨率图像作为输入,高空间分辨率像元值由邻近且同质的相似像元加权而来.STARFM算法应用于森林地区、农田地区以及作物和森林的混合区域的结果表明,该算法可以精确估计高空间分辨率数据.然而STARFM算法基于地表覆盖类型和系统误差在初始时刻至目标时刻内保持不变的假设,因此该算法在极度异质性区域的精度有所降低[30].为提高STARFM算法在异质性区域的精度,可在原先的基础上,再增加一对低/高空间分辨率图像,用于计算低/高空间分辨率图像之间的转换系数[31].时空融合算法的输入数据条件较难满足,与之相比,基于回归的方法适用范围更广.该方法基于尺度不变的假设,获取低空间分辨率的尺度因子与LST之间的回归关系,并利用回归关系与高空间分辨率的尺度因子重建高空间分辨率的LST.热图像锐化算法(thermal sharpening,TsHARP)中使用简单的一次多项式作为回归工具,并选择植被覆盖度作为尺度因子,该模型在植被区域的精度较高[10].为提高基于回归的方法在异质性区域的精度,有学者选择可见光—近红外波段的像元亮度值或反射率、光谱指数等作为尺度因子[32⇓⇓⇓-36].目前,基于回归的方法中的回归工具通常选择机器学习模型,例如ANN、随机森林模型和XGBoost模型[37⇓⇓-40]等. ...
基于XGBoost的LST空间降尺度方法
1
2021
... 常用的LST空间降尺度方法可以分为2种类型: 时空融合算法和基于回归的方法.时空融合算法结合2种LST产品的高时间分辨率和高空间分辨率的特点,获取高时空分辨率的LST产品.Gao等[29]提出的时空自适应反射率融合模型(spatial and temporal adaptive reflectance fusion model,STARFM)用一对初始时刻的高/低空间分辨率图像和一张目标时刻的低空间分辨率图像作为输入,高空间分辨率像元值由邻近且同质的相似像元加权而来.STARFM算法应用于森林地区、农田地区以及作物和森林的混合区域的结果表明,该算法可以精确估计高空间分辨率数据.然而STARFM算法基于地表覆盖类型和系统误差在初始时刻至目标时刻内保持不变的假设,因此该算法在极度异质性区域的精度有所降低[30].为提高STARFM算法在异质性区域的精度,可在原先的基础上,再增加一对低/高空间分辨率图像,用于计算低/高空间分辨率图像之间的转换系数[31].时空融合算法的输入数据条件较难满足,与之相比,基于回归的方法适用范围更广.该方法基于尺度不变的假设,获取低空间分辨率的尺度因子与LST之间的回归关系,并利用回归关系与高空间分辨率的尺度因子重建高空间分辨率的LST.热图像锐化算法(thermal sharpening,TsHARP)中使用简单的一次多项式作为回归工具,并选择植被覆盖度作为尺度因子,该模型在植被区域的精度较高[10].为提高基于回归的方法在异质性区域的精度,有学者选择可见光—近红外波段的像元亮度值或反射率、光谱指数等作为尺度因子[32⇓⇓⇓-36].目前,基于回归的方法中的回归工具通常选择机器学习模型,例如ANN、随机森林模型和XGBoost模型[37⇓⇓-40]等. ...
Evaluation of ASTER and MODIS land surface temperature and emissivity products using long-term surface longwave radiation observations at SURFRAD sites
1
2009
... 地面站点数据用于验证全天候逐时100 m尺度LST重构的精度.本文选用的地面站点数据为SURFRAD数据(https://gml.noaa.gov/grad/surfrad/).地面站点LST的测量精度约为0.5~0.8 K[41].LST由SURFRAD提供的长波上/下行辐射数据计算得到,即 ...
New refinements and validation of the collection-6 MODIS land-surface temperature/emissivity product
1
2014
... 本研究选用MODIS LST产品MOD11A1和MYD11A1(第6版)作为LST观测数据(https://lpdaac.usgs.gov/).MOD11A1/MYD11A1的LST的精度约为2 K[42].在大多数地区,MODIS可以在1 d内提供4次1 km空间分辨率的观测数据,Terra过境时间约为当地时间上午10:30和下午10:30,Aqua的过境时间为当地时间下午13:30和凌晨1:30.MOD11A1/MYD11A1中不仅提供LST,还提供LST的昼/夜观测时间.本研究下载了美国地区2019年全年的MOD11A1和MYD11A1数据. ...
The ERA5 global reanalysis
1
2020
... 大气再分析数据选择ERA5欧洲中期天气预报中心(european centre for medium-range weather forecasts,ECMWF)全球气候大气再分析资料的第五代产品[43](https://cds.climate.copernicus.eu/).从中选择表皮温度(skin temperature,SKT)作为全天候逐小时LST重建方法的辅助数据,SKT的空间分辨率为0.25°,时间分辨率为1 h.本研究中下载了美国地区2019年全年逐小时SKT数据.SKT代表地表最上层的温度[44],其与MODIS反演获取的LST是同一个物理概念.因为ERA5的SKT是结合观测资料、气象模型和数据同化技术后计算出的LST,因此其不属于直接测量值,在观测资料较少等情况下会存在一定的误差.相较而言,ERA5的SKT的精度不如MODIS直接观测的LST产品的精度高,但可以认为其变化趋势基本正确,由此可以对全天逐小时LST变化进行重构. ...
Effects of soil parameterization on permafrost modeling in the Qinghai-Tibet Plateau:A calibration-constrained analysis
1
2023
... 大气再分析数据选择ERA5欧洲中期天气预报中心(european centre for medium-range weather forecasts,ECMWF)全球气候大气再分析资料的第五代产品[43](https://cds.climate.copernicus.eu/).从中选择表皮温度(skin temperature,SKT)作为全天候逐小时LST重建方法的辅助数据,SKT的空间分辨率为0.25°,时间分辨率为1 h.本研究中下载了美国地区2019年全年逐小时SKT数据.SKT代表地表最上层的温度[44],其与MODIS反演获取的LST是同一个物理概念.因为ERA5的SKT是结合观测资料、气象模型和数据同化技术后计算出的LST,因此其不属于直接测量值,在观测资料较少等情况下会存在一定的误差.相较而言,ERA5的SKT的精度不如MODIS直接观测的LST产品的精度高,但可以认为其变化趋势基本正确,由此可以对全天逐小时LST变化进行重构. ...
XGBoost:A scalable tree boosting system
1
... 本研究中,使用XGBoost作为回归模型.XGBoost引入正则项和列采样,不仅增强模型的鲁棒性,防止模型过拟合,而且提高了模型的运行速度[45].该模型已成功应用于地下水污染源监测[46]、山洪风险评估[47]以及降水短期预报[48]等领域.XGBoost的基本思想是利用 个回归树对样本进行预测,即 ...
Groundwater contaminant source identification based on an ensemble learning search framework associated with an auto XGBoost surrogate
1
2023
... 本研究中,使用XGBoost作为回归模型.XGBoost引入正则项和列采样,不仅增强模型的鲁棒性,防止模型过拟合,而且提高了模型的运行速度[45].该模型已成功应用于地下水污染源监测[46]、山洪风险评估[47]以及降水短期预报[48]等领域.XGBoost的基本思想是利用 个回归树对样本进行预测,即 ...
XGBoost-based method for flash flood risk assessment
1
2021
... 本研究中,使用XGBoost作为回归模型.XGBoost引入正则项和列采样,不仅增强模型的鲁棒性,防止模型过拟合,而且提高了模型的运行速度[45].该模型已成功应用于地下水污染源监测[46]、山洪风险评估[47]以及降水短期预报[48]等领域.XGBoost的基本思想是利用 个回归树对样本进行预测,即 ...
Enhancing short-term forecasting of daily precipitation using numerical weather prediction bias correcting with XGBoost in different regions of China
1
2023
... 本研究中,使用XGBoost作为回归模型.XGBoost引入正则项和列采样,不仅增强模型的鲁棒性,防止模型过拟合,而且提高了模型的运行速度[45].该模型已成功应用于地下水污染源监测[46]、山洪风险评估[47]以及降水短期预报[48]等领域.XGBoost的基本思想是利用 个回归树对样本进行预测,即 ...


