

0 引言
人类活动对生态环境产生很大影响,而良好的生态环境质量是人类生存和发展的重要前提,因此为了人类更好地生存与发展需要对生态环境质量进行监测与评估[1-2]。近年来,因为单一指标难以综合评价生态环境质量状况,所以诸多国内外学者主要耦合多个生态因子对生态环境质量进行监测与评价。当前国内主要利用层次分析法[3]和遗传投影寻踪模型结合地理信息系统[4]等方法对地区生态环境质量进行评价,或者用一些生态指数,如遥感生态指数(remote sensing ecological index,RSEI) [5⇓⇓⇓-9]、改进型遥感生态指数[10⇓-12]、热岛比例指数(urban-heat-island ratio index,URI)[13]、城市生态环境状况指数(city ecological index,CEI)[14]等对城市生态环境开展研究,且取得了良好的成果。
综上,目前国内外对城市生态环境质量研究利用的模型相对比较复杂,在此基础上很少有学者在生态要素方面研究城市之间的相似程度,并将其作为相似度高的城市可采用相同或相似的生态环境政策以提高当地生态环境质量的科学依据,进而提高城市管理的效率。本文利用绿色空间、蓝色空间、建筑及不透水地表面构建一种新的遥感绿色指数(remote sensing green index,RSGI)对南京市进行生态环境质量评价。在此基础上,分析多种城市生态要素与RSGI的相关程度,并探究南京市在生态要素方面各区的相似程度。本文以期丰富我国生态环境质量理论研究成果,进一步提出城市生态环境质量建设的对策建议,具有一定的理论和实践意义。
1 研究区概况及数据源
1.1 研究区概况
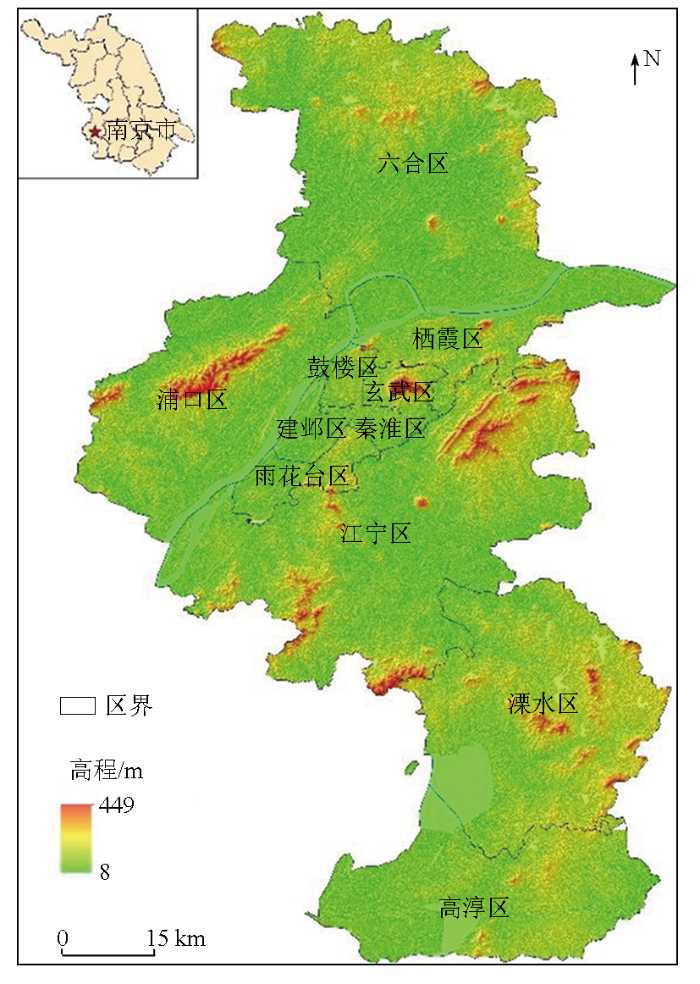
图1
1.2 数据源及其预处理
本研究使用数据源: ①欧洲航天局哥白尼开放数据访问中心(
表1 数据来源
Tab.1
| 数据类型 | 数据名称 | 时间 | 来源 |
|---|---|---|---|
| 栅格数据 | Sentinel-2A遥感影像 | 2021年 | 欧洲航天局哥白尼开放数据访问中心 |
| 矢量数据 | 县界矢量边界 | 2015年 | 中国科学院资源环境科学与数据中心 |
| 栅格数据 | 人口密度1 km× 1 km网格数据 | 2019年 | 中国科学院资源环境科学与数据中心 |
| 栅格数据 | GDP分布1 km× 1 km网格数据 | 2019年 | 中国科学院资源环境科学与数据中心 |
2 研究方法
2.1 RSGI指数构建
本研究所采用的RSGI模型是基于Silva等[16]使用城市内部要素之间的比例来评估当地生态环境,根据研究区实际情况改进后构建的。对于城市来说,城市绿地、水域、建筑以及不透水地表面占据城市绝大部分空间,这4者间的关系对某一地区生态环境质量产生直接影响。利用这4种要素面积进行RSGI模型的构建,并以此结果尝试对城市的生态环境质量进行分级。本研究采用蓝绿空间和不透水地表面之比(proportion of blue green space to impervious surface, BGIP)以及蓝绿空间和建筑空间之比(proportion of blue green space and buildings, BGBP)构建RSGI,公式为:
式中: a为绿色空间面积; b为蓝色空间面积; c为不透水地表面面积; d为建筑空间面积。
表2是根据RSGI值的范围对研究区的城市生态环境质量进行的分级。
表2 生态环境质量分级标准
Tab.2
| 生态环境质量等级 | RSGI值范围 |
|---|---|
| 低生态环境质量 | [0.0,0.2) |
| 较低生态环境质量 | [0.2,0.5) |
| 较高生态环境质量 | [0.5,0.8) |
| 高生态环境质量 | [0.8,1.0] |
2.2 皮尔逊相关系数分析
式中:
2.3 聚合层次聚类分析
层次聚类分为聚合层次聚类和分裂层次聚类[19]。本文采用的是欧式最长距离法聚合层次聚类,以南京市11个区的RSGI,绿色空间密度、蓝色空间密度、城市建筑密度和不透水地表面密度为变量,得到各区之间的相似程度谱系图。聚合层次聚类是一种自下而上的算法,首先将每个样本都视为一个簇,然后开始按一定规则,将相似度高的簇进行合并,当所有样本都形成一个簇时,算法结束[20]。确定簇与簇之间的相似度是该算法的要点,而这里的相似度是由簇间距离来确定的,簇间距离短的相似度高,簇间距离长的相似度低[21]。簇与簇之间的相似程度有最短距离法和最长距离法等[22]。假设第p类和第q类合并成第t类,第t类与其他各种旧类l的距离按最长距离法为:
式中:
2.4 生态要素密度
本研究利用建筑密度、不透水地表面密度、绿色空间密度和蓝色空间密度生态要素的密度都是根据对应生态要素面积和区域总面积的比例求得。具体公式为:
式中:
3 结果与分析
3.1 南京市土地覆盖类别分类结果
图2
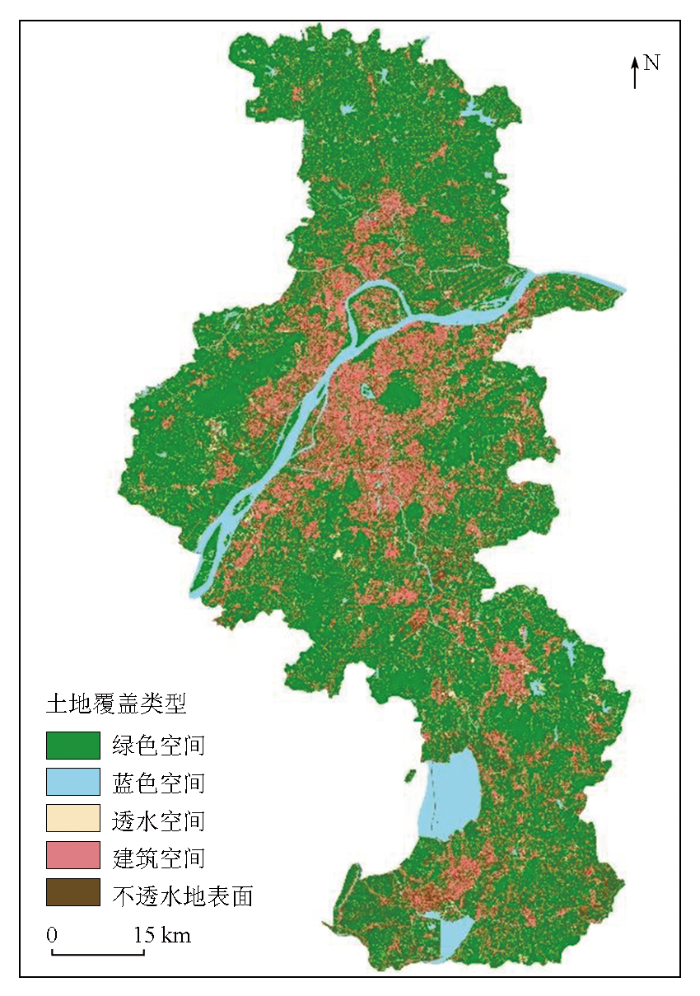
由图2可知,沿长江地区和城市中心部分建筑以及不透水地表面覆盖类别密度最高。由这部分向外延伸,距离这些地区越远的区域,建筑以及不透水地表面覆盖类别密度越低,绿色空间覆盖类别密度越高。蓝色空间主要分布在长江流域和2个湖泊地区。经统计,南京市绿色空间面积为3 754.7 km2; 蓝色空间面积为551.2 km2; 不透水地表面面积为686.9 km2; 透水空间面积为185.9 km2; 建筑面积为1 410.2km2。绿色空间面积接近建筑面积和不透水表面面积之和的2倍,同时也超过南京市总面积的一半,表明南京市注重绿色空间的构建,居民生态环境是良好的。
3.2 南京市城市生态环境质量空间变化分析
表3 南京市及各区RSGI统计
Tab.3
| 地区 | BGIP | BGBP | RSGI | 绿色空间密度 | 蓝色空间密度 |
|---|---|---|---|---|---|
| 秦淮区 | 0.51 | 0.25 | 0.38 | 0.16 | 0.03 |
| 鼓楼区 | 0.59 | 0.27 | 0.43 | 0.16 | 0.06 |
| 建邺区 | 0.68 | 0.49 | 0.59 | 0.23 | 0.15 |
| 雨花台区 | 0.74 | 0.51 | 0.62 | 0.39 | 0.03 |
| 栖霞区 | 0.81 | 0.60 | 0.71 | 0.39 | 0.12 |
| 玄武区 | 0.84 | 0.62 | 0.73 | 0.50 | 0.04 |
| 高淳区 | 0.78 | 0.76 | 0.77 | 0.51 | 0.10 |
| 江宁区 | 0.87 | 0.75 | 0.81 | 0.60 | 0.05 |
| 溧水区 | 0.88 | 0.79 | 0.83 | 0.57 | 0.11 |
| 浦口区 | 0.89 | 0.80 | 0.84 | 0.61 | 0.09 |
| 六合区 | 0.91 | 0.82 | 0.86 | 0.66 | 0.08 |
| 南京市 | 0.86 | 0.75 | 0.81 | 0.57 | 0.08 |
图3
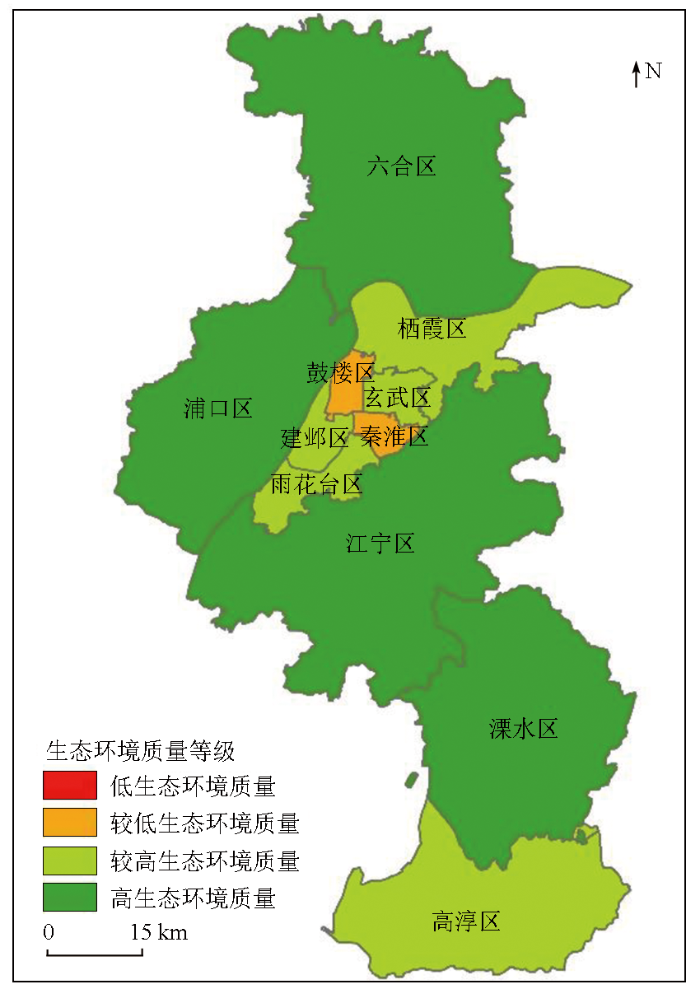
图3
南京市各区生态环境质量等级图
Fig.3
Ecological environment quality level map of various districts in Nanjing City
南京市有9个区的RSGI值在0.5以上,秦淮区和鼓楼区这2个区的RSGI值没有达到0.5但也超过0.2,且南京市总体RSGI值也达到0.81,证明南京市总体生态环境质量好。RSGI值超过0.5的9个区的蓝绿空间密度之和超过0.3,可被认为是良好的生态环境质量地区。RSGI值超过0.7的7个区,蓝绿空间密度之和超过0.5。而当一个地区蓝绿空间之和占比超过50%时可以有效控制大气中污染物,表明玄武区等7个RSGI值超过0.7的区,其大气质量优于其他4个区。
由图3可知,秦淮区和鼓楼区是较低生态环境质量地区,集中在南京市中心区域。高淳区现阶段为较高生态环境质量等级,但其RSGI值为0.77,接近高生态环境质量等级RSGI值,因此南京市生态环境质量呈现内部低外部高的趋势。
3.3 城市生态要素与遥感绿色指数的相关程度分析
表4 南京市各区生态要素统计表
Tab.4
| 地区 | RSGI | 人口密度/ (人·km-2) | 建筑 密度 | 不透水地 表面密度 | 蓝色空 间密度 | 绿色空 间密度 |
|---|---|---|---|---|---|---|
| 秦淮区 | 0.38 | 14 490 | 0.58 | 0.19 | 0.03 | 0.16 |
| 鼓楼区 | 0.43 | 17 423 | 0.60 | 0.15 | 0.06 | 0.16 |
| 建邺区 | 0.59 | 3 283 | 0.40 | 0.18 | 0.15 | 0.23 |
| 雨花台区 | 0.62 | 1 835 | 0.40 | 0.15 | 0.03 | 0.39 |
| 栖霞区 | 0.71 | 1 101 | 0.34 | 0.11 | 0.12 | 0.39 |
| 玄武区 | 0.73 | 6 755 | 0.33 | 0.10 | 0.04 | 0.50 |
| 高淳区 | 0.77 | 542 | 0.19 | 0.17 | 0.10 | 0.51 |
| 江宁区 | 0.81 | 607 | 0.22 | 0.10 | 0.05 | 0.60 |
| 溧水区 | 0.83 | 394 | 0.18 | 0.10 | 0.11 | 0.57 |
| 浦口区 | 0.84 | 650 | 0.18 | 0.08 | 0.09 | 0.61 |
| 六合区 | 0.86 | 602 | 0.17 | 0.08 | 0.08 | 0.66 |
表5 RSGI与生态要素之间的皮尔逊相关系数分析
Tab.5
| 生态要素 | 指标 | RSGI | 人口密度 | 建筑密度 | 不透水地表 面密度 | 蓝色空间 密度 | 绿色空间 密度 |
|---|---|---|---|---|---|---|---|
| RSGI | 皮尔逊相关性 | 1 | -0.867**① | -0.981** | -0.783** | 0.297 | 0.969** |
①**表示在 0.01 级别(双尾)相关性显著; *表示在 0.05 级别(双尾)相关性显著[
由表5可知,RSGI与绿色空间密度、建筑密度、人口密度、不透水地表面密度和蓝色空间密度的皮尔逊相关系数分别为0.969,-0.981,-0.867,-0.783和0.297。RSGI和绿色空间密度呈0.01级别显著性正相关,说明绿色空间密度和RSGI正相关程度高。RSGI与蓝色空间密度的相关系数仅为0.297,没有达到0.05级别显著性正相关,说明蓝色空间密度和RSGI相关程度低。RSGI和建筑密度、不透水地表面密度及人口密度呈0.01级别显著性负相关,说明建筑密度、不透水地表面密度及人口密度和RSGI负相关程度高。
人口要素没有参加RSGI模型的构建,但人口密度与RSGI的相关程度超过参与模型构建中的不透水地表面密度与RSGI之间相关程度。将人口密度及GDP数据根据表6人口密度及GDP分级标准分级,结果如图4所示。由图3和图4(a)可知,RSGI值高的地区,人口密度低; RSGI值低的地区,人口密度高。结合图4(b)南京市GDP分布图,发现GDP分布趋势与人口密度分布趋势近乎一致,经济好的地区RSGI低于其他区。溧水区的人口密度与RSGI之间的关系和其他区一样,但其范围内大部分地区的GDP等级为较低,甚至有部分地区达到了中等级别。这表明一个地区能同时拥有较高的GDP和不错的生态环境质量。南京市其他地区可以学习溧水区的生态环境政策和土地利用结构。在经济低的地区,提高GDP的同时维持生态环境质量; 在经济高的地区,改善生态环境质量的同时维持较高的GDP。
表6 人口密度及GDP分级标准
Tab.6
| 分级 | 人口密度/(人·km-2) | GDP/(万元·km-2) |
|---|---|---|
| 低 | [0,600) | [0,5 000) |
| 较低 | [600,1 000) | [5 000,15 000) |
| 中等 | [1 000,2 000) | [15 000,30 000) |
| 较高 | [2 000,10 000) | [30 000,50 000) |
| 高 | [10 000,∞) | [50 000,∞) |
图4
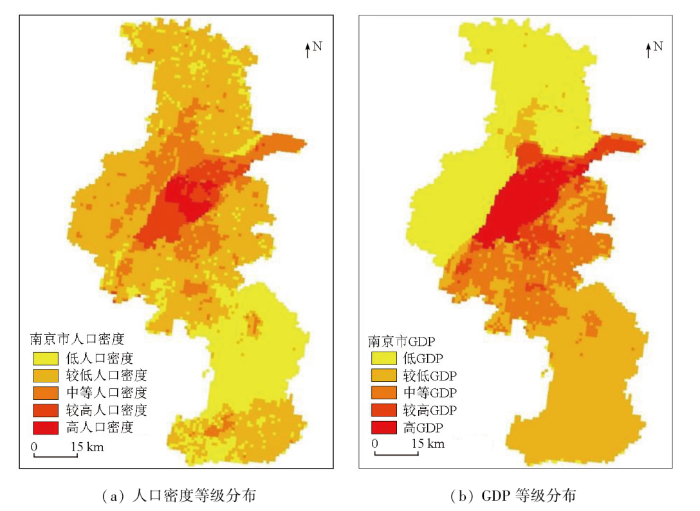
图4
南京市人口密度及GDP等级分布图
Fig.4
Population density and GDP level distribution map of Nanjing City
3.4 南京市各区在生态要素方面相似程度分析
以每个区RSGI、绿色空间密度、蓝色空间密度、建筑密度和不透水地表面密度为变量,进行欧氏最长距离法聚合层次聚类,得到南京市各区谱系图,如图5所示。从谱系图中可以看出,南京市11个区在城市内部要素方面以70%相似度为阈值可大体划分为4个集合,其中第一集合为秦淮区、鼓楼区和建邺区,第二集合为雨花台区和栖霞区,第三集合为玄武区和高淳区,第四集合为其他4区。建邺区的生态环境质量等级为较高生态环境质量等级,但其与秦淮区和鼓楼区2个较低生态环境质量等级地区的相似度高,表明其生态环境质量有下降危险,同时表明管理者可以运用建邺区的生态环境措施对较低生态环境质量地区进行生态环境质量提升。秦淮区、鼓楼区和建邺区3个区与其他8个生态环境质量等级为较好及以上等级地区的相似度低,表明对生态环境质量高或较高地区相应的生态环境政策直接用于这3个区是较难达到预期效果,所以需要实施相应的改善生态的措施。
图5
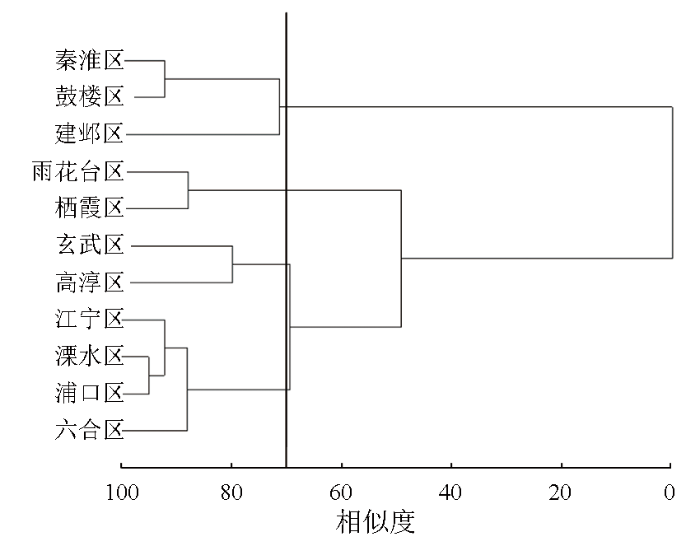
图5
南京市各区聚合层次聚类分析谱系图
Fig.5
Family tree of aggregated hierarchical clustering analysis in various districts of Nanjing
4 结论
本文在提取南京市内部多种生态要素的基础上,构建了一种新的RSGI模型,该指数比传统的生态环境质量评价模型计算更为简单和高效,且能够客观地分析城市生态环境质量,并初次应用到城市生态环境质量评价; 探究了RSGI与各生态要素间的相关性,分析了南京市各区的相似程度。主要结论有:
1)南京市总体RSGI值为0.81,达到高生态环境质量等级,说明南京市总体生态环境质量好。中心区域比其他区域RSGI值低,表明南京市中心区域的生态环境质量不如其他区域。生态环境质量等级最高地区为六合区,RSGI值为0.86,最低地区为秦淮区,RSGI值为0.38,差值达0.48,表明南京市内部各区间生态环境质量差距较大。
2)分析南京市内部生态要素与RSGI关系,发现绿色空间密度、建筑密度、人口密度及不透水地表面密度与RSGI为0.001级别相关程度,表明这4类生态要素对RSGI具有较大影响。生态要素结合GDP发现溧水区的城市结构是较优的,其他区可以借鉴进行城市结构优化。
3)秦淮区、鼓楼区与建邺区相似度高,表明这3区可以用相似生态环境政策来提升生态环境质量。这3个区与其他地区相似度低,说明这3个地区的内部结构与其他地区差异性较大; 因此,这3个地区进行城市生态环境建设时应因地制宜,从而达到生态环境质量改善目的。
研究结果将为城市管理者采取差异化的生态环境措施提供科学依据,从而提高城市规划与管理的科学性。
参考文献
基于改进遥感生态指数的黄山市生态质量评价研究
[J].
Research on ecological quality evaluation of Huangshan City based on improved remote sensing ecological index
[J].
中国生态环境状况与生态文明建设
[J].
The ecological environment conditions and construction of an ecological civilization in China
[J].
Evaluation and planning of urban geological and ecological environment quality
[J].
Evaluation of eco-environmental quality for the coal-mining region using multi-source data
[J].
DOI:10.1038/s41598-022-09795-5
PMID:35459255
[本文引用: 1]

The contradiction between the exploitation of coal resources and the protection of the ecological environment in western China is becoming increasingly prominent. Reasonable ecological environment evaluation is the premise for alleviating this contradiction. First, this paper evaluates the eco-environment of Ibei coalfield by combining the genetic projection pursuit model and geographic information system (GIS) and using remote sensing image data and other statistical data of this area. The powerful spatial analysis function of GIS and the advantages of the genetic projection pursuit model in weight calculation have been fully used to improve the reliability of the evaluation results. Furthermore, spatial autocorrelation is used to analyze the spatial characteristics of ecological environment quality in the mining area and plan the specific governance scope. The geographic detector is used to determine the driving factors of the eco-environment of the mining area. The results show that Ibei Coalfield presents a spatially heterogeneous eco-environment pattern. The high-intensity mining area (previously mined area of Ili No.4 Coal Mine) has the worst ecological environment quality, followed by the coal reserve area of Ili No.4 Coal Mine and the planned survey area of Ili No.5 Coal Mine. The eco-environment quality (EEQ) of the study area is affected by both human and natural factors. Mining intensity and surface subsidence are the main human factors affecting the ecological environment in the study area. The main natural factors affecting the ecological environment in the study area are annual average precipitation, elevation, annual average evaporation, NDVI and land use type. Meanwhile, the interaction effect of any two indicators is greater than that of a single indicator. It is also indicated that the eco-environment of the mining area is nonlinearly correlated to impact indicators. The spatial autocorrelation analysis shows three areas that should be treated strategically that are the management area, close attention area and protective area. Corresponding management measures are put forward for different regions. This paper can provide scientific references for mining area eco-environmental protection, which is significant for the sustainability of coal mine projects.© 2022. The Author(s).
京津冀地区城市绿色空间与生态环境质量时空演变规律探讨
[J].
Spatiotemporal evolution of urban green space and ecological quality in Beijing-Tianjin-Hebei region
[J].
基于GIS和RS的银川市城市生态环境质量动态监测与评价
[J].
Monitoring and evaluation of ecology and environment quality of Yinchuan City based on GIS and RS
[J].
黄河流域生态环境质量时空格局与演变趋势
[J].
Spatio-temporal pattern and evolution trend of ecological environment quality in the Yellow River basin
[J].
Monitoring and evaluation of eco-environment quality based on remote sensing-based ecological index (RSEI) in Taihu Lake basin,China
[J].
Assessment of ecological environment quality in Kolkata urban agglomeration,India
[J].
Decision support system based on spatial and temporal pattern evolution of ecological environmental quality in the Yellow River Delta from 2000 to 2020
[J].
顾及PM2.5浓度遥感生态指数模型的沧州市区生态环境质量动态监测分析
[J].
Dynamic monitoring and analysis of ecological environment change in Cangzhou City based on RSEI model considering PM2.5 concentration
[J].
Ecological environment quality evaluation and evolution analysis of a rare earth mining area under different disturbance conditions
[J].
干旱区地表温度和热岛效应演变研究——以宁夏沿黄城市带为例
[J].
Evolution of surface temperature and heat island effect in arid areas:A case of city belt along the Yellow River in Ningxia
[J].
基于CEI的城市生态环境状况评价——以福建省为例
[J].
Evaluation of urban ecological environment:A case study of Fujian Province based on CEI
[J].
基于FLUS和InVEST模型的南京市生境质量多情景预测
[J].
Multi-scenario prediction of habitat quality in Nanjing based on FLUS and InVEST models
[J].
Indicadores de floresta urbana a partir de imagens aereas multiespectrais de alta resolucao
[J].
CEM的波段选择方法研究及应用
[J].
Research and application of band selection method based on CEM
[J].
基于泉群流量与降水量相关性的明水泉域岩溶水强径流带识别
[J].
Identification of Karst water strong runoff zone in Mingshui spring area based on correlation between spring discharge and precipitation
[J].
基于多特征指标和层次聚类分析的河源区范围自动划分方法研究
[J].
DOI:10.12082/dqxxkx.2022.210334
[本文引用: 1]
河源区边界是重要的国家基础地理信息之一,但除长江、黄河等大江大河外的我国大部分其他中小流域仍缺乏确切的河源区边界信息,需要科学划定河源区边界以支持流域水生态保护相关政策的规划与实施。对此,本文在确立河源区划分原则、明确划分依据的基础上,提出了基于多特征指标和层次聚类分析法的河源区边界划定方法。以沁河流域为研究案例,首先利用均值变点分析法计算沁河流域子流域提取的最佳汇流累积量分位数阈值为0.15%,再基于子流域的多特征指标运用层次聚类分析法最终确定河源区范围边界,并将该方法应用于长江、黄河流域进行验证分析。结果表明:① 基于多特征指标和层次聚类分析提取的沁河流域河源区范围处于河底比降法、水文站点方法得到的源区范围面积之间;② 该方法在长江、黄河流域河源区划分结果的交并比分别达到85.40%和79.99%,侧面验证了本文方法进行河源区边界划分的合理性与适用性。基于多特征指标和层次聚类分析的河源区边界自动划分方法可以简捷高效地识别缺乏明确河源区边界信息的流域河源区范围,为我国河源区生态安全屏障识别、水资源保护相关政策的规划和实施提供科学支撑。
Automatic extraction of river source region boundary based on multi-characteristic indexes and hierarchical cluster analysis
[J].
高维数据聚类中相似性度量方法的研究
[J].
Research on similarity measurement method in high-dimensional data clustering
[J].
聚类分析在江苏沿海地区土地利用分区中的应用
[J].
Application of clustering analysis to land use zoning of coastal region in Jiangsu Province
[J].
Assessing cyclone disturbances (1988—2016) in the Sundarbans mangrove forests using Landsat and Google Earth Engine
[J].
基于多源遥感数据的城市热环境响应与归因分析——以深圳市为例
[J].
The study of urban thermal environment dynamics and attribution analysis based on multiple remote sensing dataset:In the case of Shenzhen
[J].
郑州市景观水体东风渠绿藻水华污染特征及营养盐效应
[J].
Contaminative characteristics and nutrient effect of green algae in the landscape waterbody of Dongfeng River in Zhengzhou City
[J].
