Assessment of urban ecological quality based on the remote sensing green index: A case study of Nanjing City
PAN Jinyin1(), WANG Shidong1, FAN Qinhe2()
1. School of Surveying,Mapping and Land Information Engineering, Henan Polytechnic University, Jiaozuo 454000, China 2. Party School of Jiaozuo Municipal Committee of CPC, Jiaozuo 454000, China
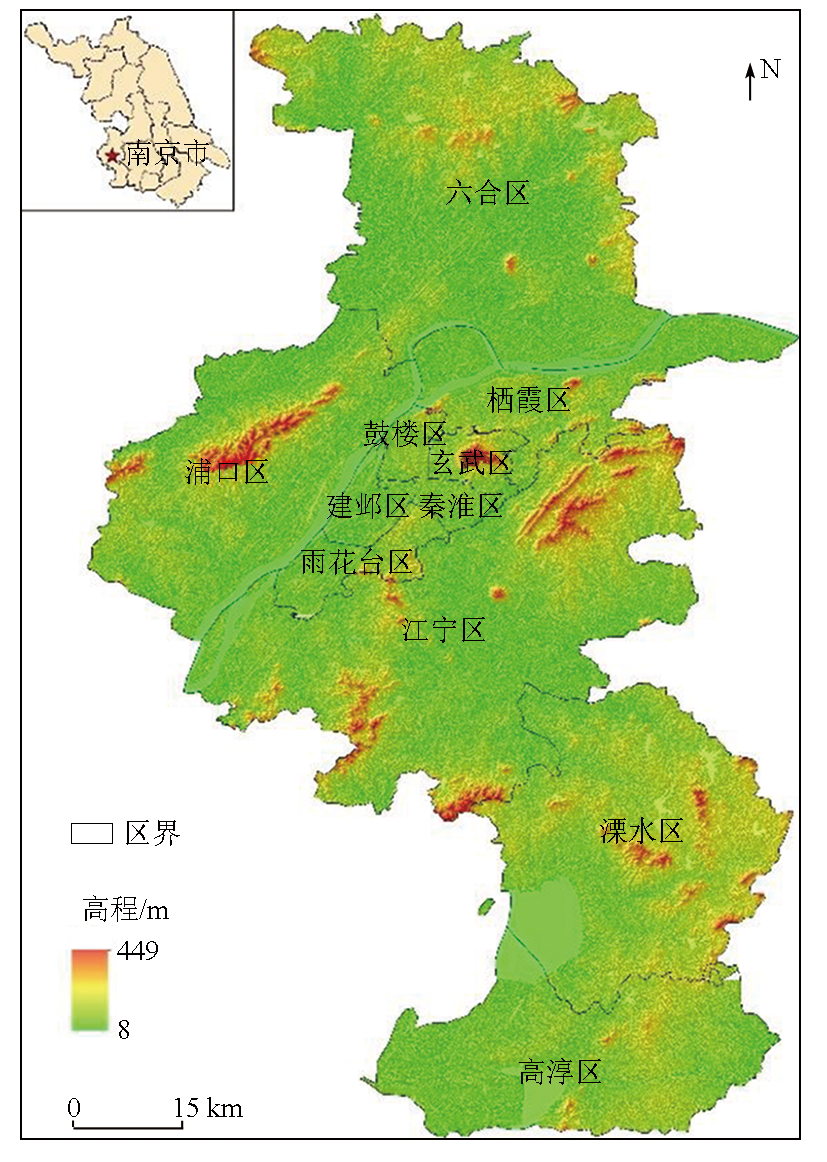
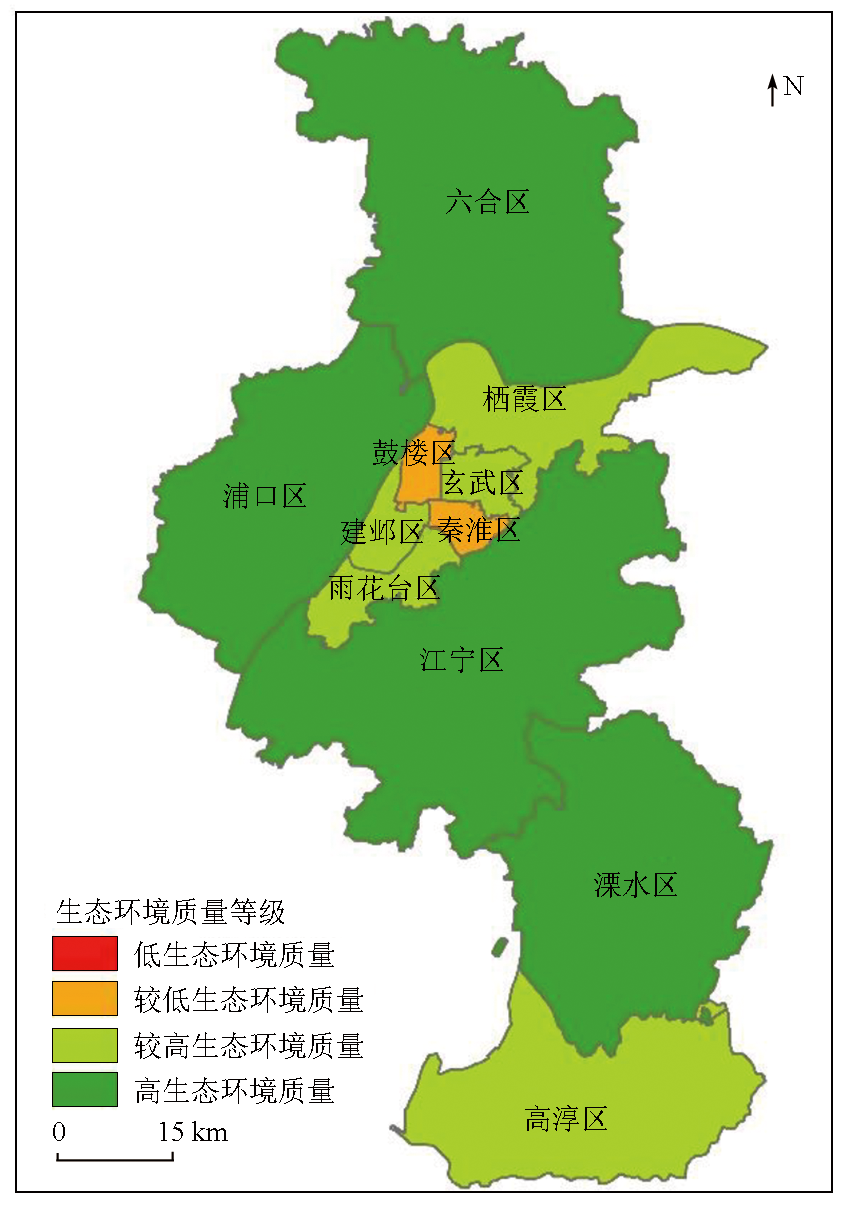
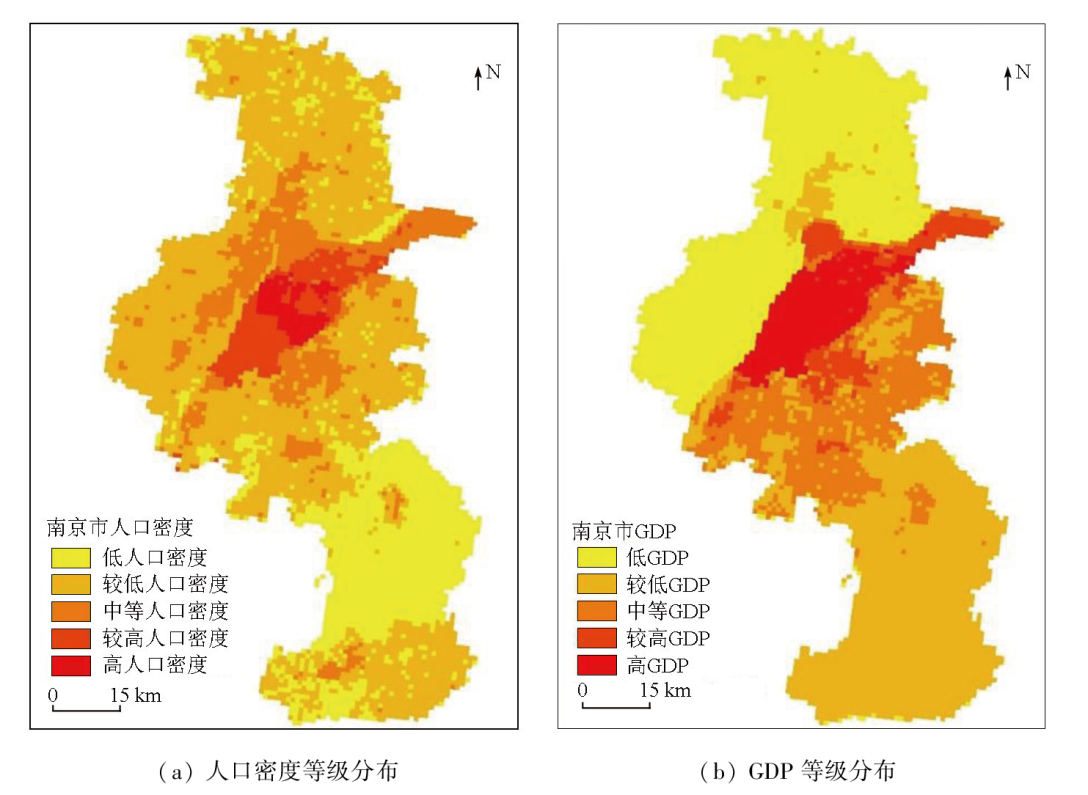
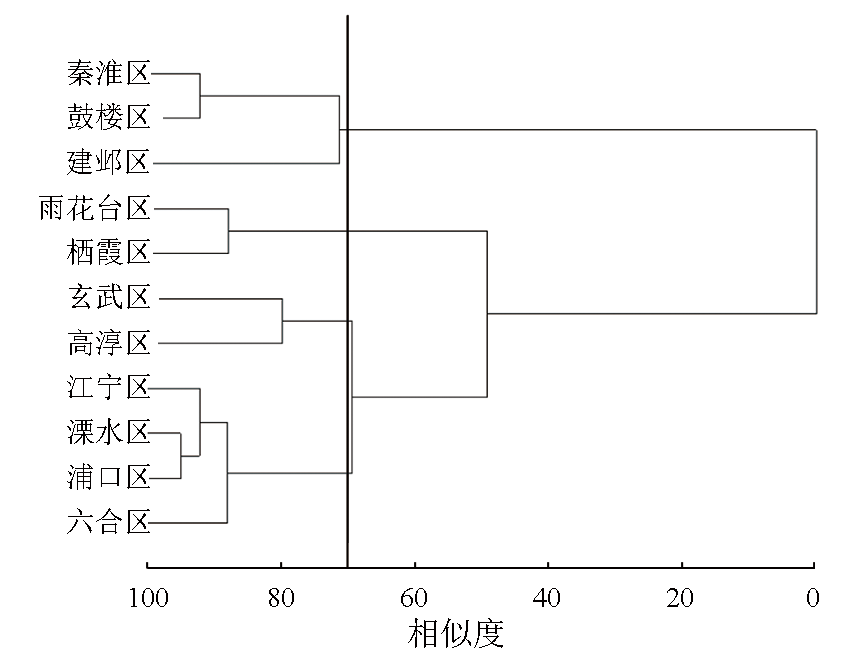
The monitoring and assessment of urban ecological quality holds critical significance for sustainable urban development. To assess the ecological quality of developed coastal cities in China in recent years, this study investigated Nanjing City based on the Sentinel-2A remote sensing images obtained in 2021. It constructed a novel remote sensing green index (RSGI) model involving green spaces, blue spaces, buildings, and impervious surfaces for assessing the ecological quality of Nanjing. First, neural network supervised classification was applied to the Sentinel-2A remote sensing images, constructing the RSGI to assess the ecological quality of various districts in Nanjing. Then, the correlations between the RSGI and urban ecological factors were analyzed using the Pearson correlation coefficient. Finally, the ecological similarity between the districts was analyzed using the agglomerative hierarchical clustering method. The results of this study are as follows: (1) The ecological quality of Nanjing presented a pattern of low RSGI values in the central portion and high RSGI values in the surrounding areas, with the highest and lowest RSGI values (0.86 and 0.38) observed in Luhe and Qinhuai districts, respectively, differing by 0.48; (2) The RSGI exhibited a positive correlation with the density of green spaces and negative correlations with the densities of population, buildings, and impervious surfaces, all at the 0.01 level; (3) With the ecological similarity of 70% as the threshold, 11 districts in Nanjing were categorized into four clusters: Qinhuai, Gulou, and Jianye districts in the first cluster, Yuhuatai and Qixia districts in the second cluster, Xuanwu and Gaochun districts in the third cluster, and the rest four districts in the fourth cluster. The results of this study can provide a scientific basis for subsequent urban planning and sustainable development of Nanjing.
潘金胤, 王世东, 范沁河. 基于遥感绿色指数的城市生态环境质量评价研究——以南京市为例[J]. 自然资源遥感, 2024, 36(3): 88-95.
PAN Jinyin, WANG Shidong, FAN Qinhe. Assessment of urban ecological quality based on the remote sensing green index: A case study of Nanjing City. Remote Sensing for Natural Resources, 2024, 36(3): 88-95.
Liang Q Y, Su T, Zhang C, et al. Research on ecological quality evaluation of Huangshan City based on improved remote sensing ecological index[J]. Progress in Geophysics, 2022, 37(4):1448-1456.
Zhao Q G, Huang G Q, Ma Y Q. The ecological environment conditions and construction of an ecological civilization in China[J]. Acta Ecologica Sinica, 2016, 36(19):6328-6335.
[3]
Lu C, Shi L, Zhao X, et al. Evaluation and planning of urban geological and ecological environment quality[J]. Arabian Journal of Geosciences, 2021, 14(2):71.
[4]
Jiang H, Fan G, Zhang D, et al. Evaluation of eco-environmental quality for the coal-mining region using multi-source data[J]. Scientific Reports, 2022, 12(1):6623.
doi: 10.1038/s41598-022-09795-5
pmid: 35459255
Sun Q, Chen Y C, Lu J M, et al. Spatiotemporal evolution of urban green space and ecological quality in Beijing-Tianjin-Hebei region[J]. Journal of Taiyuan University of Technology, 2023, 54(2):341-349.
Zhang X, Chen L, Ma Y N, et al. Monitoring and evaluation of ecology and environment quality of Yinchuan City based on GIS and RS[J]. Journal of Safety and Environment, 2021, 21(6):2854-2864.
Yang Z K, Tian J, Li W Y, et al. Spatio-temporal pattern and evolution trend of ecological environment quality in the Yellow River basin[J]. Acta Ecologica Sinica, 2021, 41(19):7627-7636.
[8]
Zhou J, Liu W. Monitoring and evaluation of eco-environment quality based on remote sensing-based ecological index (RSEI) in Taihu Lake basin,China[J]. Sustainability, 2022, 14(9):5642.
[9]
Maity S, Das S, Pattanayak J M, et al. Assessment of ecological environment quality in Kolkata urban agglomeration,India[J]. Urban Ecosystems, 2022, 25(4):1137-1154.
[10]
Zhao X, Wang P, Yasir M, et al. Decision support system based on spatial and temporal pattern evolution of ecological environmental quality in the Yellow River Delta from 2000 to 2020[J]. Soft Computing, 2022, 26(20):11033-11044.
Wan H L, Huo F, Niu Y F, et al. Dynamic monitoring and analysis of ecological environment change in Cangzhou City based on RSEI model considering PM2.5 concentration[J]. Progress in Geophysics, 2021, 36(3):953-960.
[12]
Xu F, Li H, Li Y. Ecological environment quality evaluation and evolution analysis of a rare earth mining area under different disturbance conditions[J]. Environmental Geochemistry and Health, 2021, 43(6):2243-2256.
Sun H, Ma L R, Cai C C, et al. Evolution of surface temperature and heat island effect in arid areas:A case of city belt along the Yellow River in Ningxia[J]. Arid Land Geography, 2020, 43(3):694-705.
Yong K T, Chen Z W, Li S W, et al. Evaluation of urban ecological environment:A case study of Fujian Province based on CEI[J]. Journal of Subtropical Resources and Environment, 2022, 17(1):87-94.
Gao Z B, Wang X R, Sui X Y, et al. Multi-scenario prediction of habitat quality in Nanjing based on FLUS and InVEST models[J]. Journal of Agricultural Resources and Environment, 2022, 39(5):1001-1013.
[16]
Silva D F D, Fernandes K, Pivetta L, et al. Indicadores de floresta urbana a partir de imagens aereas multiespectrais de alta resolucao[J]. Scientia Forestalis/Forest Sciences, 2005, 6(7):88-100.
Chen Y L, Wang X L, Li E, et al. Research and application of band selection method based on CEM[J]. Spectroscopy and Spectral Analysis, 2020, 40(12):3778-3783.
Yu Y F, Wen Z H, Shang J H, et al. Identification of Karst water strong runoff zone in Mingshui spring area based on correlation between spring discharge and precipitation[J]. Water Resources Protection, 2021, 37(3):56-60.
[19]
刘海涛. 基于障碍与方向约束的密度聚类算法研究[D]. 太原: 太原科技大学, 2010.
Liu H T. Research on density clustering algorithm based on obstacle and direction constraints[D]. Taiyuan: Taiyuan University of Science and Technology, 2010.
Deng Y W, Hou P, Jiang W G, et al. Automatic extraction of river source region boundary based on multi-characteristic indexes and hierarchical cluster analysis[J]. Journal of Geo-Information Science, 2022, 24(3):469-482.
Zhao R Q, Huang X J, Zhong T Y, et al. Application of clustering analysis to land use zoning of coastal region in Jiangsu Province[J]. Transactions of the Chinese Society of Agricultural Engineering, 2010, 26(6):310-314.
[23]
Mandal M S H, Hosaka T. Assessing cyclone disturbances (1988—2016) in the Sundarbans mangrove forests using Landsat and Google Earth Engine[J]. Natural Hazards, 2020, 102(1):133-150.
Wang Y, Tang L, Zhu H T, et al. The study of urban thermal environment dynamics and attribution analysis based on multiple remote sensing dataset:In the case of Shenzhen[J]. Acta Ecologica Sinica, 2021, 41(22):8771-8782.
Qiao X Y, Tian G H, Liu W X, et al. Contaminative characteristics and nutrient effect of green algae in the landscape waterbody of Dongfeng River in Zhengzhou City[J]. Journal of Shanxi Agricultural University (Natural Science Edition), 2017, 37(11):811-817.
 2024, Vol. 36
  ), 王世东1, 范沁河2(