

0 引言
气象干旱常用基于气象站点的干旱监测指数表征,如标准化降水指数(standardized preciptation index,SPI)、帕默尔干旱指数(Palmer drought severity index, PDSI)、标准化降水蒸散指数(standardized precipitation evapotranspiration index, SPEI)、综合气象干旱指数(composite index of meteorological drought, CI)[5]等,其中SPI理论完善、易于计算且特征明显,已被广泛应用于评估不同时间尺度的气象干旱[4,6]。而植被生长状态常采用基于遥感的干旱监测指数表征,如归一化植被指数(normalized difference vegetation index, NDVI)、植被状态指数(vegetation condition index,VCI)、温度状况指数(temperature condition index, TCI)等,其中NDVI是衡量植被覆盖率、反映植被长势的重要指标,但对于不同植被类型的解释能力有限,易受云、阴影和大气干扰[7-8],故在此基础上提出VCI用于植被健康状况评估和水分监测,目前已有诸多学者研究证明了VCI在黄土高原及西北地区存在良好的适用性。李家誉等[9]以VCI作为植被状况指标,得到了黄土高原植被状况时空变化特征并分析了其与气象干旱的相关性; 李明等[10]采用SPI和VCI分别表征气象干旱和农业干旱,进而探究二者的时滞关系,证明了VCI能较好反映黄土高原地区的干旱情况; 张华等[11]通过对NDVI和VCI所表征的植被生长状况与SPEI的相关性进行对比分析,证明了VCI相较于NDVI适用性更好。
对不同指数之间的响应关系的研究常以2种思路展开。其一,以统计面雨量的方式,按以点代面的形式,分析2个指数时间序列的相关性,进而量化响应时间、拟合响应关系。刘永佳等[6]以时序SPI和标准化径流指数(standardized runoff index, SRI)为基础,研究无定河、窟野河和沁河流域水文干旱对气象干旱的响应时间,得到无定河、窟野河和沁河流域气象干旱向水文干旱的年传播时间为5~7个月; Dai等[12]以SPI和标准化土壤水分指数(standardized soil moisture index, SSMI)表征气象干旱和农业干旱,通过选择不同时间尺度的SPI和1个月时间尺度的SSMI之间的最大条件概率值,确定从气象干旱到农业干旱的传播时间,结果表明夏季和秋季干旱传播时间短于春季和冬季,说明夏季和秋季干旱传播速度快于春季和冬季。其二,通过逐项元计算2个指数影像集的相关性,直观分析响应时间在空间上存在的差异。靖娟利等[7]采用趋势分析和相关性分析,以SPEI和NDVI影像集为基础,研究植被变化及其对气象干旱的响应特征,结果表明滇黔桂地区NDVI对短时间尺度SPEI响应比较敏感; 吕振涛等[13]借助NDVI和SPEI,研究蒙古国植被对气象干旱的敏感性,结果表明大部分区域植被生长受干旱影响较强,且相关性显著区域主要在中部地区,各植被指数与干旱指数呈较明显的正相关关系,且草地是最敏感的地类。本研究将2者融合,在完成空间相关性分析的基础上,得到可用来量化响应关系的平均响应时间,同时完成不同植被类型下植被生长状态对气象干旱响应时间的比较。
山西省位于黄土高原东翼,远离海洋,再加上东西有太行、吕梁两山耸立,阻隔水汽,故降水稀少,干旱频发。全省林草丰富,且以夏、秋为主要粮食产季,产量易受干旱影响。多数学者以黄土高原为研究区,聚焦于整体的干旱时空特征分析或干旱响应关系研究[9-10,14-15],本研究选取黄土高原中属典型半干旱半湿润区的山西省为研究区,借助Google Earth Engine(GEE)平台,基于气象站点数据和遥感监测数据,将变分模态分解(variational model decomposition,VMD)与Mann-Kendall相结合,分析山西省2000—2020年不同植被类型下气象干旱变化趋势,同时采用点、面结合的思路,研究其植被生长状态对气象干旱的响应机制,量化响应时间,为山西省应对气象变化、实现生态建设提供理论支撑。
1 研究区概况及数据源
1.1 研究区概况
山西省地形错综复杂、河谷纵横,西部是以吕梁山为主干的黄土高原,东部是以太行山为主脉形成的块状山地,汾河、桑干河贯穿山谷之中,盆地、平原沿河由东北至西南分散,形成 “两山夹一川”的地形格局,属我国生态环境脆弱地带。全省的植被类型多样,除主要城市建设区以外,大部分区域被林地、草地和耕地所覆盖,其中草地主要分布在地形起伏较小的丘陵和山地,占总面积的61.32%(图1)。同时,受温带大陆性季风气候和地理因素影响,山西省冬夏气温悬殊,省内降水分布不均,降水季节性显著。全省各地年降水量介于358~621 mm之间,且主要集中在夏季6—8月,约占全年降水量的70%,其余季节降雨稀少,总体水资源贫乏,旱情严重[16-17]。
图1
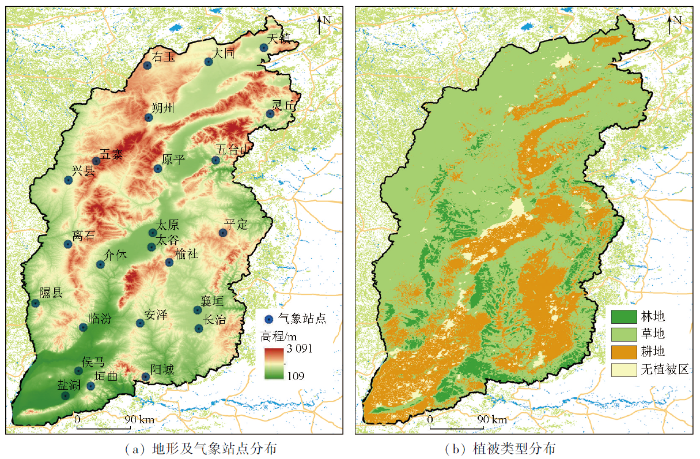
图1
山西省地形、植被类型及气象站点分布
Fig.1
Distribution of terrain, vegetation types and meteorological stations in Shanxi Province
1.2 数据源及其预处理
1.2.1 气象数据
本研究所采用的山西省2000—2020年逐日降水数据来自国家气象信息中心整理的国家级地面气象站基本气象要素日值数据集(V3.0)(http://data.cma.cn/),将监测时序不完整的气象站点剔除,选取24个气象站点反映山西省降水情况(图1(a))。
1.2.2 MODIS数据
本研究所采用的MODIS数据来自GEE平台(https://code.earthengine.google.com/),分别获取了植被指数产品MOD13A1(空间分辨率为500 m,时间分辨率为16 d)和土地覆盖类型产品MCD12Q1(空间分辨率为500 m,时间分辨率为1 a)。对于MOD13A1产品,为减少云雾和霾的影响,采用最大值合成法(maximum value composite, MVC)将NDVI原始序列合成为月尺度序列[18]。对于MCD12Q1产品,为了避免地类变化造成的影响,采用众数合成法进行多年合成,再将得到的土地覆盖类型数据基于国际地圈生物圈计划(International Geosphere Biosphere Programme, IGBP)中全球植被分类方案重新划分为4类: 耕地(包括天然植被的作物和镶嵌农田)、草地(包括乔木草原、稀疏草原和草原)、林地(包括树栖针叶林、树栖阔叶林、落叶针叶林、落叶阔叶林、混交林、封闭灌木林和稀疏灌木林)、无植被区(包括城市和建筑区、冰、雪、裸露土地或稀疏植被覆盖、湿地和水域)[19-20]。
1.2.3 其他数据
本研究所采用的全国行政区划数据来自中国科学院资源环境科学与数据中心(https://www.resdc.cn/), 山西省30 m分辨率DEM数据来自地理空间数据云(http://www.gscloud.cn/)。
2 研究方法
2.1 SPI指数
式中: x为降水量; G为正负系数,当Y(x)>0.5时,G=1,当Y(x)≤0.5时,G=-1; u1,u2,u3,l1,l2,l3为常数,分别为: u1=2.515 517,u2=0.802 853,u3=0.010 328,l1=1.432 788,l2=0.189 269,l3=0.001 308; Y(x)2为与
式中
2.2 VCI指数
式中: VCIi为某年第i月VCI; NDVIi为某年第i月NDVI; NDVImax和NDVImin分别为研究序列中第i月的NDVI最大值和最小值。
2.3 趋势分析
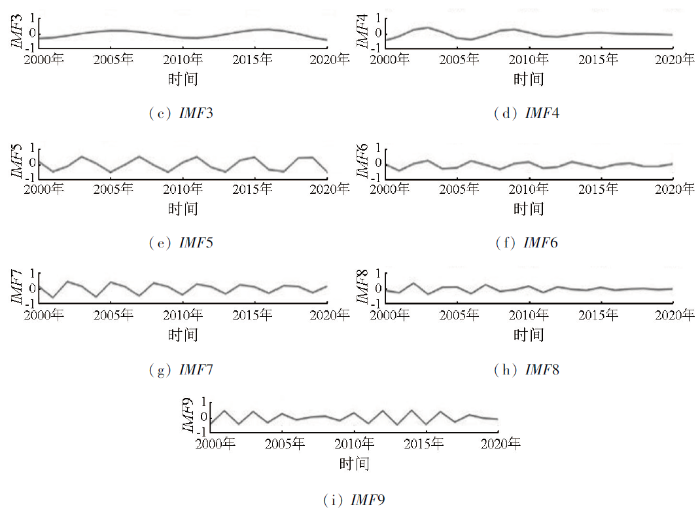
2.4 VMD分解
式中: K为分解模态数;
接着引入拉格朗日乘法算子与二次惩罚因子将约束变分问题转换为非约束变分问题,最后采用交替方向乘子法即可解决上述问题。表达式为:
式中: α为二次惩罚因子,在高斯噪声存在的情况下保证信号重构精度;
在实现VMD分解时,需提前设置惩罚因子、噪声容限、收敛容错和分解模态数,进行信号初始化和常量判断。其中,惩罚因子α影响分解的精度,太小导致分解模态精度不高,但太大又面临着分解时间增多,甚至可能造成死循环。对于带有明显频率成分的信号,选用较小的惩罚因子能更好地捕捉信号的频率特征,而对于嘈杂或频率特征不明显的信号,可用较大的惩罚因子来限制模态的带宽,以提高噪声抑制能力; 噪声容限tau主要控制对噪声的容忍度,过大的噪声容限可能会导致信号损失,对于高噪声信号,可以选用较大的噪声容限以容忍噪声成分,对于低噪声信号,可以选用较小的噪声容限以更严格地限制噪声; 收敛容错tol控制误差大小,较小的收敛容错会提高分解精度,但也会导致耗费更长的计算时间。此三者会对分解结果的好坏产生间接影响。此外,信号初始化init设置为1进行均匀初始化; 常量判断DC根据是否需要考虑直流成分而定,如需分析信号的直流成分,将其设置为1,否则为0。根据先验知识并结合多次实验结果,本研究取α=2 000,tau=0.024 4,tol=1E-6,init=1,DC=0。
除以上参数外,由于分解模态数K直接决定分解结果是否正确,故研究确定合适的分解模态数常作为相关研究的重点[32]。而本研究采用中心频率法确定分解模态数,大致过程为:
1)将
2)若其中
2.5 相关性分析
Pearson相关系数常用于研究不同干旱指数间的相关性和一致性。其计算公式为[33]:
3 结果与分析
3.1 气象干旱变化趋势
3.1.1 年与月尺度气象干旱变化趋势
通过经验贝叶斯克里金法对各站点SPI的Mann-Kendall趋势检验结果和线性拟合斜率进行插值,分析山西省年、月尺度SPI空间变化趋势(图2)。其中,年SPI以临汾、榆社和平定为界,呈现出北升南降的总趋势,东北部太行山、五台山附近以8%/a的速率上升,东南部安泽、长治等地以-0.98%/a的速率下降; SPI1全省总体呈上升趋势,以五台山为中心上升最为明显,速率为0.1%/a,南部以隰县、介休和榆社为界,南部上升趋势不明显,速率趋近于0.01%/a; SPI3趋势变化特征与SPI1类似,区别在于五台山附近上升速率为0.3%/a; SPI12大部分地区呈上升趋势,五台山附近以0.8%/a的速率上升,东南部以安泽、襄垣两地为中心辐射阳城,形成下降三角区。
图2

图2
年与月尺度SPI变化趋势
Fig.2
Variation trend of SPI at the interannual and monthly scales
3.1.2 季尺度气象干旱变化趋势
分析山西省季尺度SPI变化趋势可知(图3),春季SPI全省98%的地区呈上升趋势,除朔州、大同交界处和朔州西北部外,其余地区旱情均得到缓解; 夏季SPI全省北部呈上升趋势,南部以安泽、襄垣、阳城和长治为中心形成闭环,夏旱呈现加重趋势; 秋季SPI以兴县、平定为界,以北呈上升趋势,以南呈下降趋势; 冬季全省97%的地区旱情加重,只有灵丘和朔州2地SPI呈上升趋势。综合分析,山西省季尺度SPI呈上升趋势的区域,随着季节更替,一直处于由南至北方向上的动态移动,同时该区域的面积也在不断减小。
图3

3.1.3 不同植被类型下气象干旱变化趋势
表1 不同植被类型下年、月与季尺度SPI变化趋势
Tab.1
| 土地类型 | 类别 | 年 | SPI1 | SPI3 | SPI12 | 春季 | 夏季 | 秋季 | 冬季 |
|---|---|---|---|---|---|---|---|---|---|
| 耕地 | z① | 0.604 | 0.609 | 1.693* | 2.420** | 1.419 | 0.635 | -0.544 | -0.974 |
| s | 0.044 | 0.001 | 0.002 | 0.003 | 0.046 | 0.033 | -0.025 | -0.031 | |
| 草地 | z | 2.477** | 1.075 | 2.818*** | 6.555*** | 1.359 | 1.178 | 0.030 | 0.616 |
| s | 0.082 | 0.001 | 0.003 | 0.006 | 0.049 | 0.048 | 0.002 | -0.021 | |
| 林地 | z | 0.967 | 0.407 | 1.439 | 2.461** | 1.571 | 0.574 | -0.574 | -0.974 |
| s | 0.034 | 0.000 | 0.001 | 0.002 | 0.050 | 0.033 | -0.025 | -0.033 | |
| 无植被区 | z | 1.298 | 0.753 | 2.141** | 3.661*** | 1.480 | 1.238 | -0.513 | -0.876 |
| s | 0.051 | 0.001 | 0.002 | 0.003 | 0.040 | 0.050 | -0.027 | -0.035 |
① z表示显著性检验结果,s表示线性拟合斜率,*表示通过90%显著性检验,**表示通过95%显著性检验,***表示通过99%显著性检验。
图4-1

图4-2
3.2 植被生长状态对气象干旱的响应
3.2.1 年尺度植被生长状态与气象干旱的相关性
分析年尺度VCI与SPI12的相关系数及显著性检验结果可看出(图5),二者主要以正相关为主,占全省面积的94%,负相关区域主要集中在安泽和阳城附近,极显著正相关和显著正相关主要分布在以隰县、介休、太谷和平定为界的山西北部,占正相关区域面积的25%,以南主要为不显著正相关和不显著负相关。
图5
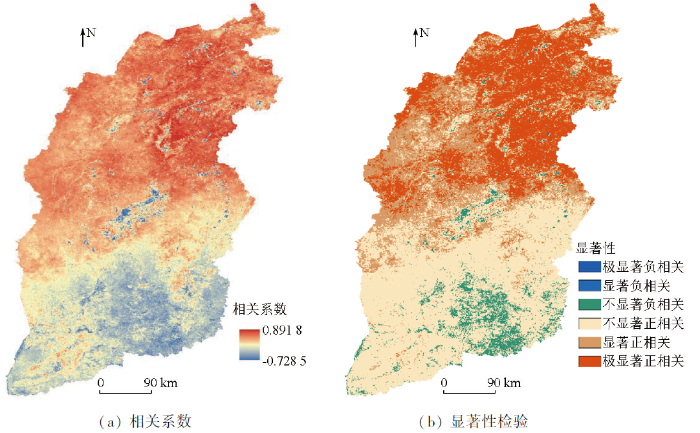
图5
年尺度VCI与SPI12的相关系数及显著性检验空间分布
Fig.5
Spatial distribution of correlation coefficient and significance test between interannual VCI and SPI12
3.2.2 季尺度植被生长状态对气象干旱的响应
图6

图6
季尺度VCI与不同时间尺度SPI的最大相关系数空间分布
Fig.6
Spatial distribution of maximum correlation coefficient between seasonal VCI and SPI at different time scales
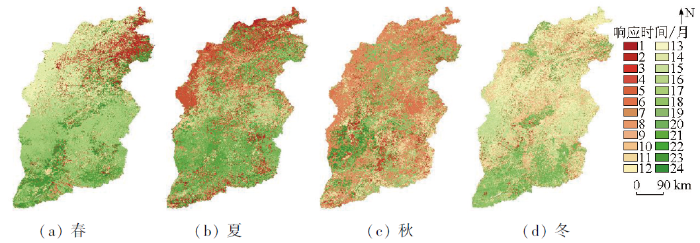
图7
总体而言,各季VCI与SPI均以正相关为主,并且R>0.55的区域,随着季节更替,由春至冬收缩至西北和东北部。其中,春季低相关性区域(R<0.45)主要集中在太原及山西中南部的无植被区,占全省总面积的4%,高相关性区域(R>0.75)占全省总面积的26%,在西北部兴县、五寨,及中部隰县、介休、榆社集中分布; 夏季低相关性区域范围扩大至安泽、阳城,高相关性区域由西北部转移至东北部的右玉、大同,由中部向北转移至离石; 秋季以隰县、榆社和平定为界,北部主要为R>0.55的区域,其中高相关性区域占11%,低相关性区域占R<0.45区域的56%; 冬季R>0.55的区域收缩至山西西北吕梁山和东北太行山地区,低相关性区域占全省面积的40%。
VCI对SPI的响应时间存在空间差异,且随季节变化明显。春季响应时间以长期为主,响应时间小于12个月的区域主要集中在东北部的天镇、灵丘和五台山地区,仅占全省面积的18%,其余地区由北至南响应时间从13~24个月逐渐延长; 夏季响应时间仍以长期为主,响应时间大于12个月的区域占61%,响应时间小于12个月的区域主要沿兴县、五寨、朔州、右玉、大同和天镇一线分布,南部盐湖、垣曲、阳城和长治一线响应时间相较春季也明显缩短; 秋季响应时间呈长短期离散分布,其中响应时间为7个月、18个月和11个月的区域分别占32%,11%和9%; 冬季响应时间主要为9~18个月,响应时间超18个月的区域主要分布在太原及南部平原等地,占全省面积的17%。
3.2.3 月尺度植被生长状态对气象干旱的响应
分析全省各月VCI与1~24个月时间尺度SPI的相关系数均值(图8),可以看出整个山西省VCI对SPI的响应时间随季节变化明显,R>0.4主要出现在4—8月,其余各月相关系数随着SPI时间尺度增加也不断增大。从中选取各月响应时间均值作为对应季节的响应时间(如春季响应时间,计算3,4,5月最大相关系数对应的SPI时间尺度的均值),春季为13.7个月,夏季为10个月,秋季为14.7个月,冬季为22.7个月,说明夏季气象干旱对植被生长状态的影响反应最快。
图8
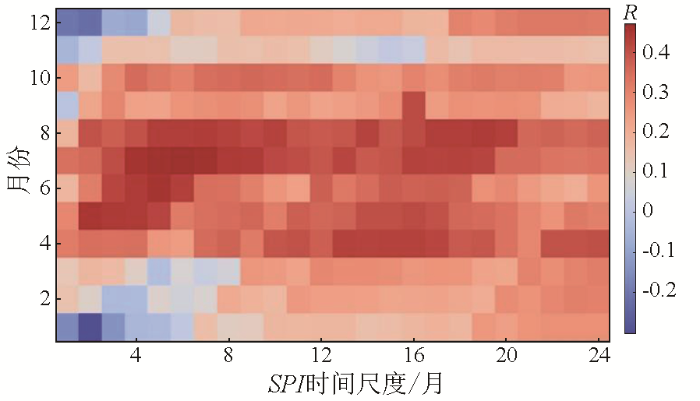
图8
各月VCI与1~24个月时间尺度SPI的相关系数均值
Fig.8
The average value of the correlation coefficient between VCI and SPI with a time scale of 1 to 24 months
3.2.4 不同植被类型下植被生长状态对气象干旱的响应
为进一步细化VCI对SPI响应的空间差异,统计分析了不同植被类型下生长季VCI与SPI的最大相关系数及对应时间尺度(表2)。结果表明,耕地、草地、林地和无植被区的最大相关系数分别出现在7月、7月、5月和6月,其对应的响应时间分别为6个月、6个月、3个月和5个月。而耕地、草地、林地和无植被区最短响应时间分别出现在5月、6月、5月和6月。4种地类在春夏两季的响应时间相较秋冬要短,且在冬季响应时间都最长。同时,耕地在各月的响应时间都要短于草地和林地,说明耕地对气象干旱更敏感。
表2 不同植被类型下生长季最大相关系数及对应时间尺度
Tab.2
| 土地 类型 | 4月 | 5月 | 6月 | 7月 | 8月 | 9月 | 10月 | |||||||
|---|---|---|---|---|---|---|---|---|---|---|---|---|---|---|
| R | 响应时 间/月 | R | 响应时 间/月 | R | 响应时 间/月 | R | 响应时 间/月 | R | 响应时 间/月 | R | 响应时 间/月 | R | 响应时 间/月 | |
| 耕地 | 0.38 | 8 | 0.41 | 2 | 0.47 | 5 | 0.49 | 6 | 0.44 | 7 | 0.37 | 16 | 0.24 | 9 |
| 草地 | 0.49 | 15 | 0.47 | 16 | 0.46 | 5 | 0.50 | 6 | 0.49 | 19 | 0.46 | 16 | 0.43 | 9 |
| 林地 | 0.33 | 24 | 0.49 | 3 | 0.37 | 5 | 0.25 | 18 | 0.28 | 7 | 0.24 | 16 | 0.37 | 12 |
| 无植被区 | 0.32 | 7 | 0.29 | 8 | 0.41 | 5 | 0.38 | 6 | 0.27 | 10 | 0.21 | 16 | 0.16 | 10 |
4 讨论与结论
4.1 讨论
4.1.1 气象干旱变化特征
同时,土壤含水量也能有效地反映旱情,根据薛少博等[38]研究,山西省在2002—2020年间水储量明显减少,且由西北至东南减少趋势更为明显,同时,在东南部0~200 cm土层土壤水分均流失严重,这与气象干旱年际变化相吻合。
4.1.2 植被生长状态对气象干旱的响应
此外,探究植被生长状态对气象干旱的响应,应综合考虑多种因素影响。其一,相关指数选取。SPI作为仅依靠降水数据得到的干旱指数,在气象干旱表征中存在一定局限性,同时在探究响应机制时也会存在不足,所以对于气象干旱指数应选取综合了气温、地形、海拔、降水和蒸散发等因子的干旱指数来表征。VCI主要通过植被覆盖度和植被水分来量化植被生长状态,而山西省以夏、秋为主要粮食产季,冬季农作物种植较少且常有积雪覆盖,春季农作物长势不明显,故农作物面积与实际耕地面积常常不符,在借助VCI反映农作物收割前后的耕地旱情时存在偏差,可能出现VCI值比实际偏小的情况。其二,影响因素的考量。植被生长状态不仅受气象因素影响,同时还与土壤状况、土地类型、人类活动有密切关联。自1999年以来,山西省积极响应国家退耕还林还草政策,植被覆盖率大幅增长[40],大面积区域植被得到改善。但政策施行初期伴随着植被蒸腾作用增强和气候异常,植被返青所需的土壤水含量不足,植被生长受限[41]。植被的生长发育是受到多种因素共同作用的结果。综上所述,选取更合理的评价指数,综合考虑各种影响因子,将是未来气象干旱评估重要的发展方向。
4.1.3 对于不同植被类型的考虑
针对不同植被类型研究气象干旱变化趋势,分析植被生长状态与气象干旱的响应关系,为了避免长时间跨度地类变化造成的影响,本研究采用众数合成法对土地覆盖类型进行多年合成,对于此问题其他学者也有不同的解决办法,如尉毓姣等[42]将研究时段划分为4期土地覆盖数据,分时段提取不同类型植被的NDVI和SPEI; 吴林霖等[43]使用2005年和2010年数据分别提取2000—2008年、2009—2013年间的典型植被类型; 李家誉等[9]统计了黄土高原地区1990年和2015年耕地、林地和草地3种土地利用类型未发生改变的格点。不同的方法有不同的可行性,但如何更合理地将随时间变化的各种因素纳入对气象干旱研究的考虑范围,得出更科学的结论是目前亟待解决的问题。
4.2 结论
研究气象干旱的变化趋势,分析气象干旱与植被生长状态的关系,有利于更好地了解干旱的演变规律及其对社会经济造成的影响。本研究的主要结论如下:
1)2000—2020年山西省年与12个月尺度气象干旱均呈现北部缓解、东南部加重的态势,而在1个月和3个月尺度则整体缓解,不同尺度下的相同之处在于缓解态势最明显的区域均在五台山附近; 山西省气象干旱存在明显的季节性差异,呈现由春至冬旱情加重区不断扩大的态势。不同植被类型(耕地、草地、林地和无植被区)下气象干旱均得到缓解,且随着时间尺度增长,态势越发显著,而季尺度上由春至冬缓解态势渐弱,加重态势渐强。
2)山西省年尺度植被生长状态与气象干旱主要以正相关为主,且极显著与显著正相关区域向五台山附近集中,表明植被受气象干旱影响显著,且阻隔季风与湿气的山地植被对降水更为敏感; 季尺度上高相关性区域由春至冬逐渐收缩至西北部和东北部,表明春季植被生长状态受降水限制最强,但在季节更替中,该限制逐渐减弱。而植被生长状态对气象干旱的响应时间存在空间差异,且随季节变化,以长期响应为主的区域不断缩减,短期响应的区域逐步从东北部向西北部再向全省蔓延。同时经过量化分析各月VCI与1—24个月时间尺度SPI的相关系数均值,发现各月响应时间存在明显季节性差异,其中夏季气象干旱对植被生长状态的影响反应最快。对于不同植被类型,最大相关系数集中出现在5—7月,也说明夏季植被生长状态对气象干旱响应更快,同时耕地在各月的响应时间都要短于草地和林地,说明耕地对气象干旱更敏感。
参考文献
Projection of forest fire danger due to climate change in the French Mediterranean region
[J].
Assessing spatiotemporal characteristics of drought and its effects on climate-induced yield of maize in Northeast China
[J].
A review of twentieth-century drought indices used in the United States
[J].
Assessing the responses of hydrological drought to meteorological drought in the Huai River basin,China
[J].
基于综合气象干旱指数的1961—2012年阿勒泰地区干旱时空演变特征
[J].基于阿勒泰地区7个气象站1961—2012年的逐日气温、降水等气象资料,运用趋势分析法、M-K突变检验法、小波分析法并结合ArcGIS软件,探究了阿勒泰地区干旱的时空演变特征.结果表明: 综合气象干旱指数能较好地反映阿勒泰地区干旱状况.研究期间,阿勒泰地区虽然年和四季的干旱频次和不同等级干旱覆盖范围都呈减少趋势,但是旱情仍较为严重,年和季节的干旱发生频繁,且多年存在重旱和特旱发生在整个阿勒泰地区;秋季和冬季的干旱频次分别在1997和1983年发生减少突变,夏季的干旱频次首先在1962年发生增加突变,随后在1991年发生减少突变,年均和春季的干旱频次无突变发生;年和四季的干旱频次都存在明显的周期性.干旱频次和不同干旱等级在空间上的分布表明,东部清河县旱情较为严重,中部阿勒泰市、富蕴县、布尔津县、福海县旱情次之,西部地区的哈巴河和吉木乃县的旱情较轻.
Spatio-temporal variation of drought condition during 1961 to 2012 based on composite index of meteorological drought in Altay region,China
[J].
不同季节气象干旱向水文干旱的传播及其动态变化
[J].
Propagation and dynamic change of meteorological drought to hydrological drought in different seasons
[J].
滇黔桂地区NDVI变化及其对SPEI的响应特征
[J].
Spatial and temporal variations of NDVI and its response to SPEI in Yunnan-Guizhou-Guangxi region
[J].
基于NDVI和scPDSI研究1982—2015年中国植被对干旱的响应
[J].
Response of vegetation to drought based on NDVI and scPDSI data sets from 1982 to 2015 across China
[J].
黄土高原植被变化对气象干旱多尺度响应特征与机制
[J].
Multi-scale response characteristics and mechanism of vegetation to meteorological drought on the Loess Plateau
[J].
黄土高原气象干旱和农业干旱特征及其相互关系研究
[J].
DOI:10.13249/j.cnki.sgs.2020.12.017
[本文引用: 4]

选择标准化降水指数(SPI)和植被状态指数(VCI)分别作为评价黄土高原气象干旱和农业干旱的指标,使用干旱频率和Sen斜率分析了黄土高原地区干旱的分布特征与变化趋势,并探讨了气象干旱与农业干旱的相关性。结果表明:① 黄土高原西部干旱频率总体上高于东部。气象干旱和农业干旱变化趋势在空间上表现有所不同,黄土高原西部、北部气象干旱呈不显著减缓趋势,东部和南部呈不显著加重趋势,但绝大部分地区的农业干旱呈减缓趋势,尤其是400 mm等降水量一线两侧区域。② 季节上,黄土高原夏季和秋季气象干旱频率较高,春季和冬季气象干旱频率相对较低。黄土高原农业干旱频率春季最高,夏季其次,VCI对农业干旱实时监测的适用性更强。③ 不同季节,农业干旱滞后气象干旱的时间长短不同,冬季滞后约2个月,春季滞后约1个月,夏季和秋季滞后少于1个月。黄土高原一熟制种植区的SPI-12值与VCI值具有较好的正相关性。研究结果可以为黄土高原的干旱监测和预警、干旱区划以及干旱灾害风险评估提供科学依据。
Meteorological and agricultural drought characteristics and their relationship across the Loess Plateau
[J].
DOI:10.13249/j.cnki.sgs.2020.12.017
[本文引用: 4]
In recent years, the combined effects of climate change and soil and water conservation measures have led to more complex drought conditions in the Loess Plateau, which has caused huge agricultural and socioeconomic losses. In this paper, standardized precipitation index (SPI) and vegetation condition index (VCI) are selected as indicators to evaluate the meteorological and agricultural droughts on the Loess Plateau, respectively. The distribution characteristics and trends of droughts in the Loess Plateau are analyzed using drought frequency and Sen slope, and the correlation between meteorological drought and agricultural drought is also discussed. The results show that: 1) The drought frequency in the western Loess Plateau is generally higher than that in the east. The trends of meteorological droughts are different from that of agricultural droughts in space. The meteorological droughts in the western and northern Loess Plateau show no significant slowing down trends, and the meteorological droughts in the eastern and southern Loess Plateau show no significant increasing trends. However, the agricultural droughts in most areas are slowing down, especially in the areas on both sides of the line with a rainfall of 400 mm. 2) The frequency of meteorological drought in summer and autumn is higher than that in spring and winter. The frequency of agricultural drought is the highest in spring and the second in summer. VCI is more suitable for real-time monitoring of agricultural drought. 3) In different seasons, the lag time of agricultural drought to meteorological drought is different. The lag time is about 2 months in winter, 1 month in spring, and less than 1 month in summer and autumn. There is a good positive correlation between SPI-12 and VCI in one-harvest regions of the Loess Plateau. The results can provide scientific basis for drought monitoring and early warning, drought regionalization and drought disaster risk assessment in the Loess Plateau.
2001—2018年西北地区植被变化对气象干旱的响应
[J].
DOI:10.13249/j.cnki.sgs.2020.06.019
[本文引用: 2]
基于2001?2018年逐月的MODIS NDVI数据,以归一化植被指数(Normalized Difference Vegetation Index, NDVI)和植被状态指数(Vegetation Condition Index, VCI)作为植被生长状况指标,结合2001?2018年的月降水和月均温数据计算的标准化降水蒸散指数值,分析西北地区植被状况和气象干旱指数的变化趋势及其空间分布特征,以及多时间尺度下植被对气象干旱的响应。结果表明:2001?2018年西北地区植被的生长状况整体呈好转趋势,但空间分布上差异明显,东部植被改善状况高于中西部地区。近18 a西北地区5种不同时间尺度标准化降水蒸散指数(Standardized Precipitation Evapotranspiration Index,SPEI)均值整体上均呈增加趋势,表明干旱程度降低;空间上,干旱化趋势整体上表现为中西部高,东部低。植被生长状况在大部分区域均与SPEI呈现不同程度的正相关,总体表现为,西北地区东部植被对气象干旱的响应程度最高,西部次之,中部最低;不同植被类型中,草地对SPEI-12的响应最强,耕地次之,而林地的响应最弱;各植被类型在生长季的多数月份中对SPEI-3和SPEI-12的响应普遍较高。
Response of vegetation change to meteorological drought in Northwest China from 2001 to 2018
[J].
DOI:10.13249/j.cnki.sgs.2020.06.019
[本文引用: 2]
Northwest China is one of the regions with severe drought in China. Based on the monthly MODIS NDVI data from 2001 to 2018, the normal difference vegetation index NDVI and the vegetation condition index VCI were used as indicators of vegetation growth status, combined with the SPEI values calculated from the monthly precipitation and monthly mean temperature data from 2001 to 2018. Using the univariate linear regression trend analysis method and Pearson correlation coefficient to analyze the variation trend and spatial distribution characteristics of vegetation condition and meteorological drought in Northwest China, as well as the response of vegetation to meteorological drought in multiple time scales. The results showed that the growth of vegetation in Northwest China showed a trend of improvement in the period from 2001 to 2018, but the spatial distribution was significantly different. The improvement of vegetation in the eastern region was higher than that in the central and western regions. The average SPEI of the five different time scales in Northwest China all showed an overall increase trend in the past 18 years, indicating that the degree of drought decreased. In space, the overall trend of aridification was higher in the central and western regions and lower in the east. The vegetation growth status was positively correlated with SPEI in most areas. The overall performance showed that the vegetation in the eastern part of the Northwest China had the highest response to meteorological drought, followed by the western part and the middle part. Among the different vegetation types, the sensitivity of grassland to SPEI-12 was the strongest, followed by arable land, while the response of forest land was slower; the response of each vegetation type to SPEI-3 and SPEI-12 was generally higher in most months of the growing season.
Propagation characteristics and mechanism from meteorological to agricultural drought in various seasons
[J].
蒙古国植被对干旱响应的敏感性研究
[J].
DOI:10.11821/dlyj020210105
[本文引用: 2]
本文分析了蒙古国不同区域、不同土地覆被类型区的植被生长状况对干旱响应的敏感性特征,并探讨了成因。研究表明:① 2001—2019年,蒙古国虽然发生了3次较为严重的干旱事件,但整体上干旱程度呈轻微降低趋势,SPEI出现轻微上升,总体增速为0.001%/a;植被生长状况出现了好转,植被指数也呈上升趋势,总体增速为0.15%/a。② 蒙古国大部分区域植被生长受干旱影响较强,各植被指数与干旱指数呈较明显的正相关关系,在NDVI与SPEI-12的相关性分析中,正相关面积占比达76.36%;而在杭爱山脉和肯特山脉以北降水量丰沛的区域和阿尔泰山脉以南荒漠化严重和植被极为稀少区域,植被生长受干旱影响较弱,植被指数与SPEI相关性较小。③ 不同类型植被对干旱响应的敏感性也有差异,其中草地敏感性最强(0.22),而森林敏感性最弱(-0.04)。④ 干旱持续时间长短,对植被生长影响有较大差异,蒙古国大部分区域的植被对延续3个月至半年的干旱最为敏感,而年内以7月份干旱对植被影响最强。⑤ 植被对干旱响应的敏感性实质是区域水分平衡的植被影响,对同种植被而言多年平均气温越高或降水量越少,植被对干旱响应的敏感性越强,反之则越弱。本文的研究结果对蒙古国因地制宜开展荒漠化防治具有重要参考价值。
Sensitivity of vegetation responses to drought in Mongolia
[J].
Evaluating the cumulative and time-lag effects of drought on grassland vegetation:A case study in the Chinese Loess Plateau
[J].
Spatial-temporal dynamics of agricultural drought in the Loess Plateau under a changing environment:Characteristics and potential influencing factors
[J].
山西省农业干旱时空变化特征
[J].
Characteristics of drought spatio-temporal transformation in Shanxi Province
[J].
山西省降水量时空变化及预测
[J].
Tempo-spatial variation and forecast of precipitation in Shanxi Province
[J].
DOI:10.11849/zrzyxb.2015.04.011
[本文引用: 1]
Shanxi Province, where there are widely distributed mountains and karst systems, is the area of surface runoff yield and groundwater recharge for the North China Plain (NCP). Knowledge of tempo-spatial variations and forecast of precipitation in Shanxi could improve the understanding of droughts in the NCP. In this study, spatial distribution of precipitation was clarified based on time series clustering. Features of temporal variance of precipitation were revealed using breaking point test and trend analysis methods. A wavelet- support vector machine model was established to predict the precipitation in the future. As results showed, six sub-regions with different precipitation variation characteristics were identified, which are the North High-latitude Area, the Taihang Alpine Area, the North Mountains and Plateau Area, the Middle Basin Area, the Middle-West Mountains and Plateau Area, and the South Basin Area. More precipitation presented in the Taihang Alpine Area and the South Basin Area, while lessprecipitation occurred in the North High-latitude Area. Precipitation in basins was less than in mountains and plateau area on the same latitude. From 1965 to 1991, annual precipitation decreased significantly in the South, the East, the Middle and the North sequentially. The average rate during 1957 to 2012 is -1.5 mm/a. As a result, the area of Shanxi Province entered an arid period in whole since 1990s. Accordingly, runoff declined and groundwater recharge reduced. Decrease in precipitation of Shanxi in recent decades was evidently one of the driving factors of droughts in the NCP. The study region will get out of the less precipitation period before the year of 2020 with an average gradient of 16 mm/a, which would relieve droughts in the NCP.
Characteristics of maximum-value composite images from temporal AVHRR data
[J].
Effects and contributions of meteorological drought on agricultural drought under different climatic zones and vegetation types in Northwest China
[J].
3种IGBP分类系统的土地覆盖数据在韩江流域的对比分析
[J].
DOI:10.11873/j.issn.1004-0323.2017.3.0575
[本文引用: 1]
土地覆盖是陆面过程模型、生态水文模型的重要输入,对模拟结果影响较大。针对基于IGBP分类系统的土地覆盖数据IGBP DISCover、MODIS和MICLCover,以韩江流域为研究区域,分析了3种数据土地覆盖空间分布,通过人工判读样地Google卫星影像对其精度进行了评价。结果表明:IGBP DISCover土地覆盖类型少,空间变异性小,而MODIS和MICLCover类型多,空间变异性大;从大类看,3种数据土地覆盖空间分布较吻合;3种数据林地划分存在明显差异,其中MICLCover林地成分较好地反映了流域实际情况;MODIS和MICLCover耕地面积与流域实际相符,IGBP DISCover耕地面积明显偏大;3种数据建设用地、裸地、湿地和水域的面积较实际小,说明1 km的空间分辨率过粗,不能细致反映流域中面积较小或较分散的土地覆盖,尤其是IGBP DISCover数据。Google卫星影像样地检验表明,MICLCover精度明显高于IGBP DISCover和MODIS,IGBP DISCover的主要错误是将许多其他土地覆盖划分为耕地,而MODIS的主要错误是将许多其他土地覆盖划分为草地。
Comparative analysis on three land cover datasets based on IGBP classification system over Hanjiang River basin
[J].
The relationship of drought frequency and duration to time scales
[C]//
Propagation dynamics and causes of hydrological drought in response to meteorological drought at seasonal timescales
[J].
Assessing the responses of vegetation to meteorological drought and its influencing factors with partial wavelet coherence analysis
[J].
Propagation dynamics from meteorological to groundwater drought and their possible influence factors
[J].
基于SPI和SPEI指数的锡林郭勒草原干旱时空变化特征
[J].
Temporal and spatial variation of drought in the Xilingol grassland based on the standardized precipitation index and standardized precipitation evapotranspiration index
[J].
Application of vegetation index and brightness temperature for drought detection
[J].
Cloudy region drought index (CRDI) based on long-time-series cloud optical thickness (COT) and vegetation conditions index (VCI):A case study in Guangdong,south eastern China
[J].
Variational mode decomposition
[J].
基于变分模态分解和深度门控网络的径流预测
[J].
Runoff prediction based on variational mode decomposition and deep gated network
[J].
基于峭度的VMD分解中k值的确定方法研究
[J].
DOI:10.16578/j.issn.1004.2539.2018.08.030
[本文引用: 2]
在变分模态分解(Variational mode decomposition,VMD)中,因为分解层数k值属于自定义变量,所以在取值时分解结果会随着k值的变化而得到不同的结果,k值的取值直接影响着结果的准确性,k值取得过大或者过小都会对结果造成影响。基于以上问题,提出了一种利用峭度确定k值的方法。选取k值为2~n的整数,计算当k值为2~n时,每一个k值相关系数最大分量的峭度,并绘制峭度的变化曲线,若在该曲线内峭度没有峰值且单调递增,则继续计算当k为n+1时相关系数最大分量的峭度值,重复以上步骤,以峭度最大作为优化的标准,当峭度最大的时候,k为最佳值。用实际故障信号验证了方法的可行性,为VMD方法的研究提出了一种新的思路。
Research of the method of determining k value in VMD based on kurtosis
[J].
论东亚夏季风的特征、驱动力与年代际变化
[J].
On the characteristics,driving forces and inter-decadal variability of the East Asian summer monsoon
[J].
1961—2014年黄土高原气温和降水变化趋势
[J].
Characteristics of temperature and precipitation on the Loess Plateau from 1961 to 2014
[J].
1986—2019年黄土高原干旱变化特征及趋势
[J].
DOI:10.13287/j.1001-9332.202102.012
[本文引用: 1]
干旱作为极端气候事件之一,其频率和强度的变化影响到区域水资源,而干旱半干旱区植物生长的主要限制因素是水分,因此,研究黄土高原干旱时空特征及未来变化趋势对当地的生态环境具有重要意义。本研究基于1986—2019年降水和温度逐月格点数据,计算标准化降水蒸散发指数(SPEI)和干旱发生频率,并运用Mann-Kendall检验和Sen斜率估计方法,探讨了黄土高原的年、季尺度干旱时空分布及变化特征,最后利用NAR神经网络结合Hurst指数对黄土高原未来干旱趋势进行预测。结果表明: 研究期间,黄土高原总体呈现干旱化趋势,且年际和季节尺度的干旱发生频率在空间上差异较大。其中,年际、春季和冬季以黄土高原东南部和西部干旱发生频率最高,夏季和秋季以西北部干旱发生频率最高。夏季以中度干旱发生频率最高,年际及其他季节以轻度干旱发生频率最高。黄土高原春、夏季呈现干旱化趋势,秋、冬季研究区大部分区域干旱趋势减轻。黄土高原年际、春季、夏季的SPEI值在未来一段时间内仍处于下降趋势,即干旱化趋势加重,且夏季的Hurst指数最大,持续性变化最强,未来持续干旱的可能性高于其他季节。
Variations of drought and its trend in the Loess Plateau from 1986 to 2019
[J].
近60 a黄土高原地区降水集中度与集中期时空变化特征
[J].
DOI:10.13866/j.azr.2022.05.01
[本文引用: 1]
全球气候变暖背景下,厘清黄土高原地区降水集中度(PCD)和集中期(PCP)时空变化规律,对该区水土保持及水资源利用具有重要意义。基于1960—2019年黄土高原地区55个气象站点逐日降水观测资料,利用趋势分析、空间插值、相关分析等方法,分析了近60 a及退耕还林(草)工程前后黄土高原PCD与PCP时空变化特征。结果表明:(1) 1960—2019年黄土高原年均降水量呈减少趋势,年均PCD逐渐减弱、PCP逐渐提前。(2) 黄土高原地区年均降水量和PCD自东南向西北递减,PCP自东向西逐渐递减,但差异不大。PCD变化趋势自东北向西南呈“下降-上升-下降”相间分布,PCP表现出东部推迟、西部提前的态势。(3) 退耕还林(草)工程后,黄土高原年均降水量增加、PCD减弱、PCP推迟。降水量自东向西呈“偏少-偏多”相间分布,其变化趋势以偏多为主;PCD自东北向西南呈“偏低-偏高-偏低”分布规律,其变化趋势以偏低为主;PCP以偏高为主,偏高幅度呈南多北少、东多西少态势,其趋势变化也以偏多为主。(4) 1960—2019年黄土高原地区PCD、PCP与年降水量皆以正相关为主。
Temporal and spatial variations of precipitation concentration degree and precipitation concentration period on the Loess Plateau from 1960 to 2019
[J].
DOI:10.13866/j.azr.2022.05.01
[本文引用: 1]
With global warming as a foundation, it is significantly important that the law of precipitation concentration degree (PCD) and precipitation concentration period (PCP) changes for the Loess Plateau are clarified for the conservation of regional soil and water and utilization of water resources. Based on the daily precipitation observation data compiled from 55 meteorological stations on the Loess Plateau from 1960 to 2019, the temporal and spatial variation characteristics of PCD and PCP on the Loess Plateau in the last 60 years, along with before and after the project of returning farmland to forest (grassland), were analyzed using trend analysis, spatial interpolation, and correlation analysis. The average annual precipitation, PCD, and PCI on the Loess Plateau had a decreasing (downward) trend from 1960 to 2019 according to the results. In addition, the PCD gradually weakened, and the PCI shifted to an earlier date. The spatial distribution characteristics of annual precipitation, PCD and PCI on the Loess Plateau were complex. Annual precipitation and the PCD decreased from southeast to northwest, while PCP gradually decreased from east to west. However, the difference was not significant. The variation trend of the PCP had an alternating distribution law of “decline rise decline” from northeast to southwest. Overall, the PCP had a trend of delaying in the east and advancing in the west. After the project of returning farmland to forest (grassland) was completed, the average annual precipitation increased, the PCD weakened, and the PCP was postponed. The precipitation on the Loess Plateau is distributed alternately from east to west, and its change trend is mainly more. The distribution law of PCD is “low high low” from northeast to southwest, and its variation trend is mainly low. The PCP is mainly on the high side, and the range of the high side is more in the south than the north and more in the east than the west, and the trend change is mainly on the high side. The PCD, PCI, and annual precipitation in the Loess Plateau are mainly positively correlated.
2002—2020年黄土高原土壤水变化及其相关性分析
[J].
Soil water change and its correlation analysis in the Loess Plateau from 2002 to 2020
[J].
黄土高原地区植被指数对干旱变化的响应
[J].
Response of vegetation index to meteorological drought over loess plateau
[J].
2001—2019年黄土高原植被覆盖度时空演化特征及地理因子解析
[J].
Spatio-temporal variations of vegetation coverage and its geographical factors analysis on the Loess Plateau from 2001 to 2019
[J].
山西黄河流域不同土地利用类型NDVI时空变化及其对气温、降水的响应
[J].
Temporal and spatial changes of NDVI of different land covers and their responses to temperature and precipitation in the Yellow River basin of Shanxi
[J].
基于转移函数分析的蒙东地区不同类型植被变化对干旱的响应
[J].
Response of different types of vegetation changes to drought in eastern inner Mongolia based on transfer function analysis
[J].
