

0 引言
生态系统服务是指基于生态系统的结构、过程和功能,直接或间接为人类生活提供的各种惠益,主要包括供给服务、调节服务、支持服务与文化服务等[1]。生态系统服务价值(ecosystem services value,ESV)是以货币的形式来测定土地利用变化对生态系统服务产生的影响。自改革开放以来,由于经济快速发展,人类活动与自然变化愈加繁杂,人地关系矛盾深化,使得部分地区生态系统受到干扰,生态系统服务价值各有损益,对生态安全产生了极大的影响[2]。三生用地转移变化的方向与数量,在一定程度上深刻影响着ESV的变化过程,开展地类变化及其ESV的关联研究,对区域土地资源可持续发展与生态效益提升具有重要意义[3]。相应地,与之有关的研究也成为了众多学者的关注热点,但当前多数研究是基于现在或过去地类变化所引起ESV的增减来评估生态效益,对未来不同模式下ESV的发展鲜有研究[4]。当前,PLUS(patch-generating land use simulation)与CA-Markov(cellular aumatomata-Markov)模型因在模拟用地斑块时空动态变化方面具有明显优势而受到学界的关注[5]。谭昭昭等[6]利用PLUS模型模拟3种情景下浙江东部沿海城市土地利用变化引起的ESV变化,发现生态保护情景下ESV下降速度放缓; 张春悦等[7]基于CA-Markov模型对宁夏平原地区土地利用进行多情景模拟,并计算其生态系统服务价值,发现ESV仅在生态保护情景下有所提高; 冯丽媛等[8]基于CA-Markov模型,对宁夏沿黄生态经济带的土地利用情况进行模拟,揭示了不同情景下土地利用结构的变化,但未对其生态效益进行研究。当前,多数研究是基于现在或过去地类变化所引起ESV的增减来评估生态效益,对未来不同模式下ESV的发展鲜有研究。
1 研究区概况与数据源
1.1 研究区概况
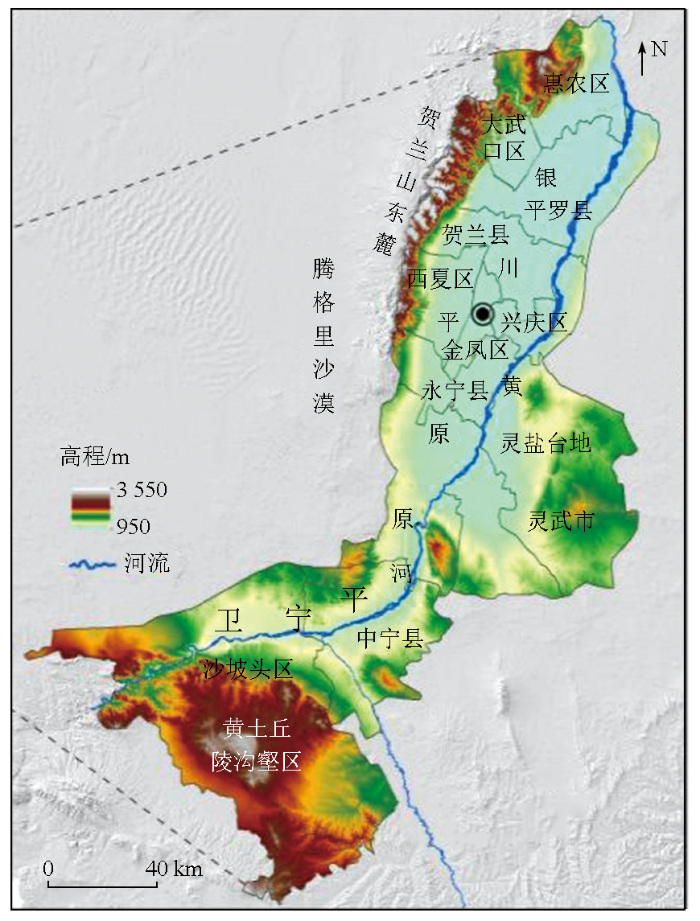
宁夏回族自治区(以下简称宁夏)沿黄生态经济带西依贺兰山、西南毗邻腾格里沙漠、北与乌兰布和沙漠交界、东接毛乌素沙地,三面环沙。黄河在宁夏境内长约397 km,自西南向东北方向蜿蜒而过,冲淤形成卫宁平原与宁夏平原,黄河东岸为灵盐台地、南部为黄土丘陵沟壑区(图1)。省会银川市以及石嘴山市、吴忠市、中卫市的行政中心均位于平原绿洲区域,共13个县(市、区),面积224.31×10⁴ hm2,占宁夏总面积43.65%。伴随着生态移民工程的建设与百万移民迁入,城市化与工业化快速发展,城市工矿用地大幅增加,这些因素均使得该区域国土空间格局发生剧烈变化,生态问题显著。截止2020年,国内生产总值(gross domestic product,GDP)为3 089.31亿元,占宁夏GDP的82.42%; 人口458.63万人,占宁夏总人口的66.02%。
图1
1.2 数据源及其预处理
本文所需数据主要包括土地利用数据、社会经济数据与气候环境数据,土地利用数据来自中国科学院资源环境科学与数据中心,通过ENVI5.5软件进行几何校正、图像增强与拼接等预处理,采用随机森林解译,Kappa系数为0.88; 相关数据均通过ArcGIS重采样至30 m分辨率,投影坐标系统一为Krasovsky_1940_Albers,行列号统一为7681, 10324。依据《土地利用现状分类》(GB/T 21010—2017),参照邹利林等[13]三生用地的分类评价体系,结合研究区际情况,建立了三生用地与土地利用对应关系,即生产用地: (1)耕地; 生态用地: (2)林地、(3)草地、(4)水域、(6)未利用地; (5)生活用地。所需数据说明见表1。
表1 所需数据说明
Tab.1
| 类型 | 名称 | 时间 | 分辨率 | 数据来源 |
|---|---|---|---|---|
| 遥感数据 | 土地利用数据 | 2000年、2010年、2020年 | 30 m×30 m | 中国科学院资源环境科学与数据中心 |
| 社会经 济数据 | 人口、GDP、夜间灯光数据 | 2020年 | 1 km×1 km | |
| 道路数据 | 2020年 | / | Open Street Map | |
| 县(区/市)政府驻地 | 2020年 | / | 全国地理信息资源目录服务系统 | |
| 主要粮食单产值与单价 | 2000年、2010年、2020年 | / | 《宁夏统计年鉴》《全国农产品成本收益资料汇编》 | |
| 气候与 环境数据 | 土壤类型 | 2019年 | 1 km×1 km | 中国科学院资源环境科学与数据中心 |
| 年平均气温、年平均降水 | 2020年 | 1 km×1 km | 国家地球系统科学数据中心 | |
| 高程 | / | 30 m×30 m | 地理空间数据云 | |
| 归一化植被指数(normalized diffeverce vegetation index,NDVI) | 2020年 | 30 m×30 m | 中国科学院资源环境科学与数据中心 |
2 研究方法
2.1 PLUS-Markov 模型
PLUS模型包括土地扩张分析策略(land expansion analysis strategy,LEAS)的转换规则和基于多类随机斑块种子的元胞自动机(celluar aumatomata,CA)模型CARS(CA based on multiple random seeds,CARS)2大模块[14]。其中LEAS模块可以分析用地类型扩张情况及各驱动因子对地类变化的贡献程度,CARS模块在不同情景发展概率的约束下模拟生成不同地类斑块变化结果[15]。本文选取人口、GDP、夜间灯光数据、距铁路距离、距一级道路距离、距二级道路距离、距三级道路距离、距政府驻地距离、高程、坡度、土壤类型、温度数据和降雨数据作为驱动因素进行模拟。Markov模型可以高效率计算长时期土地利用的数量变化[16],将其与PLUS模型结合,可将时序优势与空间模拟优势有机结合,提高土地利用空间格局变化模拟的精度。为防止某地类向其他类无限转变,引入Markov模型设定地类的需求总量。公式如下:
式中: Qt和Qt-1分别为在为t和t-1时间用地类型的情况; Pij为某地类型从t-1到t向另一地类转换的概率,其值介于0~1间,总和为1。
在领域权重设置中,斑块面积(patch area,TA)变化量的大小可以定性表征各用地类型的扩张程度,因此可以作为领域权重测算的依据[17],公式如下:
式中:
模型的精度验证参考Kappa系数和质量因数(figure of merit,FOM)系数值,其中Kappa系数范围在0~1,大于0.7表示模拟结果精度较高,FOM系数范围在0~1,数值越高表示模拟结果精度越高[5]。
2.2 ESV核算模型
3 结果与分析
3.1 三生用地时空特征变化与结果分析
3.1.1 情景模拟参数设置
参考高星等[23]、杨强强等[24]学者的研究,依据地类转移规律与宁夏国土空间规划(2021—2035年)需求,设置3种情景: 一是自然发展情景(natural development scenario,NDS)为基准情景,依据历史变化特征,不设地类转移限制; 二是生态保护情景(ecological protection scenario,EPS),该情景中的参数设定向生态用地保护与发展方向倾斜,其内部的转移概率根据以往发展规律设置,即将草地、水域、林地向建设用地的转移概率降低50%; 耕地向建设用地的转移概率降低30%; 林地向草地转移概率降低30%; 建设用地、草地与未利用地向林地转移概率增加50%; 建设用地、未利用地向草地转移概率增加30%; 未利用地向水域转移概率增加30%; 三是城镇发展情景(urban development scenarios,UDS),该情景以生活用地扩张为主,同时也考虑到对基本农田的保护,将耕地、林地、草地向建设用地转移概率增加20%,建设用地向除了耕地以外的用地类型转移概率降低30%。在EPS和UDS情景模拟中,将水域作为限制区。
为验证PLUS模型对该研究结果的可靠性,基于2010年土地利用数据对2020年地类进行模拟,CARS模块参数设置如: 领域范围选择默认值3,并行线程数量16,斑块生成递减阈值的衰减系数0.9,扩散系数0.1,随机斑块种子的概率0.001,土地利用转移成本矩阵如表2所示。
表2 土地利用转移成本矩阵
Tab.2
| 土地利用 类型 | 耕地 | 林地 | 草地 | 水域 | 建设 用地 | 未利 用地 |
|---|---|---|---|---|---|---|
| 耕地 | 1 | 1 | 1 | 1 | 1 | 1 |
| 林地 | 1 | 1 | 1 | 0 | 1 | 1 |
| 草地 | 1 | 1 | 1 | 1 | 1 | 1 |
| 水域 | 0 | 0 | 0 | 1 | 0 | 0 |
| 建设用地 | 1 | 0 | 1 | 0 | 1 | 1 |
| 未利用地 | 1 | 0 | 1 | 1 | 1 | 1 |
在验证中,共拟合24 923 134个图斑,Kappa系数为0.88,总体精度为0.92,FOM系数为0.24,符合模拟精度要求,同时计算得出不同情景下各用地类邻域权重(表3)。
表3 模拟邻域权重
Tab.3
| 用地类型 | 耕地 | 林地 | 草地 | 水域 | 建设用地 | 未利用地 |
|---|---|---|---|---|---|---|
| NDS | 0.25 | 0.19 | 0.24 | 0.41 | 1.00 | 0.1 |
| EPS | 0.69 | 0.52 | 1.00 | 0.80 | 0.95 | 0.1 |
| UDS | 0.23 | 0.18 | 0.18 | 0.38 | 1.00 | 0.1 |
3.1.2 三生用地时空演变特征
不同模拟情景下三生用地空间差异性明显,但与2010—2020年发展趋势总体一致(图2)。与2020年相比,NDS情景下生产用地与生态用地有所减少,分别减少了0.34×10⁴ hm2与2.83×10⁴ hm2; 生活用地面积有所增加,增加了3.17×10⁴ hm2,符合研究区2000—2020年三生用地惯性发展趋势。
图2
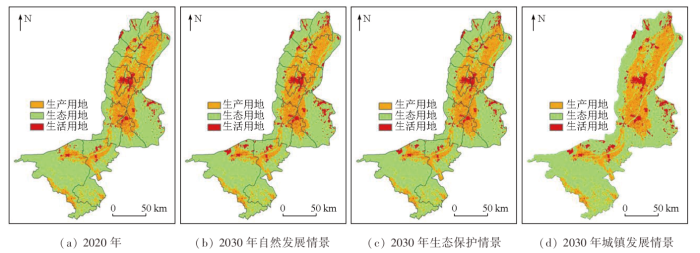
图2
不同模拟情景下三生用地空间分布
Fig.2
Spatial distribution of production-ecological-living land under different simulation scenarios
EPS情景下,生产用地面积增加了0.13×10⁴ hm2,生态用地下降趋势显著减缓,仅降低0.89×10⁴ hm2; 生活用地面积有所扩张,但扩幅较小,面积增加了0.75×10⁴ hm2,该情景下三生用地面积增减幅度较小,反映出三生用地调整趋于稳定。UDS情景下,生产用地与生态用地显著减少,面积分别缩减了0.65×10⁴ hm2与3.94×10⁴ hm2,生活用地面积增加明显,增加了4.60×10⁴ hm2,表明在经济建设下以城市扩张为主要特征的生活用地扩张对生态用地与生产用地形成了挤压,总体发生于大武口区、惠农区、灵武市、沙坡头区以及中宁县境内。总体来看,3种情景下生产用地变化幅度较小,主要在银川平原与卫宁平原呈现增减变化; 生态用地面积有所减少,以内部结构调整为主,空间上主要集中于沙坡头区、白芨滩保护区、黄河河岸防护林带及黄土丘陵水土保持区; 生活用地持续增加,以各市区为核心向周边扩张。
3.2 生态系统服务响应结果分析
3.2.1 ESV数量结构响应特征
通过对2000—2020年以及2030年3种情景下各项生态系统服务价值进行计算,发现2000—2020年ESV呈现增加趋势; 3种模拟情景下较2020年相比,ESV也均有所提升,表现为EPS(11.48×10⁸元)>UDS(2.74×10⁸元)>NDS(1.89×10⁸元),从生态系统服务类型来看,ESV各项结构变化存在一定差异(表4)。
表4 不同情景模拟下单项ESV价值(108元)
Tab.4
| 生态服务分类 | 2000年 | 2010年 | 2020年 | 2030年(ESV值及与2020年相比变化量) | ||||||
|---|---|---|---|---|---|---|---|---|---|---|
| 一级分类 | 二级分类 | NDS | 变化量 | EPS | 变化量 | UDS | 变化量 | |||
| 供给服务 | 食物生产 | 14.83 | 14.63 | 14.55 | 14.48 | -0.07 | 14.66 | 0.11 | 14.42 | -0.13 |
| 原材料生产 | 6.37 | 6.30 | 6.22 | 6.17 | -0.05 | 6.28 | 0.06 | 6.14 | -0.08 | |
| 水资源供给 | -1.49 | -1.00 | -0.42 | -0.13 | 0.29 | 0.26 | 0.68 | 0.05 | 0.47 | |
| 调节服务 | 气体调节 | 22.65 | 22.37 | 22.12 | 21.93 | -0.19 | 22.29 | 0.17 | 21.81 | -0.31 |
| 气候调节 | 40.53 | 39.97 | 39.33 | 38.82 | -0.51 | 39.76 | 0.43 | 38.54 | -0.79 | |
| 净化环境 | 19.78 | 19.97 | 20.22 | 20.33 | 0.11 | 20.76 | 0.54 | 20.37 | 0.15 | |
| 水文调节 | 165.46 | 168.65 | 174.24 | 176.90 | 2.66 | 182.99 | 8.75 | 178.25 | 4.01 | |
| 支持服务 | 土壤保持 | 21.62 | 21.36 | 21.11 | 20.92 | -0.19 | 21.31 | 0.20 | 20.79 | -0.32 |
| 保持养分循环 | 2.89 | 2.85 | 2.82 | 2.80 | -0.02 | 2.84 | 0.02 | 2.79 | -0.03 | |
| 生物多样性 | 18.62 | 18.50 | 18.40 | 18.29 | -0.11 | 18.72 | 0.32 | 18.22 | -0.18 | |
| 文化服务 | 美学景观 | 9.18 | 9.15 | 9.15 | 9.12 | -0.03 | 9.35 | 0.20 | 9.10 | -0.05 |
| 总计 | 320.46 | 322.75 | 327.72 | 329.63 | 1.89 | 339.22 | 11.48 | 330.48 | 2.74 | |
| 变化值 | 2.31 | 4.99 | 1.89 | 11.48 | 2.74 | |||||
NDS情景下,ESV增加了1.89×10⁸元,主要得益于调节服务有所提升,其中水文调节ESV增加了2.66×10⁸元,贡献值最大; EPS情景下,ESV增加了11.48×10⁸元,该情景下ESV增加最多,且各单项ESV均呈现提升状态,尤其调节服务与供给服务贡献值最大,占增加值的比例达到86.15%与7.40%; UDS情景下,ESV增加了2.74×10⁸元,其中水资源供给、水文调节与净化环境服务的ESV值有所增加,分别增加了0.47×10⁸元、4.01×10⁸元和0.15×10⁸元,与NDS情景下单项ESV的增减趋势一致。从单项ESV变化量来看,供给服务从单项ESV变化量来看,供给服务的总变化值在3种情景下均呈现增加趋势,增加值表现为EPS(0.85×10⁸元)>UDS(0.26×10⁸元)>NDS(0.17×10⁸元),但只有水资源供给值在3种情景下都有所增长; 调节服务的总增量与供给服务的增加趋势一致,其增加值表现为EPS(9.89×10⁸元)>UDS(3.06×10⁸元)>NDS(2.07×10⁸元),其中仅净化环境与水文调节值均增加,气体调节与气候调节值在NDS与UDS情景下降低; 支持服务与文化服务在EPS情景下增加,分别增加了0.54×10⁸元与0.20×10⁸元,但在NDS与UDS情景中均有所减少,降低幅度表现为UDS>NDS。总体来看,调节服务增加值对ESV总增量的贡献最大,文化服务贡献值最低。
3.2.2 ESV转移流响应特征
2000—2020年,生产用地转为生态用地以及生态用地内部互转是引起ESV增加的关键三生用地转移类型,ESV增加值占总增量的91.33%; 其中耕地与草地转为水域分别使ESV增加了22.25×10⁸元和17.60×10⁸元,水域面积增加引致水资源供给值与水文调节值有所增加,这是ESV增加的主要原因; 而水域转为生产用地、未利用地及草地转向生活用地是导致ESV降低的关键转移地类,ESV降低值占总减量的76.31%(图3(a))。NDS情景下,生产用地转为生态用地中林地、草地与水域的ESV增加值为2.29×10⁸元,占总增量的23.80%; 而生态用地中内部互转及未利用地转为生产用地的ESV增加值为7.01×10⁸元,占总增量的72.86%; 其中生产用地、生态用地中林地、未利用地与草地转为水域引致ESV增加值占总增量的91.52%; 生态用地中水域转为生活用地以及生态用地内部互转导致ESV损失量分别占总损失量的43.45%与45.31%(图3(b)); EPS情景下,生产用地转为生态用地中林地、草地与水域的ESV增加值为3.04×10⁸元,占总增量的26.11%; 生态用地中内部互转及未利用地转为生产用地与生活用地总计使得ESV增加值为7.98×10⁸元,占总增量的68.44%; 而生态用地中水域的转入引起的ESV增加值占增量的84.08%,生产用地转为生态用地中未利用地及生态用地中林地转为草地与草地转为生产用地使得ESV减少值占总减量的95.90%(图3(c)); UDS情景下,生产用地与生态用地中未利用地及草地转为水域使得ESV增量占总增加值的92.54%,水域转出引起的ESV减少值为总损失量的75.52%,生活用地扩张导致ESV降低值占ESV总减额度的55.96%(图3(d))。可以看出,在宁夏沿黄生态经济带,生产用地转为生态用地及生态用地内部互转是使得ESV增加的主要原因,其中ESV对生态用地中水域面积的变化非常敏感,因此研究区应该注重对生产用地高质量发展与生态用地的保护优先发展。
图3
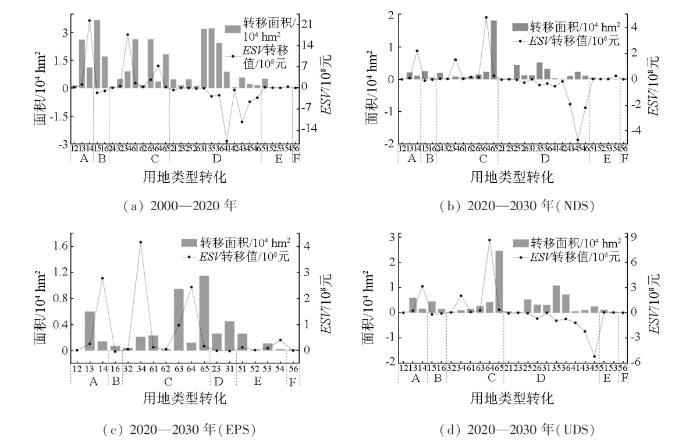
图3
2020—2030年不同情景模拟下ESV转移
注: 横轴中地类转移代码,十位与个位数分别代表初始年份与末期地类代码,如图(a)中12,表示由2000年耕地转为2020年林地。A: 生产用地增加; B: 生产用地降低; C: 生态用地增加; D: 生态用地降低; E: 生活用地增加; F: 生活用地降低。
Fig.3
ESV transfer under different scenarios from 2020 to 2030
2000年—2020年及2020—2030年3种情景下的三生用地转移引起的ESV增减变化幅度有所不同(表5),在2000年—2020年,生产用地的ESV增加最多,为23.44×10⁸元,生态用地因被侵占导致面积缩减,其ESV值下降最多,下降了44.03×10⁸元; NDS情景下,生产用地与生活用地的ESV均有所增加,分别增加了2.71×10⁸元与0.37×10⁸元; 在EPS情景下,三生用地的ESV减少值均为最低,生产、生态与生活用地的ESV分别减少了0.04×10⁸元、0.03×10⁸元、0元,且仅在该情景下生态用地ESV净增长,增加了8.03×10⁸元; 在UDS情景下生产用地与生态用地的ESV值增加最多,增值分别为3.29×10⁸元和11.14×10⁸元,同时也在该情景下减少最多,分别减少了0.30×10⁸元和11.47×10⁸元。从三生用地的ESV净值来看,生态用地对研究区的ESV提升贡献最大,其贡献率均在78%以上; 生产用地次之,贡献率在13%到21%之间; 生活用地最小,其净值贡献率不足1%。EPS情景下生态用地与生活用地的ESV净值贡献率均高于另两种情景,UDS情景下生产用地的ESV净值贡献率最高,这得益于该情景下对基本农田的保护。
表5 不同情景模拟下三生用地ESV变化(108元)
Tab.5
| 情景 | 生产用地 | 生态用地 | 生活用地 | |||||||||
|---|---|---|---|---|---|---|---|---|---|---|---|---|
| 增值 | 减值 | 净值 | 净值贡献 率/% | 增值 | 减值 | 净值 | 净值贡献 率/% | 增值 | 减值 | 净值 | 净值贡献 率/% | |
| 2000年—2020年 | 23.44 | -2.65 | 68.49 | 20.90 | 29.85 | -44.03 | 257.07 | 78.44 | 0.70 | 0.00 | 2.16 | 0.66 |
| 2020年—NDS情景 | 2.71 | -0.12 | 44.24 | 13.42 | 7.98 | -9.05 | 282.24 | 85.62 | 0.37 | 0.00 | 3.15 | 0.96 |
| 2020年—EPS情景 | 2.86 | -0.04 | 45.12 | 13.30 | 8.06 | -0.03 | 290.75 | 85.71 | 0.63 | 0.00 | 3.34 | 0.98 |
| 2020年—UDS情景 | 3.29 | -0.30 | 45.03 | 13.64 | 11.14 | -11.47 | 282.08 | 85.46 | 0.09 | 0.00 | 2.98 | 0.90 |
3.2.3 关键ESV转移空间分异响应特征
宁夏沿黄生态经济带的ESV值损益呈现出明显的空间分异性(图4)。2000—2020年,ESV值提升区主要分布在银川平原中北部,其次在黄土丘陵沟壑区、贺兰山东麓和灵武市的白芨滩风沙林带也有一定的高值区,这主要得益于保护区的生态修复及实施的退耕还林、封山育林育草等工程的实施(图4(a)); 受到土壤沙化,生活用地扩张所致,ESV降低区主要集中在银川市城区、黄河东岸的灵盐台地以及中宁县境内(图4(e))。2020—2030年,NDS情景下,ESV增长显著区域在银川平原中北部、以及永宁县、白芨滩保护区、中宁县、沙坡头区境内(图4(b)); ESV损失高值区在宁东能源基地最突出(图4(f))。EPS情景下高值区与NDS情景下基本一致,但辐射范围较大(图4(c)); ESV降低最显著的区域是在沙坡头区和中宁县交界地带,以及利通区境内(图4(g))。UDS情景下,ESV增量区多以散点分布,主要以银川平原东南部与卫宁平原、灵盐台地等区域为核心向周边辐射扩张(图4(d)); ESV降低区域主要在银川市与贺兰县城区,受生活用地扩张影响大(图4(h))。
图4
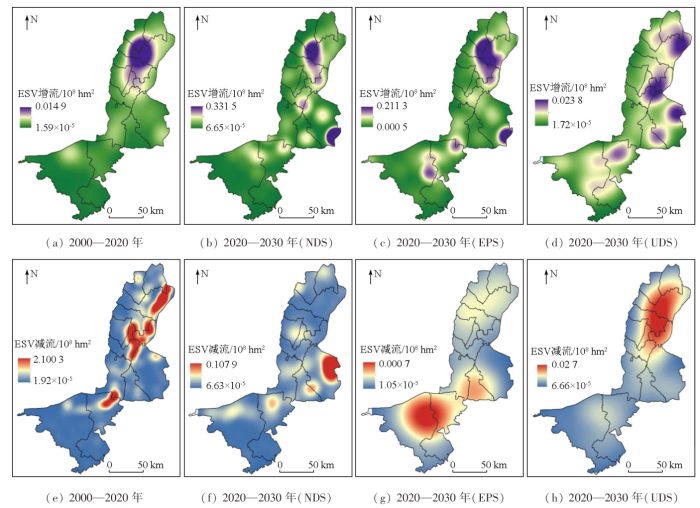
图4
2020年及3种情景模拟下各项ESV损益空间图
Fig.4
Spatial diagram of ESV P and L in 2020 of three scenarios
4 结论
本文以宁夏沿黄生态经济带为研究区,运用PLUS-MarKov模型对三生用地变化作了多情景模拟,并从数量结构、转移流特征及其时空演变特征等方面探究了ESV的响应情况。主要结论如下:
1)NDS情景下生活用地扩张,生产与生态用地缩减,符合研究区2000—2020年惯性发展趋势; EPS情景下生产、生活用地略有扩张,生态用地面积减少了0.89×10⁴ hm2; UDS情景下生活用地面积显著增加,增加值为4.60×10⁴ hm2,生产和生态用地面积减少。3种情景下生产用地主要在银川平原与卫宁平原呈现增减变化; 生态用地面积略减,以内部结构调整为主且主要发生在沙坡头区、白芨滩自然保护区、黄河河岸防护林带及黄土丘陵水土保持区; 生活用地持续增加,以各市区为核心向周边扩张。
2)ESV对三生用地变化的响应也存在明显差异。ESV增加值表现为EPS(11.48×10⁸元)>UDS(2.74×10⁸元)>NDS(1.89×10⁸元),各单项生态系统服务中,调节服务与支持服务对ESV提升贡献最大,尤其以水文调节与气候调节值贡献显著; 文化服务贡献值最低,EPS情景下各单项ESV均呈现增加趋势。从三生用地的ESV净值来看,生态用地对研究区的ESV提升贡献最大,其贡献率均在78%以上; 生产用地次之; 生活用地最小,其净值贡献率不足1%。生产用地转为生态用地及生态用地中未利用地及草地转为水域使得ESV大幅提升,生态用地中水域转为生产与生活用地导致ESV损失; 表明ESV对生态用地中水域的转变非常敏感。
3)ESV对三生用地变化的空间响应存在地域分异性。NDS与EPS情景下ESV值提升区以银川平原中北部、卫宁平原、白芨滩自然保护等区域为核心向周边辐射扩张,EPS情景下ESV高值区辐射范围最大; UDS情景下,ESV增量区多以散点分布; 不同情景ESV降低区分布各异,NDS、EPS与UDS情景下,ESV损失高值区分别在宁东能源基地、沙坡头区和中宁县交界地带,利通区、银川市与贺兰县城区,表明ESV减少受生活用地扩张影响大。
参考文献
生态系统服务研究进展与展望
[J].
DOI:10.11867/j.issn.1001-8166.2020.069
[本文引用: 1]

生态系统服务是指人类从自然生态系统中获得的惠益。加强气候变化背景下景观格局与生态系统服务的定量关系研究,在此基础上优化区域土地系统,是提高区域/景观提供生态系统服务能力的重要途径。评述了生态系统服务测量、相互关系和优化管理研究进展和存在的问题。强调生态系统服务物质量准确测量是价值化的基础,约束线方法在刻画生态系统服务相互关系的非线性特征和阈值方面具有较大潜力,应从人与环境耦合系统整体性出发,研发新一代的地球系统模式,在区域尺度上优化生态系统服务,这是实现区域可持续发展的景观可持续科学途径。
Research progress and prospect of ecosystem services
[J].
DOI:10.11867/j.issn.1001-8166.2020.069
[本文引用: 1]
Ecosystem services refer to the benefits that humans obtain from natural ecosystems. Landscape pattern is closely related to ecosystem processes/functions. Understanding the quantitative relationship between landscape pattern and ecosystem services in the context of climate change is an important way to improve the ability of a region/landscape to provide ecosystem services. This article reviewed the progress and existing problems in the research field of ecosystem service measurement, mutual relationship and optimal management. This article emphasized that the accurate measurement of the amount of ecosystem services is the basis of valuing it, and the constraint line approach has great potential in portraying the nonlinear relationship and threshold characteristics of ecosystem services. It is necessary to start from the integrity of human-environment coupling system to develop a new generation of earth system models and optimize regional ecosystem services on this basis, which is a landscape sustainability science approach to achieve the goal of regional sustainable development.
土地利用变化背景下沂河流域生态系统服务价值时空格局演化
[J].
Spatio-temporal pattern of ecosystem service value evolution in the Yihe River Basin in the context of land use change
[J].
固原市原州区2000—2018年 "三生" 用地及生态系统服务变化
[J].
Changes in productive-living-ecological land and ecosystem services in Yuanzhou district of Guyuan City during 2000-2018
[J].
生态服务价值对土地利用变化的时空响应研究——以徐州市为例
[J].
Spatial-temporal response of ecological service value to land use change:A case study of Xuzhou City
[J].
基于PLUS模型的山区城镇景观生态风险动态模拟
[J].
Dynamic simulation of landscape ecological risk in mountain towns based on PLUS model
[J].
浙江东部沿海城市土地利用模拟及生态系统服务价值评估
[J].
DOI:10.13287/j.1001-9332.202310.025
[本文引用: 1]
模拟浙江东部沿海城市土地利用变化(LUCC)引起的生态系统服务价值(ESV)变化,对区域可持续发展和生态安全具有重要意义。本研究以浙江东南沿海城市为研究区,选取2000—2020年3期土地利用及政府统计年鉴为基础数据,分析期间LUCC对ESV的影响,利用PLUS模型模拟2030年自然发展、生态保护和城镇发展情景下LUCC,基于格网尺度分析ESV的空间分布和集聚程度,并明晰ESV的敏感性特征。结果表明: 2000—2020年,研究区建设用地面积呈显著增加趋势,而林地、耕地和水域面积明显减少,导致ESV呈持续下降趋势,减幅达160×10<sup>8</sup>元。2030年自然发展、生态保护和城镇发展情景下,建设用地分别增加93624、54927和111966 hm<sup>2</sup>,东部平原地区将成为建设用地扩张的集聚区;3种情景下的ESV分别为1693×10<sup>8</sup>、1729×10<sup>8</sup>和1688×10<sup>8</sup>元,均低于2020年ESV,生态保护情景下ESV下降速度放缓。研究区ESV呈现西高东低的空间分布特征,热点和冷点分布范围较大且集聚性较强,热点区域主要集中在西部,冷点区域主要分布在东部和北部。
Simulation of land use and assessment of ecosystem service value in the eastern coastal cities of Zhejiang Province,China
[J].
多情景模拟下宁夏平原生态系统服务簇识别研究
[J].
DOI:10.11821/dlyj020220289
[本文引用: 1]
识别生态系统服务簇及其演化轨迹对区域生态服务管理至关重要,但目前研究多基于历史时期或单一时间节点,对于生态系统服务簇进行情景分析的研究还较为欠缺。本文以宁夏平原为研究对象,首先基于CA-Markov模型对宁夏平原地区土地利用进行多情景模拟,然后使用价值当量因子法对生态系统服务价值进行核算,最后使用Pearson相关系数法分析各项生态系统服务价值间的权衡协同关系,使用K-Mean聚类分析及稳定隐射变化轨迹法识别生态系统服务簇及其演化轨迹。结果发现:不论是历史时期还是未来各种情景之下,宁夏平原土地利用面积转化及空间转置集中在林地、湿地与建设用地当中;除生态保护情景下宁夏平原生态系统服务价值将由116.75亿元增至135.25亿元,其余各情景以及历史时期均呈不同程度的下降趋势;在历史时期以及未来多情景下,宁夏平原各类型服务价值之间大部分呈协同关系,优势簇以食物生产为主导功能,且常年以此类型服务簇为主。
Identification of ecosystem service bundles in Ningxia Plain under multi-scenario simulation
[J].
基于CA-Markov模型的宁夏沿黄生态经济带土地利用变化及模拟研究
[J].
A study of land use change and simulation of a Ningxia eco-economic belt along Yellow River based on CA-Markov model
[J].
宁夏沿黄经济带生态用地格局演变及其驱动机制
[J].
DOI:10.15957/j.cnki.jjdl.2022.06.018
[本文引用: 1]
基于多源遥感数据支持,采用土地利用转移流和标准椭圆差等方法,分析了宁夏沿黄经济带生态用地演变特征及其驱动机制。结果表明:①生产和生活用地挤占生态用地现象明显,1980—2018年生态用地占比由71.68%降为66.35%。重点生态功能用地增加,形成了沙坡头、白芨滩以及银川平原中北部三个防护林带和黄土丘陵沟壑区水土保持林区,银川平原湿地面积扩大,生态用地时空结构有所优化。②生态用地在空间上呈现为西南—东北方向变化趋势,且由早期“面域”调整转为后期“点域”优化。③生态用地变化体现为“驱动力—响应—结果”的驱动机制,城镇化和工业化、生态移民工程、绿洲农业发展是生态空间受到挤压的主因,生态建设与修复是优化生态用地格局与提升生态服务功能的重要举措。④基于土地利用转移流的驱动力溯源分析方法,为土地利用变化驱动因子及其定量测评提供新的分析视角与方法。
Evolution and driving mechanism of ecological land use along the yellow economic belt in Ningxia
[J].
DOI:10.15957/j.cnki.jjdl.2022.06.018
[本文引用: 1]
Exploring the temporal and spatial evolution characteristics of ecological land,and can provide decision-making reference for ecological protection and construction of high-quality development pilot zone in the Yellow River Basin. Based on multi-source remote sensing data,land-use flow and standard ellipse difference are used to analyze the characteristics and driving mechanism of ecological land use evolution along the Yellow Economic Belt in Ningxia. The results show that: 1) The ratio of ecological land used for production and living decreases from 71.68% to 66.35% in 1980-2018. It shows a significant increase in term of the key ecological function land,due to the new shelterbelts in Shapotou,Baijitan,the middle and northern part of Yinchuan Plain,conservation forest in loess hilly-gully area,and the wetland area in Yinchuan plain. The temporal and spatial structure of ecological land is optimized. 2) The ecological land presents the spatial pattern of southwest-northeast direction,and changes from "slice" adjustment to "point" optimization in the later period. 3) The change of ecological land use is reflected as the dynamic-response-result mechanism. Urbanization and industrialization,ecological migration project and oasis agricultural development are the fundamental driving forces of ecological space squeezing. Ecological construction and restoration provide ecological security guarantee for regional development. 4) Based on the driving force traceability method of land use transfer flow,it provides a new perspective and method for the driving force of land use change and its quantitative evaluation.
基于改进FLUS模型的北京市低碳土地利用情景模拟
[J].
Simulations of the low-carbon land use scenarios of Beijing based on the improved FLUS model
[J].
Multi-scenario simulation and driving force analysis of ecosystem service value in arid areas based on PLUS model:A case study of Jiuquan City,China
[J].
基于SD-FLUS模型的宁夏土地利用多情景模拟
[J].
Multi-scenarios simulation of Ningxia land use in China based on SD-FLUS model
[J].
中国县级"三生用地" 分类体系的理论构建与实证分析
[J].
An classification systems of production-living-ecological land on the county level:Theory building and empirical research
[J].
Understanding the drivers of sustainable land expansion using a patch-generating land use simulation (PLUS) model:A case study in Wuhan,China
[J].
A simulation analysis of land use changes in the Yarlung Zangbo River and its two tributaries of Tibet using the Markov-PLUS model
[J].
Determining and forecasting drought susceptibility in southwestern Iran using multi-criteria decision-making (MCDM) coupled with CA-Markov model
[J].
基于PLUS模型的城市生态系统服务价值多情景模拟——以汉中市为例
[J].
Multi-scenario simulation of urban ecosystem service value based on PLUS model:A case study of Hanzhong city
[J].
基于单位面积价值当量因子的生态系统服务价值化方法改进
[J].
Improvement of the evaluation method for ecosystem service value based on per unit area
[J].
DOI:10.11849/zrzyxb.2015.08.001
[本文引用: 2]
Ecosystem service value is the base of decision-making for ecological protection, ecological regionalization and ecological compensation, and it appears the dynamic spatio-temporal changes which are closely connected with the variations of ecological structure and function. However, it is still lack of a universal and integrated dynamic evaluation method for ecosystem service value in China. Based on literature survey, expert knowledge, statistical data and remote sensing data, using model simulations and GIS spatial analysis method, this paper modified and developed the method for evaluating the value equivalent factor in unit area, and proposed an integrated method for dynamic evaluation on Chinese terrestrial ecosystem service value. This method can realize the comprehensive and dynamic assessment of ecosystem service value for 11 service types of 14 different types of terrestrial ecosystem at monthly and provincial scales in China. The preliminary application indicated that the total ecosystem service value was 38.1×10<sup>12</sup> yuan in 2010, in which the value from forest ecosystem was the highest, accounting for about 46%, followed by water body and grassland. Among different ecosystem service types, the contribution from regulation function was the highest, especially the values from hydrological regulation and atmospheric regulation which accounted for about 39.3% and 18.0% of total service value, respectively. Moreover, ecosystem service value presented apparent spatio-temporal patterns in China. Spatially, the ecosystem service value decreased from southeast to northwest and the highest value appeared in southeastern and southwestern regions. Temporally, the ecosystem service value for most of the ecosystems attained the peak in July and reached the trough during December and January except desert, barren and glacier ecosystem. Generally, although this established method still needs to be developed and optimized, it is the first to provide a relatively comprehensive approach for the spatio-temporal dynamic evaluation of ecosystem service value in China, which will be helpful to the scientific decision-making on natural capital rating and ecological compensation.
黄河上游荒漠绿洲生态系统服务对三生用地变化的响应——以银川市为例
[J].
DOI:10.18402/resci.2023.01.14
[本文引用: 1]
【目的】探究荒漠绿洲三生用地变化及其生态效应,可为黄河流域生态保护和高质量发展提供决策参考。【方法】本文以1990—2020年黄河上游荒漠绿洲区——银川市为例,提出了生态系统服务价值(ESV)当量因子的系数修订方法,建立了银川市与全国ESV当量因子的系数关系,分析了ESV对三生用地时空变化的响应特征。【结果】结果表明:①生态用地在银川市三生用地中比例最高,但研究时段内有所降低,由1990年的69.49%下降为2020年的57.68%,同期,生产用地稳中有增,由28.54%提升为32.52%,生活用地扩张迅速,由2.37%提升为9.81%;生活用地动态度变化剧烈,生产用地与生态用地动态度渐趋平缓。②1990—2020年ESV总量增加了38423.65万元,生态用地质量提升对ESV的增加效应大于生产用地和生活用地扩张导致的ESV降低效应;结构上,调节服务对ESV的贡献最大且持续提升,比例从1990年的82.29%增为2020年的83.76%,其他服务比例均有所降低。③城市扩张、能源基地建设、移民迁入等因素是导致ESV下降的重要原因,导致城区、宁东能源基地和重点移民迁入区ESV降低;生态建设是ESV的提升主因,白芨滩自然保护区、黄河生态带核心区以及贺兰山东麓葡萄长廊等区域的ESV增加明显。【结论】今后发展中,需要提升生活用地和生产用地的效率以降低其扩张速率,以降低挤占生态用地的压力,同时,需要持续改善生态用地质量,以促进荒漠绿洲生态系统健康可持续发展。
Response of desert oasis ecosystem services to the production-living-ecological land change in the upper reaches of the Yellow River:A case study in Yinchuan City
[J].
DOI:10.18402/resci.2023.01.14
[本文引用: 1]
[Objective] Exploring the changes and ecological effects of the ecological land in the desert oasis area can provide a decision-making reference for the ecological protection and high-quality development of the Yellow River Basin. [Methods] Taking Yinchuan City, a desert oasis in the upper reaches of the Yellow River, as an example, this study put forward the coefficient revision method of ecological service value (ESV) equivalent factors, established the relationship of ESV equivalent factor coefficients between Yinchuan City and China nationwide, and analyzed the response characteristics of ESV to the spatial and temporal changes of production-living-ecological land. [Results] The results show that: (1) The proportion of ecological land was the highest among the production-living-ecological land in Yinchuan City, but this proportion decreased during the study period, from 69.49% in 1990 to 57.68% in 2020. During the same period, the production land increased steadily, from 28.54% to 32.52%, and the living land expanded rapidly, from 2.37% to 9.81%. The dynamic degree of living land changed dramatically, but the dynamic degree trends of production land and ecological land gradually became smooth. (2) During the study period, the total amount of ESV increased by 384.2365 million yuan, and the positive effect of ecological land quality improvement on ESV was greater than the negative effect of the expansion of production land and living land on ESV. The contribution of regulating services to ESV was the largest and continued to increase, with the proportion increasing from 82.29% in 1990 to 83.76% in 2020, but the proportion of other services had decreased. The negative supply services are mainly related to the increase of water-consuming crop planting. (3) Urban expansion, energy base construction, and migration into the city are important reasons for the decline in ESV, resulting in lower ESV in the urban area, the Ningdong energy base, and key immigration areas; ecological construction is the main reason for the increase in ESV, with significant increases in areas such as the Bailitan Nature Reserve, the core area of the Yellow River Ecological Belt, and the grape production corridor at the eastern foot of the Helan Mountains. [Conclusion] In future development, it is necessary to improve the efficiency of living land and production land use to reduce the pressure of their expansion on ecological land, and to continuously improve the quality of ecological land to promote the healthy and sustainable development of the desert oasis ecosystem.
基于NDVI的中国海岛县生态系统服务价值时空变化
[J].
DOI:10.15957/j.cnki.jjdl.2021.09.019
海岛是陆地生态和海洋生态的汇合,海岛县是海陆生态空间复合系统。文章基于归一化植被指数(NDVI),运用生态系统服务价值(ESV)系数法,分析了1990—2018年中国12个海岛县植被动态和生态系统服务价值的变化。 结果表明:1990—2018年,中国12个海岛县的平均NDVI在0.347~0.380之间,整体上呈下降趋势;生态系统服务价值总额从1990年的8.27亿美元下降到2018年的8.21亿美元,呈现区域差异性。长海县、长岛县、崇明区、平潭县、岱山县、洞头区、嵊泗县和东山县8个海岛县的NDVI呈下降趋势,玉环市、定海区、普陀区和南澳县4个海岛县的NDVI呈增长状态;长海县、长岛县、平潭县、岱山县、东山县、洞头区和普陀区7个海岛县的ESV呈下降趋势,南澳县、定海区、玉环市、崇明区和嵊泗县5个海岛县的ESV呈增长状态。
Spatial and temporal change of ecosystem service value in China's Island Counties base on NDVI
[J].
DOI:10.15957/j.cnki.jjdl.2021.09.019
Island is a combination of terrestrial ecology and marine ecology,and island county is a space composite system of terrestrial ecology and marine ecology. This paper analyzes the changes of vegetation dynamics and ecosystem service value in 12 island counties of China from 1990 to 2018 by using the normalized difference vegetation index (NDVI) and the ecosystem service value (ESV) coefficient method. According to the research results,the average NDVI of China's 12 island counties was between 0.347 and 0.380,showing a downward trend on the whole,and the total ESV declined from USD 827 million to USD 821 million,showing regional difference in the period from 1990 to 2018. In the period above,the NDVI of eight island counties,including Changhai County,Changdao County,Chongming District,Pingtan County,Daishan County,Dongtou County,Shengsi County and Dongshan County,shows a downward trend while that of four island counties,including Yuhuan City,Dinghai District,Putuo District and Nanao County,was on the rise. The ESV of seven island counties,including Changhai County,Changdao County,Pingtan County,Daishan County,Dongshan County,Dongtou District and Putuo District showed a downward trend while that of five island counties,including Nanao County,Dinghai District,Yuhuan City,Chongming District and Shengsi County,was on the rise. The study on the temporal and spatial variations of NDVI and ESV in China's island counties will provide scientific reference for the modernization of China's island governance system and capacity.
石羊河流域自然植被对生态系统服务的约束效应
[J].
Study on the constraint effect of natural vegetation on ecosystem services in the Shiyang River Basin
[J].
生态移民区“三生”用地变化对生态系统服务的影响--以宁夏红寺堡区为例
[J].
DOI:10.12118/j.issn.1000–6060.2021.06.30
[本文引用: 1]
土地系统运行以土地可持续利用与人类福祉为准绳。以全国最大的生态移民区红寺堡区为例,基于不同计量方法和GIS空间分析法,对红寺堡区2000—2018年的“三生”用地转型及生态服务变化进行定量研究。结果表明:(1) 红寺堡区基本形成以中部灌区生活生产、生产生态空间为主,周边为生态空间的“三生”格局,国土开发格局逐渐优化。(2) 生产生态用地减少3.42×10<sup>4</sup> hm<sup>2</sup>,生态用地增加1.24×10<sup>4</sup> hm<sup>2</sup>,生态生产用地增加0.16×10<sup>4</sup> hm<sup>2</sup>,生活生产用地增加2.02×10<sup>4</sup> hm<sup>2</sup>。(3) 生态系统服务价值共增加11.18×10<sup>8</sup>元。植被恢复是生态系统服务价值增加的主因,而建设用地对其他用地的侵占则是导致生态系统服务价值降低的主因。(4) 协同推进山水林田湖草治理,做好已有生态用地的质量提升和绿地生态网络建设,通过优化生态系统服务结构提升区域生态系统的服务功能,从而实现生产空间的集约化发展、生态空间的提质增效及生活空间的优美宜居。
Effects of “ecological-production-living” land changes on ecosystem services in ecological migration area:A case of Hongsibu District in Ningxia
[J].
模拟多情景下白洋淀流域土地利用变化及生态系统服务价值的空间响应
[J].
Land use change and ecosystem service value measurement in Baiyangdian Basin under the simulated multiple scenarios
[J].
