

0 引言
作为森林生态系统的重要干扰因子,森林火灾会显著改变森林生态系统的景观格局和地表覆被,短时间内燃烧地上和地下可燃物,释放大量温室气体到大气中,显著改变过火区域的地表反照率[5]。相关研究表明森林火灾产生的地表残留覆盖物(黑色、灰色或灰白色等),会导致过火区域短期内地表反照率显著降低[6],然后随着地表残留覆盖物消失和生态系统演替变化,过火区域地表反照率在中长期时间尺度逐渐升高,直至恢复到森林火灾发生前水平[7-8]。然而,在不同地理区域和地表覆盖类型下,地表反照率对火灾的响应变化规律和变化强度在不同时空尺度存在显著的差异。Liu等[9]和Amiro等[10]研究基于地面观测结果发现,阿拉斯加北方森林火灾发生后,随着常绿针叶林的消失和森林生态系统的演替过程,过火区域在植被生长季(春季、夏季和秋季)的地表反照率呈现显著的增加趋势,并显著影响区域的辐射能量平衡和蒸散发过程。Lyons等[8]基于中分辨率成像光谱仪(Moderate Resolution Imaging Spectroradiometer,MODIS)数据分析了阿拉斯加北方森林火灾后地表反照率的变化,发现森林火灾发生后火烧迹地的地表反照率首先降低,在之后的30 a逐渐升高。相反,Jin等[5]基于MODIS反照率数据分析了澳大利亚森林和草原火灾对地表反照率的影响,发现火灾发生后过火区域的短波地表反照率快速下降(平均降低0.024),并导致显著的区域增温效应(0.52 W/m2); Govaerts等[11]基于Meteosat地表反照率数据分析了非洲森林火灾后地表反照率的变化,估计北半球非洲(撒哈拉以南地区)森林火灾导致地表反照率相对降低25%; Gatebe等[12]利用MODIS数据评估了北非撒哈拉地区不同土地覆盖类型的野火导致的地表反照率变化,发现火灾发生后平均地表反照率显著降低,并且火灾对反照率的影响很大程度上取决于植被冠层结构、土壤反射率、燃烧强度、未燃凋落物反射率和植被的更新与恢复速率等因素[13]。因此目前虽然已有一些地表反照率时空变化的观测和分析,但是仍然缺乏基于卫星遥感数据的地表反照率对森林火灾的响应变化规律分析,特别是我国大兴安岭地区地表反照率对森林火灾的响应变化机制仍有待深入探索。
因此本研究以2003年“5·5”大兴安岭金河林业局森林火灾为例,基于长时间序列的地表反照率与叶面积指数(leaf area index,LAI)遥感数据集,分析了大兴安岭地区森林火灾后地表反照率的短期和中长期响应变化规律。本研究将有助于加深对地表反照率时空变化规律的认识,为更全面地评价森林火灾在全球气候变化的影响和作用奠定基础。
1 研究区概况及数据源
1.1 研究区概况
本研究以2003年“5·5”大兴安岭金河林业局森林火灾为例,分析了地表反照率对森林火灾的多时间尺度响应变化,研究区域为内蒙古自治区呼伦贝尔市根河市(地理坐标120°12'~122°55'E,50°20'~52°30'N)(如图1所示),研究区域地表覆盖以落叶针叶林和落叶阔叶林为主,主要树种包括兴安落叶松(Larix gmelinii)、白桦(Betula platyphylla)、樟子松(Pinus sylvestris var. mongolica)和山杨(Populus davidiana)等。其中森林火灾发生于2003年5月5日,起火地点为内蒙古自治区呼伦贝尔市根河市金河林业局金河镇,然后扩散蔓延至金河林业局和根河林业局部分区域,燃烧造成大量林业和生态资源损失,显著改变了过火区域的地表景观(如图2所示),至5月11日下午被完全扑灭,过火森林蓄积62.45万m3,过火面积达1 086.73 km2[14]。
图1
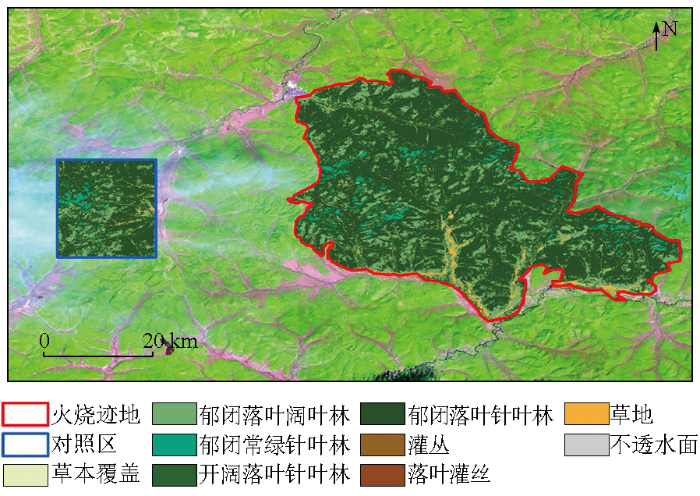
图2
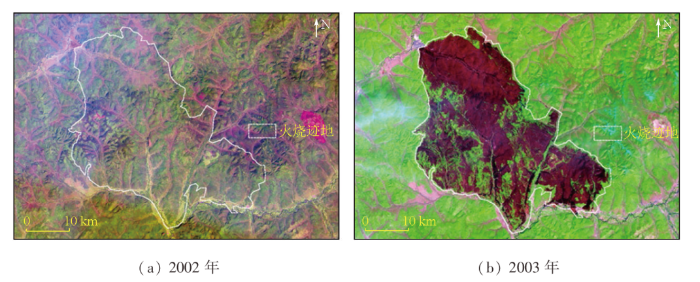
图2
森林火灾发生前后火烧迹地Landsat遥感影像比较
Fig.2
Comparison of Landsat images of burned area before and after forest fire
1.2 数据源及其预处理
1.2.1 Landsat数据
为了准确提取火烧迹地的空间范围,本研究使用森林火灾发生前后观测时间为2002年7月26日和2003年6月11日的Landsat5 TM遥感影像数据进行提取和分析。首先对Landsat影像进行辐射定标、云掩模和大气校正等预处理[15],将原始影像像元亮度值(digital number,DN)值转化为地表反射率[16]。然后对影像进行裁剪和拼接处理,以获得整个研究区的森林火灾发生前后的地表反射率数据。最后通过归一化燃烧比(normalized burn ratio, NBR)和差值归一化燃烧比(difference normalized burn ratio, dNBR)进行火烧迹地范围提取[17],计算公式分别为:
式中:
1.2.2 GLASS地表反照率和LAI数据
为了分析森林火灾发生后地表反照率和植被的响应变化过程,本研究使用2002—2013年的全球陆表卫星数据集(Global Land Surface Satellite,GLASS)[18-19]地表反照率和LAI数据集(数据下载自
1.2.3 土地覆盖类型数据
为了获取研究区土地覆盖情况,本研究使用了2000年全球30 m分辨率地表覆盖精细分类产品[23]。该数据集为基于Landsat卫星影像数据,使用耦合变化检测和动态更新的自动化地表覆盖动态监测方案生成,包括1985—2020年全球30 m精细地表覆盖动态监测数据,共包含29种地表覆盖类型,更新周期为5 a,可以通过地球大数据科学工程数据共享服务系统(
2 研究方法
2.1 对照区选取
为了与火烧迹地反照率变化过程进行比较,本研究在过火区域附近选择与森林火灾发生前地表覆盖类型相似的区域作为对照区。其中对照区选取方法为首先使用缓冲区分析获得火烧迹地附近10~30 km区域,然后统计地类相似的区域作为对照区。最终选取位于火烧迹地西侧30 km处的矩形区域(如图1中蓝色矩形框所示)作为对照区,其中火烧迹地火灾发生前郁闭落叶阔叶林和落叶针叶林分别占21.5%和72.3%,而对照区中郁闭落叶阔叶林和落叶针叶林分别占21.8%和72.3%,可以认为2个区域地表覆盖类型相似,能够作为火烧迹地的参照比较区域。
2.2 趋势分析
式中: T为Thiel-Sen趋势分析得出的时间序列数据变化趋势; X为地表反照率或LAI数据; i和j分别为时间数据序号(j>i)。当得出的变化趋势为正(T>0)时,表明时间序列数据呈现升高趋势; 当得出的变化趋势为负时(T< 0),表明时间序列数据呈现降低趋势。
Mann-Kendall统计检验分析可以进一步得到Thiel-Sen趋势分析的显著性,公式为:
式中:
2.3 相关分析
本研究使用皮尔逊相关系数来分析森林火灾发生后地表反照率与LAI数据之间的相关性,公式为:
式中: r为皮尔逊相关系数;
3 结果与分析
3.1 地表反照率对森林火灾的响应变化分析
为了全面准确地分析地表反照率对森林火灾的响应变化规律,本研究分析了2003年“5·5”森林火灾发生短期(1 a内,包括火灾发生前后的2002年和2003年)和中长期(10 a)火烧迹地(图1中红色框区域)的地表反照率响应变化,并与同期的LAI变化进行比较分析。
非积雪覆盖期森林火灾发生前后(2002年和2003年)火烧迹地地表反照率与LAI随时间变化如图3所示。在森林火灾发生后,在非积雪覆盖期火烧迹地的地表反照率较火灾发生前同期地表反照率显著降低(反照率最高值从2002年的0.145降低至2003年的0.129),而植被LAI曲线呈现出右移趋势(植被物候期延迟现象),地表反照率和LAI均呈现先增高后降低的季节性变化过程。2003年火烧迹地区域地表反照率和LAI在森林火灾发生后首先快速降低(5月9—17日),然后随着过火区域植被生长和恢复过程地表反照率和LAI又快速升高(5月17日—7月4日)。然而,如果选择森林火灾发生后的中长期时间尺度(2004—2013年)进行分析,却可以发现非积雪覆盖期火烧迹地地表反照率的中长期响应变化与短期变化呈现相反的变化趋势(图4)。
图3
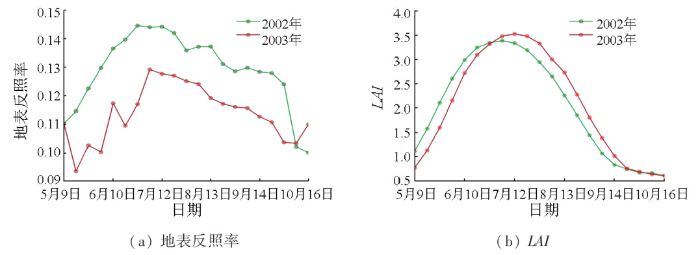
图3
森林火灾发生前后年份(2002年和2003年)火烧迹地非积雪覆盖期地表反照率和LAI随时间变化
Fig.3
Temporal changes of surface albedo and LAI in the burned area before and after forest fire (2002 and 2003) during non-snow covered period
图4
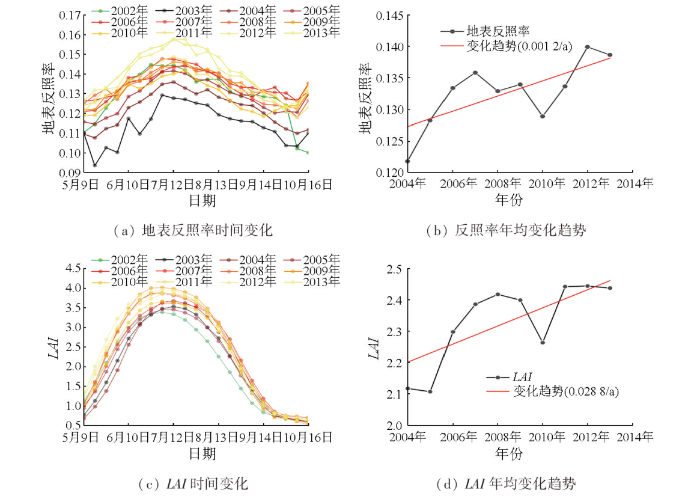
图4
2002—2013年火烧迹地非积雪覆盖期地表反照率和LAI变化
Fig.4
Land surface albedo and LAI changes of burned areas during non-snow covered period from 2002 to 2013
在反照率短期下降后,2004—2013年过火区域非积雪覆盖期的地表反照率整体呈现逐年升高的趋势(0.001 2/a (p < 0.05)),同期过火区域LAI呈现逐年升高趋势(0.028 8/a (p < 0.01))。并且可以发现一个明显的生长季结束物候期(end of season, EOS)延迟现象,生长季峰值LAI(约4.0)甚至超过了森林火灾发生之前(2002年LAI峰值3.4),这表明过火区域植被得到了恢复,但植被类型和建群树种与火灾之前存在显著差异,并且这种植被恢复过程与过火区域的地表反照率中长期升高趋势密切相关。如果考察积雪覆盖期火烧迹地地表反照率对森林火灾的响应变化,可以发现火灾发生后的当年冬季(2003—2004年冬季)的地表反照率即相比于火灾发生之前年份(2002—2003年冬季)显著升高,在中长期时间尺度(2004—2013年)积雪覆盖期过火区域地表反照率的年均值整体呈现升高趋势(0.003 3/a(p>0.05)),并且相比于非积雪覆盖期的升高趋势更高(图5)。这种积雪覆盖期的地表反照率显著升高的主要原因为植被的积雪掩模效应[26],当森林火灾发生后高大林木被烧毁,地表更多为低矮的草本、灌丛和幼林覆盖,改变了植被冠层结构复杂度[27],降低了植被的遮蔽和阴影效应,使得过火区域的积雪暴露面积和时间显著增加,从而显著增强了积雪覆盖期的地表反照率[28-29]。
图5
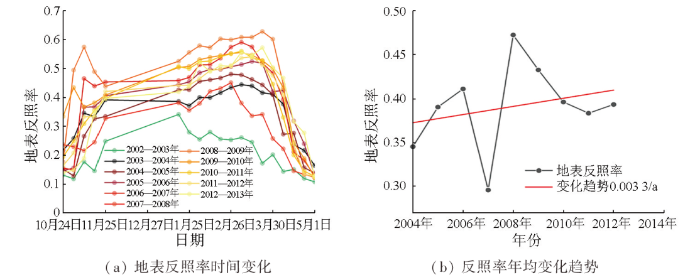
图5
2002—2013年火烧迹地积雪覆盖期地表反照率变化
Fig.5
Land surface albedo changes of burned area during snow-covered period from 2002 to 2013
3.2 火烧迹地和对照区地表反照率比较分析
为了准确评估森林火灾对过火区域地表反照率和LAI的影响,排除气候变化和人类活动等扰动因素,本研究进一步比较了火烧迹地和对照区地表反照率的变化差异。可以发现在森林火灾发生后,火烧迹地与对照区地表反照率变化呈现显著差异(图6),对照区2003—2013年地表反照率变化趋势较为微弱(非积雪覆盖期和积雪覆盖期地表反照率变化趋势分别为0.000 2/a和-0.001 2/a),而相比之下火烧迹地2003—2013年地表反照率呈现显著的升高趋势(非积雪覆盖期和积雪覆盖期地表反照率变化趋势分别为0.001 7/a和0.005 4/a)。森林火灾发生后,由于植被的积雪掩模效应2个区域在积雪覆盖期的地表反照率差异进一步拉大。这表明研究区域和时段内气候变化和人类活动的影响相对微弱,火烧迹地反照率快速变化主要是由森林火灾及之后的植被恢复过程导致的。
图6
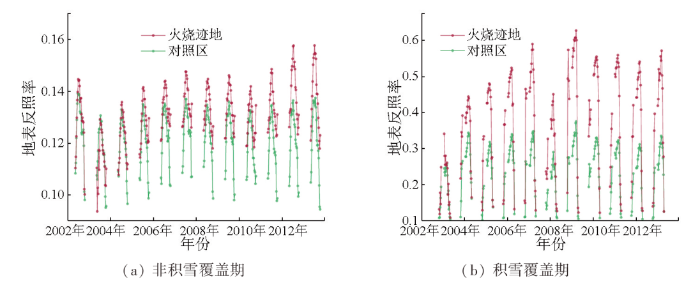
图6
2002—2013年火烧迹地与对照区地表反照率变化比较
Fig.6
Comparison of land surface albedo changes between burned area and control area from 2002 to 2013
此外,在地表反照率的季节性变化规律上,火烧迹地和对照区域都呈现相似的变化过程,在非积雪覆盖期地表反照率都呈现春季较低,随着LAI升高在夏季出现反照率峰值,然后秋季反照率再降低的现象。这种地表反照率随LAI升高而升高的变化趋势与农田和草地区域地表反照率随LAI升高而降低的趋势存在显著差异[28],这主要是由植被冠层结构复杂度差异导致的,林地冠层结构导致地表存在显著的反射各向异性,与均匀分布的农田和草地呈现显著差异,使得地表反照率随着LAI增加而增加[27]。尤其在积雪覆盖期,火烧迹地和对照区地表反照率变化与积雪覆盖情况关系更为密切,可以发现虽然反照率数值上存在显著差异,但是曲线的形状和变化时间点非常相似,这主要是由于2个区域距离较近,降雪和融雪过程基本同步。
3.3 地表反照率和LAI的相关关系分析
为了进一步论证森林火灾发生后火烧迹地反照率变化主要由LAI变化主导,本研究分析了2002—2013年火烧迹地在非积雪覆盖期地表反照率和LAI的相关关系。研究结果表明在非积雪覆盖期地表反照率与LAI的皮尔逊相关系数为0.682 (p<0.01),呈现显著的正相关关系(图7),这与植被冠层结构具有密切关系[30]。如果对非积雪覆盖期火烧迹地的地表反照率和LAI的相关关系进行逐年分析(表1),可以发现2002—2013年地表反照率和LAI的相关系数在0.733~0.944,且均呈现99%水平的置信(p<0.01),表明在不同时间尺度内上,植被LAI变化能够在很大程度上解释地表反照率的变化,植被恢复与生长过程是森林火灾发生后地表反照率响应变化的主导驱动因子。
图7
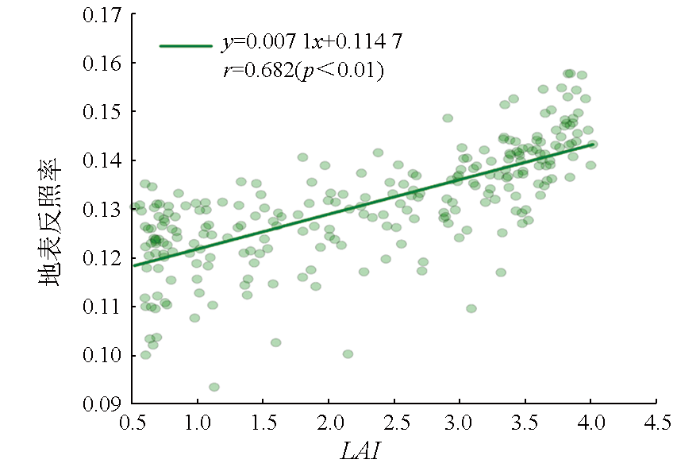
图7
2002—2013年非积雪覆盖期地表反照率和LAI的相关关系
Fig.7
Correlation between surface albedo and LAI during non-snow cover period from 2002 to 2013
表1 2002—2013年地表反照率与LAI的相关系数
Tab.1
| 年份 | 相关系数r | 年份 | 相关系数r |
|---|---|---|---|
| 2002年(火灾发生前) | 0.797**① | 2008年 | 0.916** |
| 2003年 | 0.733** | 2009年 | 0.853** |
| 2004年 | 0.923** | 2010年 | 0.781** |
| 2005年 | 0.772** | 2011年 | 0.883** |
| 2006年 | 0.816** | 2012年 | 0.865** |
| 2007年 | 0.805** | 2013年 | 0.944** |
①**代表相关分析结果为99%置信。
4 讨论
本研究发现大兴安岭地表反照率对森林火灾的短期和中长期响应变化存在相反的趋势,森林火灾发生后短期(1 a内)火烧迹地反照率显著降低,而在中长期(10 a)时间尺度呈现升高趋势。这种先降低再升高的变化趋势与Liu等[9]、Amiro等[10]、Lyons等[8]和Randerson等[31]在阿拉斯加和北美等北方森林火灾后的评价分析结果一致,而与非洲和澳大利亚草原火灾后地表反照率变化规律存在显著差异[5,11]。这种森林和草原火灾的响应规律的显著差异可以由植被冠层结构复杂度所解释。草原植被冠层结构复杂度较低,通常呈现随着LAI增加而反照率降低的变化规律; 而森林覆盖地表通常具有较高的结构复杂度,在树冠阴影投射等因素作用下会显著地降低地表反照率,从而呈现随着LAI增加而反照率升高的变化规律[27]。此外,观测的时间尺度、土壤背景反照率、残留覆盖物反射特性、土壤湿度和积雪覆盖等因素对森林和草原火灾的响应规律也具有不同程度的影响,相关机制有待通过新的地面和卫星观测数据深入探索分析。明确地表反照率在不同时空尺度对森林草原火灾的响应变化规律,对于准确量化火灾对全球气候变化作用具有重要的科学研究价值。
另外由于大兴安岭为季节性降雪区,季节性积雪覆盖对地表反照率变化具有重要作用,植被的积雪掩模效应进一步增强了中长期时间尺度地表反照率的升高趋势。研究进一步通过对照区比较分析证明了森林火灾发生后的地表反照率的响应变化与植被恢复过程密切相关,而受到同期气候变化和人类活动影响较小。森林火灾发生后的地表反照率变化与LAI变化密切相关,火烧迹地的地表反照率变化可以在很大程度上为森林火灾后的植被恢复与生长过程所解释。此外,本研究结果也表明了植被冠层结构复杂度、植被的积雪掩模效应、火灾强度和植被恢复速率等因素在地表反照率对森林火灾的响应变化中具有关键意义,并且其影响和作用随地理位置和植被类型显著变化,亟须在未来进行深入探索研究。
5 结论
本研究以2003年“5·5”大兴安岭金河林业局森林火灾为例,基于长时间序列GLASS地表反照率与LAI卫星遥感数据集分析了地表反照率对森林火灾的响应变化规律。主要结论如下:
1) 大兴安岭反照率对森林火灾在短期(1 a内)的响应变化为降低,而在中长期(10 a)呈现显著的升高趋势(0.001 2/a)。
2) 中长期时间尺度火烧迹地地表反照率的升高趋势与LAI升高密切相关(r = 0.682 (p < 0.01)),并且受同期气候变化和人类活动因素影响较小,与森林火灾及随后的植被恢复过程密切相关。
3) 植被的积雪掩模效应导致在积雪覆盖期地表反照率具有更为显著的升高趋势。研究结果对于探明地表反照率的时空变化规律具有重要价值,可以为森林火灾在全球气候变化中的影响和作用评价奠定基础。
参考文献
Review on estimation of land surface radiation and energy budgets from ground measurement,remote sensing and model simulations
[J].
Mapping surface broadband albedo from satellite observations:A review of literatures on algorithms and products
[J].
Greenland surface albedo changes in July 1981—2012 from satellite observations
[J].
Radiative forcing and albedo feedback from the Northern Hemisphere cryosphere between 1979 and 2008
[J].
Fire-induced albedo change and its radiative forcing at the surface in northern Australia
[J].
Editorial:The role of ash in fire-affected ecosystems
[J].
Burn severity and post-fire land surface albedo relationship in mediterranean forest ecosystems
[J].
Changes in surface albedo after fire in boreal forest ecosystems of interior Alaska assessed using MODIS satellite observations
[J].
Changes in the surface energy budget after fire in boreal ecosystems of interior Alaska:An annual perspective
[J].
The effect of post-fire stand age on the boreal forest energy balance
[J].
Impact of fires on surface albedo dynamics over the African continent
[J].
Surface albedo darkening from wildfires in northern sub-Saharan Africa
[J].
Characterizing the surface heterogeneity of fire effects using multi-temporal reflective wavelength data
[J].
基于遥感数据的根河市火烧迹地植被覆盖度时空分析
[J].
Spatio-temporal analysis of vegetation coverage based on remote sensing data in burned area of Genhe City
[J].
基于Landsat5 TM的祁连山区蒸散发遥感估算——以青海祁连县为例
[J].
Study of evapotranspiration in Qilian Mountains based on Landsat5 TM: A case of Qilian County Qinghai Province
[J].
基于Landsat5影像的青海省大通县土壤表层全氮空间格局反演
[J].
Spatial pattern inversion of soil surface total nitrogen in Datong County of Qinghai Province based on Landsat5 image
[J].
森林过火区植被遥感参数的变化与恢复特征分析
[J].
DOI:10.12082/dqxxkx.2018.170464
[本文引用: 1]

遥感技术可以快速、准确地监测森林火灾火烧迹地的植被遥感参数变化,分析植被对火灾的响应与恢复特征,为防灾减灾决策提供科学依据。本文首先基于森林火灾前后的Landsat5 TM数据,利用差分归一化燃烧指数(the Differential Normalized Burn Ratio,dNBR)来提取2009年澳大利亚维多利亚州火烧迹地的范围,计算过火区面积及火烧强度;其次基于时间序列的全球地表特征参量(Global Land Surface Satellite,GLASS)产品中的叶面积指数(Leaf Area Index,LAI)、吸收光合有效辐射比例(Fraction of Absorbed Photosynthetically Active Radiation,FAPAR)数据,利用距平分析法对比不同火烧强度过火区植被与未过火区植被受森林火灾的影响状况与植被恢复特征。结果表明,森林火灾发生后,LAI、FAPAR值迅速降低,火烧强度越大,LAI、FAPAR下降程度越大,高火烧强度过火区的LAI、FAPAR最大降幅分别为中火烧强度、低火烧强度过火区的1.2、1.3倍;随时间推移,LAI、FAPAR值逐渐上升,在2-3年内恢复至未过火区水平。LAI、FAPAR恢复至未过火区平均水平的时间与森林火灾规模、火烧强度密切相关:维多利亚州森林火灾过火区域中大过火斑块、高火烧强度林地的植被遥感参数恢复时间相比小过火斑块、低火烧强度林地滞后1-2年。植被遥感参数LAI、FAPAR能很好地反映过火区植被的受损状况及恢复过程。
Analysis on the characteristics of change and recovery of vegetation indices for forests in burned area
[J].
A long-term Global Land Surface Satellite (GLASS) data-set for environmental studies
[J].
The global land surface satellite (GLASS) product suite
[J].
Direct-estimation algorithm for mapping daily land-surface broadband albedo from MODIS data
[J].
Preliminary evaluation of the long-term GLASS albedo product
[J].
Development of the GLASS 250-m leaf area index product (version 6) from MODIS data using the bidirectional LSTM deep learning model
[J].
GLC_FCS30:Global land-cover product with fine classification system at 30 m using time-series Landsat imagery
[J].
DOI:10.5194/essd-13-2753-2021
[本文引用: 1]
Over past decades, a lot of global land-cover products have been released; however, these still lack a global land-cover map with a fine classification system and spatial resolution simultaneously. In this study, a novel global 30m land-cover classification with a fine classification system for the year 2015 (GLC_FCS30-2015) was produced by combining time series of Landsat imagery and high-quality training data from the GSPECLib (Global Spatial Temporal Spectra Library) on the Google Earth Engine computing platform. First, the global training data from the GSPECLib were developed by applying a series of rigorous filters to the CCI_LC (Climate Change Initiative Global Land Cover) land-cover and MCD43A4 NBAR products (MODIS Nadir Bidirectional Reflectance Distribution Function-Adjusted Reflectance). Secondly, a local adaptive random forest model was built for each 5 degrees x 5 degrees geographical tile by using the multi-temporal Landsat spectral and texture features and the corresponding training data, and the GLC_FCS30-2015 land-cover product containing 30 land-cover types was generated for each tile. Lastly, the GLC_FCS30-2015 was validated using three different validation systems (containing different land-cover details) using 44 043 validation samples. The validation results indicated that the GLC_FCS30-2015 achieved an overall accuracy of 82.5% and a kappa coefficient of 0.784 for the level-0 validation system (9 basic land-cover types), an overall accuracy of 71.4% and kappa coefficient of 0.686 for the UN-LCCS (United Nations Land Cover Classification System) level1 system (16 LCCS land-cover types), and an overall accuracy of 68.7% and kappa coefficient of 0.662 for the UN-LCCS level-2 system (24 fine land-cover types). The comparisons against other land-cover products (CCI_LC, MCD12Q1, FROM_GLC, and GlobeLand30) indicated that GLC_FCS30-2015 provides more spatial details than CCI_LC-2015 and MCD12Q1-2015 and a greater diversity of land-cover types than FROM_GLC-2015 and GlobeLand30-2010. They also showed that GLC_FCS30-2015 achieved the best overall accuracy of 82.5% against FROM_GLC-2015 of 59.1% and GlobeLand30-2010 of 75.9 %. Therefore, it is concluded that the GLC_FCS30-2015 product is the first global land-cover dataset that provides a fine classification system (containing 16 global LCCS land-cover types as well as 14 detailed and regional land-cover types) with high classification accuracy at 30 m. The GLC_FCS30-2015 global land-cover products produced in this paper are free access at https://doi.org/10.5281/zenodo.3986872 (Liu et al., 2020).
Forest fire effects on landscape snow albedo recovery and decay
[J].
Structural complexity biases vegetation greenness measures
[J/OL].
Land surface albedo variations in Sanjiang plain from 1982 to 2015:Assessing with GLASS data
[J].
Snow and land cover induced surface albedo changes in Northeast China during recent decades
[J].
Quantitative analysis of the links between forest structure and land surface albedo on a global scale
[J].
The impact of boreal forest fire on climate warming
[J].We report measurements and analysis of a boreal forest fire, integrating the effects of greenhouse gases, aerosols, black carbon deposition on snow and sea ice, and postfire changes in surface albedo. The net effect of all agents was to increase radiative forcing during the first year (34 +/- 31 Watts per square meter of burned area), but to decrease radiative forcing when averaged over an 80-year fire cycle (-2.3 +/- 2.2 Watts per square meter) because multidecadal increases in surface albedo had a larger impact than fire-emitted greenhouse gases. This result implies that future increases in boreal fire may not accelerate climate warming.
Quantifying surface albedo and other direct biogeophysical climate forcings of forestry activities
[J].
DOI:10.1111/gcb.12951
PMID:25914206
[本文引用: 1]
By altering fluxes of heat, momentum, and moisture exchanges between the land surface and atmosphere, forestry and other land-use activities affect climate. Although long recognized scientifically as being important, these so-called biogeophysical forcings are rarely included in climate policies for forestry and other land management projects due to the many challenges associated with their quantification. Here, we review the scientific literature in the fields of atmospheric science and terrestrial ecology in light of three main objectives: (i) to elucidate the challenges associated with quantifying biogeophysical climate forcings connected to land use and land management, with a focus on the forestry sector; (ii) to identify and describe scientific approaches and/or metrics facilitating the quantification and interpretation of direct biogeophysical climate forcings; and (iii) to identify and recommend research priorities that can help overcome the challenges of their attribution to specific land-use activities, bridging the knowledge gap between the climate modeling, forest ecology, and resource management communities. We find that ignoring surface biogeophysics may mislead climate mitigation policies, yet existing metrics are unlikely to be sufficient. Successful metrics ought to (i) include both radiative and nonradiative climate forcings; (ii) reconcile disparities between biogeophysical and biogeochemical forcings, and (iii) acknowledge trade-offs between global and local climate benefits. We call for more coordinated research among terrestrial ecologists, resource managers, and coupled climate modelers to harmonize datasets, refine analytical techniques, and corroborate and validate metrics that are more amenable to analyses at the scale of an individual site or region. © 2015 John Wiley & Sons Ltd.
