

0 引言
广西壮族自治区是我国柑橘种植第一大省,2018年柑橘产值突破1 000亿元,产值仅次于甘蔗产业,成为全区第二个破千亿产业[1],产量连续8 a位居榜首[2],柑橘产业在巩固脱贫攻坚成果、助力乡村振兴中发挥巨大作用。然而,在广西柑橘产业快速发展期,柑橘黄龙病却是阻碍产业发展的噩梦,因其蔓延性极快,且目前尚无有效治疗药剂和抗病品种[3],被称之为柑橘“癌症”[4]。全球50多个柑橘生产国遭受黄龙病迫害,我国柑橘主产区(广西、广东、江西、福建、湖南等地)遭受严重危害[5-6]。20世纪70年代以来,广西因柑橘黄龙病被毁灭的果园面积超过6.7万hm2,累积经济损失100亿元以上,据不完全统计,2018年广西已有71个市县区感染柑橘黄龙病,每年柑橘产量损失超过50万t,每年经济损失超过10亿元。为加强黄龙病防控,广西出台了国内首部柑橘黄龙病防控地方法规《广西壮族自治区柑橘黄龙病防控规定》(以下简称《防控规定》),于2019年11月1日起实施,《防控规定》指出种植无病种苗、防治柑橘木虱、清除病株是防控黄龙病的“三把斧”,为此准确高效监测柑橘黄龙病地块对病情防控至关重要。
柑橘黄龙病病理十分复杂,发病早期叶片呈现均匀浅黄绿色,枝梢症状存留时间较短,发病中晚期出现斑驳型黄化叶片,黄梢数量增多并伴随缺乏微量元素锌、锰、铁等现象,导致柑橘黄龙病监测十分困难。传统发现柑橘黄龙病主要依靠田间诊断和生物检测,田间诊断在每年10月至翌年2月通过观察柑橘叶片和果实判断受灾情况,需要丰富的经验知识; 生物检测主要通过聚合酶链反应 (polymerase chain reaction,PCR)快速检测黄龙病,实验检测方式多样,准确度高,但过程复杂,周期长,费用高。随着高新设备和信息技术发展,诸多学者通过室内高光谱成像、无人机高光谱遥感、图像识别等技术,实现柑橘黄龙病无损监测。佛罗里达大学的Li等[7]是最早开展无人机遥感柑橘黄龙病的研究团队之一,2012年利用地面高光谱仪建立光谱库,对无人机高光谱图像进行波谱匹配识别分类,但由于获取高光谱的拍摄条件和采集设备的差异,该方法识别准确率不高; 梅慧兰等[8]研究了基于实验室高光谱成像的柑橘黄龙病早期无损检测及病情分级技术,利用SG 平滑与一阶微分预处理形成的分类模型准确率达96.4%; Weng 等[9]提出了高光谱成像技术协同碳水化合物代谢的检测方法,分季节识别柑橘黄龙病,凉爽、炎热和整个周期识别准确率分别为90.2%,96.0%和92.6%; 兰玉彬等[10]利用无人机高光谱遥感技术监测柑橘黄龙病植株,基于全波段一阶导数光谱信息,利用支持向量机(support vector machine,SVM)分类模型识别黄龙病植株的精度为94.7%; 黄梓效[11]基于无人机多光谱图像特征,对比SVM,K最邻近(K-nearest neighbour,KNN)、逻辑回归、AdaBoost和神经网络等模型识别黄龙病的敏感性,其中AdaBoost和神经网络鲁棒性较好; Xu等[12]综合利用激光诱导击穿光谱和近红外光谱数据鉴别柑橘黄龙病,准确率达95.7%; 何城城[13]以动态叶绿素荧光图像、多光谱荧光图像和多光谱反射图像,构建柑橘黄龙病快速识别模型,准确率分别为73.78%,85.06%和91.46%; 范世达等[14]基于柑橘植株图像信息,利用深度学习方法构建柑橘黄龙病识别模型,实现黄龙病田间远程诊断,准确率为77.1%。可见地面实测与光谱信息结合是识别柑橘黄龙病的有效方法,但现有研究主要以柑橘叶片或柑橘单木冠层为对象开展黄龙病诊断方法探索,形成的技术更适用于小面积橘园黄龙病鉴别,难以实现大范围黄龙病监测,而当前关于柑橘黄龙病地块识别研究鲜有报道。
本文以广西壮族自治区蒙山县为试验区,通过卫星遥感与地面实测协同开展大范围地块尺度柑橘黄龙病监测研究,按季度地面采集健康、黄化(缺素)、黄龙病柑橘叶片样本,完成PCR、叶绿素、高光谱检测,分析不同状态柑橘样本特征变化规律,提取监测黄龙病有效波段和影像特征; 构建健康柑橘监测模型缩减待判别对象,形成柑橘生长异常地块,基于多时序Sentinel-2影像有效特征,集成多分类器算法提取柑橘黄龙病地块,以期为柑橘黄龙病大范围监测防控提供新思路。
1 研究区概况与数据源
1.1 研究区概况
蒙山县隶属广西梧州市,面积1 281 km2,110°19'~110°45'E,23°52'~24°23'N,北接荔浦,南毗平南、藤县,东邻昭平,西连金秀,四周群山环抱,境内丘陵起伏,地势东北高,西南低,湄江纵贯其中,国道321线穿越南北6个乡镇,县境内森林覆盖率达82.87%,有“天然氧吧”美名,是国家级生态示范区和国家重点生态功能区。蒙山县属亚热带季风气候,气候温和,雨量充沛,光照充足,年均气温为19.7 ℃,极端最高和最低气温分别为38.5 ℃和-4.5 ℃,年均降雨量为1 738.7 mm,年均日照总量为1 581 h。雨热同季的气候为蒙山县农业发展提供优越条件,该县主要粮食与经济作物有水稻、玉米、柑橘、蚕桑、蔬菜、木薯等。
1.2 数据与处理
文章数据包括蒙山县乡镇行政边界、柑橘种植地块数据、Sentinel-2影像数据、柑橘地面实测数据。通过遥感手段获取柑橘种植地块数据,获取具体方法见笔者早前研究成果[15]。Sentinel-2影像包括2021年10月、11月、12月以及2022年1月和2月时相数据,该数据来自欧空局官方网站(
2 研究方法
文章采用卫星遥感技术与地面实测协同方法开展柑橘黄龙病地块监测,技术路线如图1所示,包括监测黄龙病有效波段提取、多时相影像特征计算与筛选、柑橘生长异常地块提取和集多分类器的柑橘黄龙病地块监测4个部分。
图1
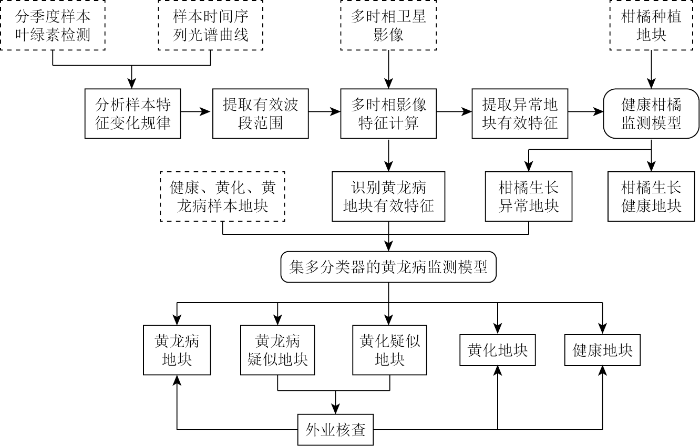
图1
柑橘黄龙病地块监测技术路线
Fig.1
Monitoring technical route of citrus Huanglongbing plot
1)监测黄龙病有效波段提取。基于3月、6月、9月和12月叶片样本叶绿素检测值和高光谱曲线,分别计算健康、黄化和黄龙病植株冠层叶绿素和光谱反射率的平均值,根据叶绿素统计值分析3种状态柑橘植株叶片特征变化规律,筛选监测黄龙病最佳时段,按季度比对3种状态柑橘植株光谱反射率差异,提取监测黄龙病有效波段范围,为挑选影像特征提供依据。
2)多时相影像特征计算与筛选。柑橘感染黄龙病后引发根部腐烂问题,导致养分无法正常吸收运输、代谢废物无法排出,出现叶片和果实缺乏养分和水分的现象,叶片的叶绿素、水分、氮元素等发生明显改变,为此筛选出可反映以上养分的遥感影像特征尤为关键。为此,根据监测黄龙病有效波段范围,结合Sentinel-2影像波谱信息,以及参考现有研究者的试验结果[16
表1 影像多特征指数详情
Tab.1
| 指数 | 简称 | 全称 | 计算方法 | 描述 | 类型 | 参考文献 |
|---|---|---|---|---|---|---|
| 归一化植被指数 | NDVI | normalized difference vegetation index | (B8-B4)/(B8+B4) | 常用于反映植被长势、健康情况等,覆盖度较低时受裸露土壤干扰 | 传统指数 | [16] |
| 地表水分指数 | LSWI | land surface water index | (B8-B11)/(B8+B11) | 用于监测植被冠层水分含量 | 传统指数 | [17] |
| 改进归一化差异水体指数 | MNDWI | modified normalized difference water index | (B3-B11) /(B3+B11) | 提取水体敏感,有效降低城镇、植被噪音影响 | 传统指数 | [18] |
| 归一化差异水体指数 | NDWI | normalized difference water index | (B3-B8) /(B3+B8) | 最大程度抑制植被的信息,有效突出水体信息 | 传统指数 | [18] |
| 氮反射指数 | NRI | nitrogen reflectance index | (B3-B4) /(B3+B4) | 与叶片氮素含量显著相关,能够反演叶片氮含量的变化情况 | 传统指数 | [19] |
| 绿度归一化植被指数 | GNDVI | green normalized difference vegetative index | (B5-B2) /(B5+B2) | 评估光合活性,用于确定植物冠层吸收水氮常用植被指数 | 红边指数 | [20] |
| 倒红边叶绿素指数 | IRECI | inverted red-edge chlorophyll index | (B7-B4)/(B5/B6) | 与叶绿素含量和叶面积指数相关性好,用于表征叶绿素含量 | 红边指数 | [21] |
| 叶绿素吸收指数 | MCARI2 | modified chlorophyll absorption ratio index 2 | [(B5-B4)-0.2(B5-B3)](B6/B5) | 对植被叶绿素含量敏感,值越高表明叶绿素含量越高 | 红边指数 | [22] |
| 归一化红边指数 | NDI45 | normalized difference index | (B5-B4) /(B5+B4) | 比NDVI线性更强,对监测植被茂盛区有优势 | 红边指数 | [23] |
| 归一化差值红边指数 | NDRE1 | normalized difference red-edge 1 | (B6-B5) /(B6+B5) | 用红边代替NDVI的红边和近红外波段,用于反演植被叶面积指数和叶绿素含量 | 红边指数 | [24] |
| 归一化多波段干旱指 | NMDI | normalized multi -band drought index | [B8A-(B11-B12)]/[B8A+(B11-B12)] | 适用于对土壤与植被水分含量的监测 | 红边指数 | [25] |
| 特征色素简单比值指数 | PSSRa | pigment specific simple ratio(chlorophyll) index | B7/B4 | 用于量化植被冠层色素含量 | 红边指数 | [26] |
3)柑橘生长异常地块提取。鉴于黄化柑橘和黄龙病柑橘特征及症状的相似性,将2类样本归类为生长异常样本,利用筛选的有效时段和影像特征,构建健康柑橘监测模型,该模型采用并集,即满足任何一个条件划分柑橘生长健康地块,在建模过程中阈值取值遵循偏大原则,尽可能减少生长异常地块被划分为生长健康地块,没有被认定为生长健康的地块即为柑橘生长异常地块。
4)基于多分类器的柑橘黄龙病地块识别。以生长异常地块为对象,基于多时序传统特征指数和红边特征指数,集成贝叶斯、KNN、决策树、随机森林和SVM分类器,构建柑橘黄龙病地块监测模型,完成样本训练(包括健康、黄化、黄龙病样本)与地块分类。相同地块被4种以上分类器同时判断为黄龙病,则划分为黄龙病地块; 4种以上分类器同时判断为黄化则划分为黄化地块; 3种分类器同时判断为黄龙病或黄化的地块划分为疑似地块,需进一步开展外业核查; 其余地块归类为健康地块。黄龙病识别过程中,以地块为单元计算影像特征的平均值,若柑橘地块黄龙病发病率超过50%,模型判断为黄龙病地块的准确率较高,而当发病率较低且受灾植株分散时,可能出现黄龙病影像特征被非黄龙病影像特征干扰,引起错误分类的现象,为此,对疑似地块的外业核查十分重要。核查过程发现有黄龙病受灾植株即认定为黄龙病地块。2种或1种分类器判断为黄龙病地块中,不排除存在黄龙病地块,但发病率较低无法准确识别,经抽样调查发现地块发病率在26%以下,因涉及数量较多且零散,对其不做外业详查,纳入健康地块。
3 结果与分析
3.1 叶绿素与光谱曲线
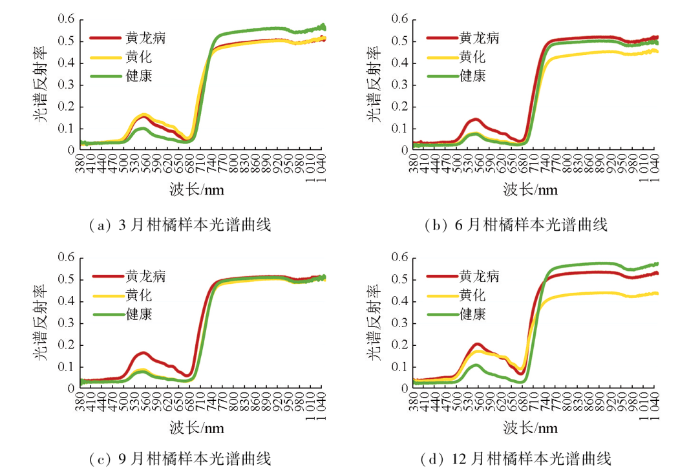
3月、6月、9月和12月叶片样本叶绿素检测值和高光谱曲线分别见图2、图3。图2显示除6月以外健康柑橘叶绿素值与黄化及黄龙病柑橘叶绿素值差异较大,黄化与黄龙病柑橘各月份的叶绿素值十分接近,3月、12月黄龙病柑橘叶绿素值高于黄化柑橘,而6月、9月相反。3月柑橘样本光谱曲线图反映出黄龙病和黄化柑橘冠层反射率极为相近,波长530~650,740~1 040 nm有利于剔除健康柑橘地块; 6月柑橘样本光谱曲线图显示波长380~740 nm健康柑橘和黄化柑橘的光谱反射率相近,波长740~1 040 nm黄化柑橘和黄龙病柑橘的光谱反射率相近,不利于地块分类; 9月柑橘样本光谱曲线图表明波长530~650 nm有利于提取黄龙病地块,波长680~1 040 nm这3种状态的柑橘反射率难以区分; 12月柑橘样本光谱曲线呈现健康柑橘与生长异常柑橘(包括黄龙病、黄化)光谱反射率差异明显,波长740~1 040 nm有利于3种状态柑橘分类。综上,波长530~650,740~1 040 nm为监测黄龙病地块的有效波长范围,结合广西气候条件,选取2021年10月、11月、12月以及2022年1月和2月为提取黄龙病地块的有效时相,选取12月影像剔除柑橘生长健康地块。
图2
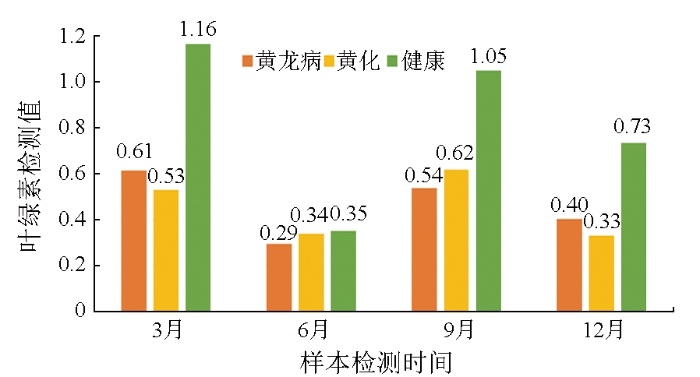
图2
柑橘叶片样本叶绿素检测统计图
Fig.2
Statistical diagram of chlorophyll detection in citrus leaf samples
图3
3.2 多时相影像特征曲线
监测黄龙病地块的有效波长范围为530~650 nm和740~1 040 nm,Sentinel-2影像覆盖13个光谱,波段范围为443~2 190 nm,空间分辨率为10 m,重访周期短,用于提取黄龙病具有优势。对照有效波长范围,基于Sentinel-2影像计算12种影像特征,统计多特征指数的最大值、最小值和平均值,建立时间序列均值曲线图(图4),统计时间为2021年10月—2022年2月。图4显示传统特征指数NDVI,LSWI,MNDWI,NDWI,NRI和红边特征指数GNDVI,IRECI,NDRE1,NMDI有利于剔除健康柑橘地块,以上特征中健康柑橘均值曲线与黄化柑橘、黄龙病柑橘特征曲线整体上分离程度明显,鉴于LSWI,NDWI和NMDI这3种特征用于监测水分含量,为减少特征指数的重复性,选用分离性最显著的LSWI指标。同理,IRECI和NDRE1用于表征叶绿素含量的指数,故选用差异性突出的IRECI指标。综上,采用12月时相的NDVI,LSWI,NRI,GNDVI和IRECI为5种特征指数构建健康柑橘监测模型。健康柑橘样本NDVI最大值、最小值、均值分别为0.82,0.62和0.72,黄化柑橘样本NDVI最大值、最小值、均值分别为0.69,0.44和0.58,黄龙病柑橘样本NDVI最大值、最小值、均值分别为0.69,0.33和0.59,遵循特征指数取值偏大原则,故NDVI取值为≥0.75。同理,LSWI,NRI,GNDVI和IRECI取值分别为≥0.26,≥0.15,≥0.58和≥0.54,构建的健康柑橘监测模型见公式(1),即满足模型中任意条件划分为柑橘生长健康地块,否则归类为柑橘生长异常地块,具体公式为:
图4
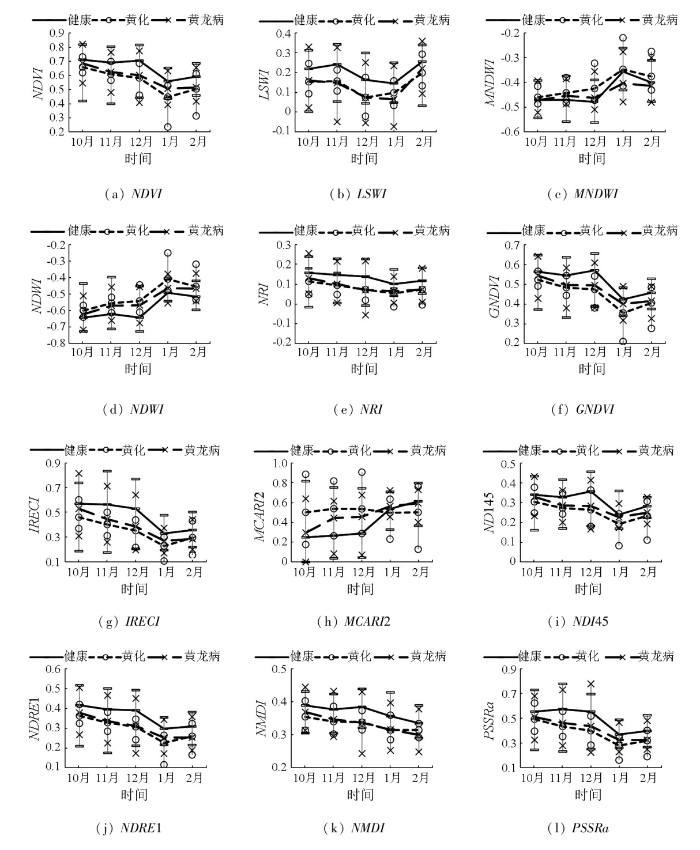
从12种特征指数的时间序列均值曲线图可知,黄化柑橘、黄龙病柑橘在影像上反映特征十分相似,黄化柑橘地块对提取黄龙病地块造成极大干扰,因黄化及黄龙病样本的LSWI,NRI,NDRE1和NMDI均值曲线差异甚小,不适用于提取黄龙病地块,故采用传统特征指数NDVI,MNDWI,NDWI和红边特征指数GNDVI,IRECI,MCARI2,NDI45,PSSRa监测黄龙病地块。
3.3 柑橘黄龙病监测结果分析
以生长异常地块为对象,基于传统特征指数NDVI,MNDWI,NDWI和红边特征指数GNDVI,IRECI,MCARI2,NDI45和PSSRa,集成多种分类器提取黄龙病地块,其中3种分类器判别为黄龙病疑似地块和黄化疑似地块数量分别为283,166个,经过田间外业核查发现283个地块中黄龙病、黄化和健康柑橘数量分别为245,29和9个,166个地块中黄龙病、黄化和健康柑橘数量分别为13,137和16个,黄龙病地块识别准确率为86.6%、漏检率为7.8%、错误率为10.4%,黄化地块识别准确率为82.5%、漏检率为10.2%、错误率为17.5%。出现错误及漏检的主要原因在于一方面黄化和黄龙病柑橘特征极为相似,重度黄龙病与黄化柑橘区分难度极大; 另一方面新种植柑橘影像特征值变化较大,对识别黄龙病干扰性明显。
星地协同下地块尺度柑橘黄龙病监测结果如图5所示,各乡镇统计情况见表2。蒙山县柑橘种植面积10 912.21 hm2,共49 268个地块,主要分布在文圩镇、西河镇、新圩镇、黄村镇、蒙山镇等,其中黄龙病地块964个,面积220.13 hm2,大面积黄龙病发病率为2.02%,主要集中在新圩镇、文圩镇、蒙山镇、夏宜瑶族乡等。新圩镇柑橘黄龙病地块360个,面积90.43 hm2,占全县黄龙病面积的40.08%,主要分布在该镇中部和南部,集中在谢村、四联村、坝头村等村; 文圩镇柑橘黄龙病地块235个,面积55.03 hm2,占全县黄龙病面积的25.00%,发病地块较分散,主要位于六夏村、桃洞村、文圩村、道义村等村; 蒙山镇黄龙病地块164个,面积28.05 hm2,占全县黄龙病面积的12.74%,主要分布在该镇的东北部,其中文平村、甘棠村、北楼村、城西村等村发病率较高。
图5
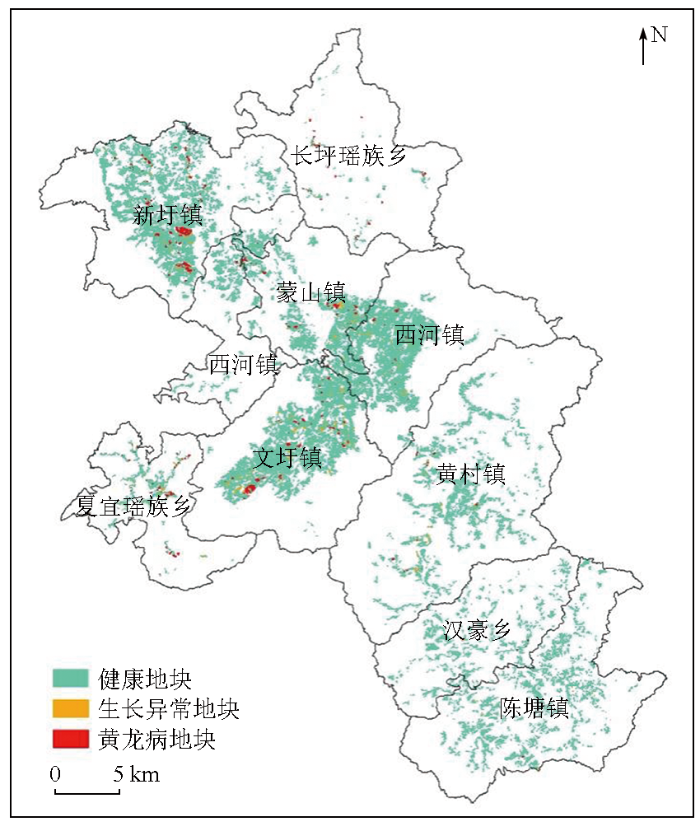
表2 蒙山县柑橘黄龙病监测统计表
Tab.2
| 乡镇名称 | 面积/hm2 | 地块数量/个 | ||||||
|---|---|---|---|---|---|---|---|---|
| 健康 | 黄龙病 | 生长异常 | 合计 | 健康 | 黄龙病 | 生长异常 | 合计 | |
| 蒙山镇 | 1 064.90 | 28.05 | 18.99 | 1 111.94 | 5 544 | 164 | 86 | 5 794 |
| 西河镇 | 2 277.30 | 10.67 | 8.42 | 2 296.39 | 10 531 | 46 | 36 | 10 613 |
| 新圩镇 | 2 114.12 | 90.43 | 15.78 | 2 220.33 | 9 422 | 360 | 84 | 9 866 |
| 文圩镇 | 2 251.72 | 55.03 | 41.02 | 2 347.77 | 10 750 | 235 | 217 | 11 202 |
| 黄村镇 | 1 103.29 | 7.54 | 7.33 | 1 118.16 | 4 345 | 40 | 38 | 4 423 |
| 陈塘镇 | 942.24 | 1.04 | 0.78 | 944.06 | 4 073 | 7 | 6 | 4 086 |
| 汉豪乡 | 535.23 | 3.17 | 0.67 | 539.07 | 1 847 | 11 | 8 | 1 866 |
| 长坪瑶族乡 | 70.22 | 10.04 | 0.82 | 81.08 | 246 | 35 | 4 | 285 |
| 夏宜瑶族乡 | 232.23 | 14.16 | 7.02 | 253.41 | 1 037 | 66 | 30 | 1 133 |
| 合计 | 10 591.25 | 220.13 | 100.83 | 10 912.21 | 47 795 | 964 | 509 | 49 268 |
4 结论与讨论
4.1 结论
1)检测结果显示除6月以外健康柑橘叶绿素值与黄化及黄龙病柑橘叶绿素值差异较大,而黄龙病与黄化叶片4个月份的叶绿素值十分相近,3月、12月黄龙病柑橘叶绿素值高于黄化柑橘,而6月、9月相反。12月是识别黄龙病、黄化的重要时期,其中波长530~650,740~1 050 nm是诊断黄龙病、黄化有效波谱范围。
2)Sentinel-2影像12月时相特征指数NDVI,LSWI,NRI,GNDVI和IREC能够有效区分柑橘生长健康和生长异常地块,健康柑橘监测模型中5种影像特征取值分别为≥0.75,≥0.26,≥0.15,≥0.58和≥0.54。10—12月及翌年1—2月时序影像特征指数NDVI,MNDWI,NDWI,GNDVI,IRECI,MCARI2,NDI45和PSSRa监测黄龙病具有优势。
3)蒙山县黄龙病地块识别准确率为86.6%、漏检率为7.8%、错误率为10.4%,2021年柑橘黄龙病地块964个,面积220.13 hm2,大面积黄龙病发病率为2.02%,主要集中在新圩镇、文圩镇、蒙山镇、夏宜瑶族乡等乡镇。建议有关部门及早挖除病树,加强柑橘木虱防治,防止病情扩散,减少农户经济损失。
4.2 讨论
1)柑橘黄龙病发病变化过程复杂,早期出现少量黄梢,叶片为均匀的浅黄绿色,中晚期出现明显的斑驳型黄化叶片,黄梢数量增多,通常伴随缺乏锌、锰、铁等微量元素,黄龙病植株叶片的症状与缺乏微量元素叶片黄化以及根部被水淹泡引起叶片发黄等现象尤为相似,导致柑橘黄龙病监测十分困难。传统田间调查及实验室检测无法实现大范围黄龙病监测,文章提出面向柑橘地块,通过卫星遥感与地面实测协同的方法提取黄龙病地块,为开展柑橘黄龙病监测防控提供新技术。但文章形成的技术方法仍存在不足,一方面,受黄龙病与黄化柑橘特征相似影响,黄龙病地块监测精度难以大幅度提升; 另一方面,监测对象为地块而非柑橘植株,可准确监测受灾面积较大且植株分布集中的柑橘地块,若柑橘地块面积较大,发病植株少且分散时,受混合像元影响,容易判别为健康地块。为此,该文监测黄龙病面积占柑橘面积的比例,实际为大面积黄龙病发病率,而非全县黄龙病发病率。虽然文章识别黄龙病地块的精度远不如梅慧兰等[8]、Weng等[9]、兰玉彬等[10]等识别柑橘黄龙病植株的精度,但对于大区域黄龙病地块监测防控更具实用性。
2)该文选用了贝叶斯、KNN、决策树、随机森林和SVM分类器,构建柑橘黄龙病地块监测模型,通过5种分类器投票方式实现地块分类,有效提高分类结果的客观性,但5种分类器识别黄龙病准确性不一致,有可能出有错判及漏判,为此下一步应在文章使用的分类器基础上,增加其他分类器,采用相同的数据及样本,分别测试不同分类器对黄龙病识别的鲁棒性,筛选精度较高的分类器构建监测模型,以提高提取结果的可靠性。
参考文献
基于中高分影像的丘陵区柑橘种植地块提取
[J].
Extraction of citrus planting plots based on medium-high different images
[J].
回顾广西柑橘黄龙病防控(1982-2020)
[J].
A review of citrus Huanglongbing control in Guangxi from 1982 to 2020
[J].
田间柑橘植株不同部位黄龙病菌的PCR检测及发病原因分析
[J].
PCR detection of huanglongbing pathogen in different parts of citrus plants in the field and analysis of the cause of the disease
[J].
叶绿素荧光成像技术下的柑橘黄龙病快速诊断
[J].
Rapid detection of citrus Huanglongbing based on chlorophyll fluorescence imaging technology
[J].
柑橘黄龙病病原分化及发生规律研究进展
[J].
The research progress of Citrus huanglongbing on pathogen diversity and epidemiology
[J].
柑橘黄龙病老龄果园发病力与时序发生规律研究
[J].
DOI:10.11923/j.issn.2095-4050.cjas16120026
[本文引用: 1]

为揭示柑橘黄龙病自然感染年序病情发生规律,以提高监测预警防控水平提供科学依据,笔者于2002—2015 年在天然隔离屏障良好的一个老龄果园开展柑橘黄龙病自然感染发病危害研究,在初入侵果园采取3 个重复样地定点定株发病扩散危害系统调查。坚持14 年试验结果表明:柑橘黄龙病自然感染发病力以自然感染发病4~5 年后为最强盛,其发病力可达年新发病率10%~15%,较其初发病力增强2~3 倍;其当年新发病率消长呈“M型”曲线变化规律:第1 自然感染发病显症高峰一般为初次入侵后的第5 年前后,峰期一般为2~3 年;第2 个自然感染发病显症高峰为初次入侵后的第9 年前后,峰期一般为1~3 年,两峰之间为高位波动变化动态。老龄果园黄龙病积年发病呈Logistic 曲线上行变化轨迹,其年序数值化变化模型为Q = 85.81441 EXP( 4.0063-0.5837N )(n=14,r=0.9941**),其自然感染扩散大周期为15年(其中核心为害周期10 年左右)。运用这些变化规律,对提升老龄果园黄龙病监测预警防控具有十分重要的指导意义。
Citrus liberobacter asiaticum morbidity and timing patterns in old orchards
[J].
DOI:10.11923/j.issn.2095-4050.cjas16120026
[本文引用: 1]
To reveal natural occurrence of citrus liberobacter asiaticum and provide a scientific basis for monitoring, preventing and controlling the disease, a study was made from 2002 to 2015 on natural infection morbidity in a citrus orchard with good natural isolation barrier by taking three sample plots to find out the onset and diffusion of the disease. The fourteen-year study showed that citrus liberobacter asiaticum morbidity was the most powerful four or five years after the natural infection, and reached 10% to 15% yearly, which increased by two to three times compared with its early incidence force. Its varying curve of occurrence acted as an“M”. The first peak symptomatic appearance of natural infection was around the 5th year after the first incidence and the second happened 9 years later or so. Generally, the peak period lasted 1 to 3 years and the change between the two peaks fluctuated with high volatility. The occurrence regularity of citrus liberobacter asiaticum morbidity showed an upward trajectory in Logistic curve and its chronological value change model was: Q = 85.8144 1 EXP(4.0063-0.5837N ) (n=14,r=0.9941**), and its big cycle of natural infection spreading was 15 years (including core harm period of 10 years or so). This change patterns could be of guiding significance to monitoring, preventing and controlling citrus liberobacter asiaticum in old orchards.
Spectral difference analysis and airborne imaging classification for citrus greening infected trees
[J].
柑橘黄龙病高光谱早期鉴别及病情分级
[J].
Early detection and grading of citrus huanglongbing using hyperspectral imaging technique
[J].
Hyperspectral reflectance imaging combined with carbohydrate metabolism analysis for diagnosis of citrus Huanglongbing in different seasons and cultivars
[J].
基于无人机高光谱遥感的柑橘黄龙病植株的监测与分类
[J].
Monitoring and classification of citrus Huanglongbing based on UAV hyperspectral remote sensing
[J].
Comparative identification of citrus huanglongbing by analyzing leaves using laser-induced breakdown spectroscopy and near-infrared spectroscopy
[J].
基于深度学习的柑橘黄龙病远程诊断技术初探
[J].
Preliminary study on remote diagnosis technology of Citrus Huanglongbing based on deep learning
[J].
一种融合指数与主成分分量的随机森林遥感图像分类方法
[J].
A random forest-based method integrating indices and principal components for classifying remote sensing images
[J].
Derivation of leaf-area index from quality of light on the forest floor
[J].
利用改进的归一化差异水体指数(MNDWI)提取水体信息的研究
[J].
A study on information extraction of water body with the modified normalized difference water index (MNDWI)
[J].
Red and photographic infrared linear combinations for monitoring vegetation
[J].
近地高光谱和低空航拍数字图像遥感监测小麦条锈病的比较研究
[J].
DOI:10.13926/j.cnki.apps.000170
[本文引用: 1]
分别利用近地高光谱和低空航拍数字图像同时对田间小麦条锈病的发生情况进行监测,结果表明近地高光谱遥感参数DVI、NDVI、GNDVI和低空航拍数字图像颜色特征值R、G、B与病情指数存在极显著相关性,整体上,所选近地高光谱参数与病情指数的相关性要优于低空航拍数字图像参数与病情指数的相关性,而且近地高光谱参数DVI、NDVI、GNDVI与低空航拍数字图像参数R、G、B之间均存在极显著负相关关系。分别建立了基于近地高光谱参数GNDVI和低空航拍数字图像参数R的田间小麦条锈病病情估计模型,模型均达到较好的拟合效果,其中近地高光谱参数GNDVI对小麦条锈病的监测效果好于低空航拍数字图像参数R,而低空航拍数字图像具有可以进行大面积快速监测的优势,因此在实际应用中可以根据需要选择其中一种方法或参数来估计田间小麦条锈病的发生和流行程度。
Comparisons of detection of wheat stripe rust using hyper-spectrometer and UAV aerial photography
[J].
DOI:10.13926/j.cnki.apps.000170
[本文引用: 1]
Wheat stripe rust were monitored using hyper-spectrometer and UAV aerial photography in the field, respectively. The relationships among disease index and hyperspectral canopy reflectance parameters or UAV digital image parameters were analyzed. The results showed that there were significantly correlations between disease index and the hyperspectral parameters (DVI, NDVI, GNDVI) or UAV digital image color feature parameters (R, G, B). In general, the correlations between hyperspectral parameters and disease index were higher than those between UAV digital image parameters and the disease index. Furthermore, hyperspectral parameters DVI, NDVI, GNDVI were negatively and significantly correlated with UAV digital image parameters R, G, B. We constructed the estimation models of wheat stripe rust based on hyperspectral parameter GNDVI and UAV digital image parameter R, respectively, both the models fitted well, and the model based on GNDVI performed better than the model based on R, however, UAV digital images have the advantages of undertaking fast detection in large area, so in practice, we can choose one methods or one of the parameters to estimate the occurrence and epidemic of wheat stripe rust in the field as needed.
Utilisation de la haute resolution spectrale pour suivre L'etat des couverts vegetaux
[C]//
Estimating chlorophyll content from hyperspectral vegetation indices:Modeling and validation
[J].
Evaluation of Sentinel-2 red-edge bands for empirical estimation of green LAI and chlorophyll content
[J].
DOI:10.3390/s110707063
PMID:22164004
[本文引用: 1]
ESA's upcoming satellite Sentinel-2 will provide Earth images of high spatial, spectral and temporal resolution and aims to ensure continuity for Landsat and SPOT observations. In comparison to the latter sensors, Sentinel-2 incorporates three new spectral bands in the red-edge region, which are centered at 705, 740 and 783 nm. This study addresses the importance of these new bands for the retrieval and monitoring of two important biophysical parameters: green leaf area index (LAI) and chlorophyll content (Ch). With data from several ESA field campaigns over agricultural sites (SPARC, AgriSAR, CEFLES2) we have evaluated the efficacy of two empirical methods that specifically make use of the new Sentinel-2 bands. First, it was shown that LAI can be derived from a generic normalized difference index (NDI) using hyperspectral data, with 674 nm with 712 nm as best performing bands. These bands are positioned closely to the Sentinel-2 B4 (665 nm) and the new red-edge B5 (705 nm) band. The method has been applied to simulated Sentinel-2 data. The resulting green LAI map was validated against field data of various crop types, thereby spanning a LAI between 0 and 6, and yielded a RMSE of 0.6. Second, the recently developed "Normalized Area Over reflectance Curve" (NAOC), an index that derives Ch from hyperspectral data, was studied on its compatibility with simulated Sentinel-2 data. This index integrates the reflectance curve between 643 and 795 nm, thereby including the new Sentinel-2 bands in the red-edge region. We found that these new bands significantly improve the accuracy of Ch estimation. Both methods emphasize the importance of red-edge bands for operational estimation of biophysical parameters from Sentinel-2.
Spectral reflectance changes associated with autumn senescence of Aesculus hippocastanum L.and Acer platanoides L.leaves.spectral features and relation to chlorophyll estimation
[J].
归一化多波段干旱指数在农田干旱监测中的应用
[J].
Application of normalized multiband drought index method in cropland drought monitoring
[J].
Quantifying chlorophylls and caroteniods at leaf and canopy scales
[J].
