

0 引言
降雨的时空分配影响了地面径流、土壤含水量等变化,是流域模型中非常重要的输入变量。随着降雨径流关系研究的深入,水文模型更多考虑到气象要素的空间分布。但由于地面观测站点易出现分布不均、过疏等局限性,难以展现气象要素的空间变异性,会对模拟准确度造成一定影响。以全球卫星降水计划(global precipitation measurement mission,GPM)和热带降雨测量任务卫星(tropical rainfall measuring mission,TRMM)等为代表的降水产品以时空连续、空间范围广等优势被应用于流域研究[1],Ibrahim等[2]发现将TRMM和GPM降水产品(integrated multi-satellite retrievals for GPM,GPM IMERG)数据与湄公河土壤和水评估工具(soil and water assessment tool,SWAT)模型相结合能够捕捉径流变化值; 刘冀等[3]和王书霞等[4]比较TRMM等多种卫星降水产品在流域径流模拟效果; 蔡洁连[5]模拟赣江流域发现在日降水方面IMERG-Final数据对降水空间分布捕捉最强; Ji等[6]以降水产品驱动模型模拟雅鲁藏布江水文过程后发现GPM有较高的水文应用潜力。
但对于分布式模型划分的小尺度子流域,卫星产品仍需要空间分辨率上的改进,否则会出现无法提取降水值或子流域内格点过少的情况,对展现流域降水空间分布细节十分不利。由于地形等影响,卫星产品观测时与处理过程中造成的误差也可能导致模拟结果较差。Lyu等[7]利用GPM等分别驱动模型并发现产品的不同特性会影响径流变化结果; 孙赫等[8]在雅鲁藏布江径流模拟过程中发现几类降水产品的误差特征会沿水文模型传递。对流域气象要素的数据质量提升能够有效改进模拟效果,范宏翔等[9]在鄱阳湖流域日径流研究中采用长短时记忆模型构建气象要素与径流量的关系提升效果; 张帆等[10]利用随机森林(random forests,RF)等多种机器学习方法改进洪水过程模拟效果。
对于卫星遥感产品,降尺度是提升数据质量的重要方法,一般有多元线性回归(multiple linear regression,MLR)、地理加权回归(geographically weighted regression,GWR)和RF等[11-12]。Ma等[13]假设地形与降水之间的关系提出地理移动窗口权重分解分析对GPM降尺度后输入赣江模型中改进模拟; 闵心怡等[14]将TRMM和GPM IMERG分别与站点实测降雨数据融合驱动HEC-HMS(the hydrologic engineering centers-hydrologic modeling system)模型从而优化预报精度; 田晶等[15]基于日偏差校正(daily bias correction,DBC)降尺度模型模拟汉江流域未来径流变化; 孙桂凯等[16]采用GWR提升GPM径流模拟的适用性; Zhao等[17]引入地形因子与降水季节特征构建机器学习降水融合模型提升降水产品精度并验证其在雅砻江逐日径流量模拟中有良好适用性。
HEC-HMS模型是近年来被广泛应用的分布式水文模型之一。Cheng等[18]验证了HEC-HMS在中国丘陵山区小流域的应用符合精度要求; Fanta等[19]对比HEC-HMS与SWAT模拟埃塞俄比亚托巴流域日径流变化情况时发现HEC-HMS有更好的精确度与平稳性; 廖如婷等[20]发现HEC-HMS能有效模拟短时和长时降雨径流过程; Fang等[21]提出的耦合HEC-HMS和RF算法的混合模型可以反映九龙江子流域的洪涝致灾过程细节。HEC-HMS模型考虑各子流域的要素变化情况,输入降水数据的精度影响最终的径流模拟结果。在以往研究中,一般采取全局回归的数据融合方式改进输入的降水产品,参与融合的环境因子较为单一,考虑到以多种辅助因子结合机器学习模型实现输入数据的降尺度的研究较少。故本文以卫星降水产品降尺度为侧重点,基于RF模型并融合地理位置、地形、风速、云量、地表温度和植被指数等多源辅助因子对信江流域汛期GPM日降水产品进行降尺度。得到1 km×1 km的日降水数据后,输入分布式水文模型HEC-HMS中完成信江流域2018—2020年汛期日径流量模拟,验证卫星产品数据精度的提升对流域模拟过程的改进。
1 研究区概况及数据源
1.1 研究区概况
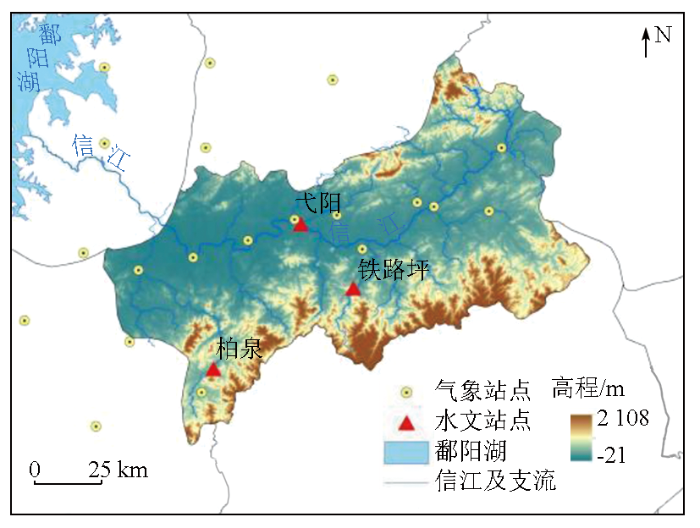
信江流域是鄱阳湖流域子流域之一。流域内以山地丘陵为主,中游沿岸为信江盆地,其边缘地势由北、东、南三面逐渐向中间河谷平原降低,下游为地势平坦开阔的冲积平原(图1)。属亚热带季风湿润气候区且距离水汽源较近,雨量充沛且集中在4—7月,相较于鄱阳湖其他子流域,易发生强降雨[22]。但降水受地形影响较大,地区与季节上分布不均,形成暴雨多、范围广、强度大的特点,极易形成洪水。流域内多是由砂岩风化而成的红壤、棕壤,土地利用方式以森林、耕地为主,灌木林和湿地的面积占比较小[23]。近几十年来,在气候变化和人类活动的影响下,流域地表、地下水文和径流状况发生变化,给流域农业生产和人类生活造成了巨大损失[24]。流域内共包含国家级气象站点11个和水文站3个,其中流域内11个气象站点基本位于信江干流附近地形平坦地区,从整个流域来看分布不均匀,利用这些站点数据插值到整个流域尤其使地形复杂区势必会产生较大误差,影响径流模拟准确性; 信江流域包含弋阳站、铁路坪站和柏原站3个水文站点,站点较少,其中铁路坪站、柏泉站均位于地势较为复杂的支流并靠近多个流域边缘,考虑到模型构建过程中需要集成各子流域特性,本文选择以信江干流的弋阳站为流域出口位置生成流域模型,作为率定与验证的实测值。
图1
1.2 数据源及其预处理
采用的气象台站观测数据来源于中国气象数据网(
选取的数字高程模型(digital elevation model,DEM)为美国国家航空航天局(National Aeronautics and Space Administration,NASA)发布的全球30 m空间分辨率NASA DEM数据(
2 研究方法
2.1 降水产品降尺度方法
2.1.1 影响因子选取
信江流域位于中国东部地区,降水与东亚夏季风密切相关,汛期降雨的影响因子复杂,全球增暖,海面蒸发增强,大气系统容纳的水汽能力增加是引起极端降水增加的直接因素,直接导致了信江流域受到来自海洋强水汽输送[27]。信江流域地形呈东、南、北三面向中部河谷平原不断降低的趋势,对水汽有一定的阻碍作用,因此地理位置、地形及下垫面等因子对该地区水汽输送与降水分布有影响。温度影响土壤湿度、地面的蒸散与陆面热力性质的变化,同时研究表明降水过程影响着地温、风速、云量等气象要素的相关变化[28-29],造成与流域土壤湿度、蒸散发情况密切相关的植被覆盖的改变。因此本文降尺度过程中,采用引入地理位置(经度)、地形(海拔、坡度、地形起伏度、地形切割度、地形位置指数、地形曲率)、风速、云量、地表温度及NDVI等多方面影响因子[30-31],用于改进GPM日降水分布数据。
2.1.2 地形因子降维
选取的地形因子(海拔、坡度、地形起伏度、地形切割度、地形位置指数、地形曲率)输入降尺度模型时,可能存在较强相关性,故对其进行降维以消除变量间的重复信息。主成分分析(principal component analysis,PCA)通过正交变换将多个存在相关性的变量转换为少数几个不相关的综合变量,可有效降低分析问题的复杂性,并尽可能保留原始变量的信息。对于具有n组观测数据的p个原始指标变量xi=(xi1,xi2,…,xip)T,其中i=1,2,…,n,PCA通过原始指标标准化变换、计算标准化的相关系数阵及其特征值和特征向量等步骤,得到新的主成分变量[17]。
2.1.3 融合站点信息的RF降尺度模型
RF是一种基于分类和回归树(classification and regression tree,CART)的机器学习模型。CART在回归分析中,向量Y表示变量矩阵X中每个观察值的响应值。矩阵X和向量Y可以分裂成不同的子集来回归具有一定数量节点的树,通过建立模型解释X和Y之间的关系,以采样数据预测Y。对模型结果影响较大的参数主要有决策树数目ntree和指定节点中用于二叉树的变量个数mtry,一般来说mtry取值默认为输入变量个数的二次方根或三分之一,对效果影响不大[32-33]。在模型构建过程中,采用Bootstrao法在N个总样本中有放回地随机抽取得到多个样本子集ntree,每个样本子集生成一个决策树并在每个节点选择mtry参数; 未被抽取的样本组成袋外数据,对于每个决策树可以得到袋外数据的误差估计,对其取平均作为RF的误差估计,判断模型构建的好坏[34],并因此对决策树数目ntree进行遍历寻优。
为了细化GPM在分布式模型各子流域的空间分布并提升其在水文模型中的适用性,本文将日降水数据与降维后的地形因子、地理位置、NDVI、风速、云量和地表温度数据输入RF模型,在Python环境下建立降水量与其他因子之间的关系。以0.1°×0.1°格点对应位置的GPM降水资料与影响因子作为训练集建立RF回归模型,输入高分辨率的与解释因子生成1 km×1 km的新降水数据集RF1; 为评价研究区内站点对降水数据集的校正作用,同时本文对常用RF降尺度模型与融合站点信息的模型进行改进与对比,在已有解释因子的基础上加入站点降水观测日值建立训练集并参与模型,调整参数得到融合站点信息的1 km×1 km的新降水数据集RF2,比较RF1与改进后的RF2对GPM的精度提升效果与对降水的预测能力,对高精度数据RF1和RF2进行精度评价与水文模拟效果的对比。
2.2 降尺度精度评价
对于评价初始与改进后的卫星降水产品在研究区的适用性,采用相关系数(correlation coefficient,CC)、均方根误差(root mean square error,RMSE)和平均绝对误差(mean absolute error,MAE)3项指标评价卫星降水数据与地面测站数据的数值一致性,衡量卫星降水产品与实测降水的密切程度和偏离程度等; 由于径流流量等的变化与短时间内降水量相关,所以对卫星产品对日降水事件探测能力进行评价,通过探测率(probability of detection,POD)、空报率(false alarm ratio,FAR)和探测精确度(accuracy,ACC)这3项评价指标来检验[35-36],公式为:
式中:
2.3 HEC-HMS模型构建
2.3.1 模型原理
表1 HEC-HMS模型计算方法选择
Tab.1
| 计算模块 | 计算方法 | 方法原理与输入参数 |
|---|---|---|
| 产流计算 | SCS曲线数法 | 根据累积降雨量、土地利用方式、土壤类型以及前期土壤含水量等条件模拟计算产流量,由土壤最大蓄水能力与流域特征的关系引入参数CN |
| 直接径流计算 | 斯奈德单位线法 | 通过收集某集水区的降雨和径流资料,算出单位线,单位线峰现时间与流量滞时tlag有关 |
| 基流计算 | 指数衰退法 | 假设集水区任意时刻的基流量和初始基流存在某种关系,由流量成分取值衰减常数k |
| 河道汇流计算 | 马斯京根法 | 将马斯京根槽蓄曲线方程和水量平衡方程联合演算出马斯京根流量演算方程,需要输入蓄量常数K和流量比重因子x |
2.3.2 模型构建
基于ArcGIS10.8软件结合HEC-GeoHMS模块对DEM进行预处理与基本水文分析,完成填洼、水流方向计算、汇流量累积和河网提取等,以弋阳站为流域出口位置,生成数字流域并划分子流域。在创建气象模块时,由于子流域面积不一,气象站分布不均,所以根据泰森多边形法计算每个子流域中气象站点控制的面积比与权重。最后通过HEC-DSSVue软件将步长为1 d的实测降雨数据添加到HEC-HMS软件中,建立气象模型并进行参数率定。
2.3.3 研究时段确定与参数率定
根据率定的HEC-HMS模型及参数,以2020年4—7月所有降雨径流事件作为验证。通过验证后,筛选出率定期和验证期所有符合预测标准的场次作为研究时段,利用2种改进过程的高精度卫星数据与GPM分别输入模型进行模拟,比较模型模拟精度。对模拟结果与实测资料之间的拟合度的评价指标一般为Nash-Sutcliffe效率系数(RNS)、相关系数(RCC),对输入的卫星降雨数据相对于地面雨量观测数据的精度进行评估[40]。计算公式分别为:
式中:
3 结果与分析
3.1 地形因子降维
为全面表达地形因子对区域降水的影响,选取高程、坡度、地形起伏度、地形切割度、地形位置指数和地形曲率6个地形因子。由相关系数计算结果(表2)可知,部分地形因子存在较强的相关性,如海拔和地形起伏度、地形切割度呈现显著的正相关,说明多个地形因子中包含信息冗余,可能对后续研究产生不利影响。为此使用PCA法对地形因子进行降维,消除各变量的相关性。
表2 各地形因子的相关系数
Tab.2
| 地形因子 | 海拔 | 坡度 | 地形起伏度 | 地形切割度 | 地形位置指数 | 地形曲率 |
|---|---|---|---|---|---|---|
| 海拔 | 1.000**① | 0.718** | 0.819** | 0.858** | 0.314** | 0.544** |
| 坡度 | 1.000** | 0.920** | 0.886** | 0.011** | 0.614** | |
| 地形起伏度 | 1.000** | 0.958** | 0.044** | 0.670** | ||
| 地形切割度 | 1.000** | 0.088** | 0.614** | |||
| 地形位置指数 | 1.000** | -0.079** | ||||
| 地形曲率 | 1.000** |
①**表示通过0.01水平的显著性水平检验。
在计算中前2个主成分分量的累积方差贡献率达86.528%,故可用其替代原始变量,以2个主成分变量F1和F2表达所有地形因子。将特征贡献率作为系数,对应的指标作为自变量,可以得出每一个主成分分量的计算表达式分别为:
3.2 基于RF的遥感降水产品降尺度精度分析
将降维后的地形因子与经度、风速、云量、地表温度、NDVI等影响因子分别输入2类RF模型中,进行参数调优后得到经过降尺度的日降水数据RF1与融合站点信息的日降水数据RF2。与GPM数据相比,RF1和RF2弥补了边缘锯齿状等问题,细化了空间分布。从空间分布趋势来看(图2),RF1与GPM数据保持一致,4—6月呈现南北分布趋势,7月低值区位于中部平原地区而高值区位于南北山区,RF1数据降水空间分布细节的表现能力更强且边缘更加平滑。融合站点实测资料的RF2在分布趋势上与GPM和RF1不同,与流域高程分布(图1)对比可见,RF2分布趋势与地形变化相似,4—7月低值区位于流域中部信江盆地,沿信江干流即气象站点主要分布区域的降水分布细节表达更明显,数值明显降低,南北山区普遍降水值高于中部平原地区,且与站点实测值分布规律更相近,可能与RF2模型中实测值与地形因子对降雨的影响重要性较高有关。与RF2相比,GPM与RF1在降雨低值区均有高估现象并未得到校正,主要体现在汛期4—6月。总体来看,3种产品在月尺度上变化趋势上相似,4—7月降水量逐渐增加,符合流域内实际降水量波动情况。在细节表达上,RF1和RF2均有明显提升,需要结合观测值进行评价。
图2
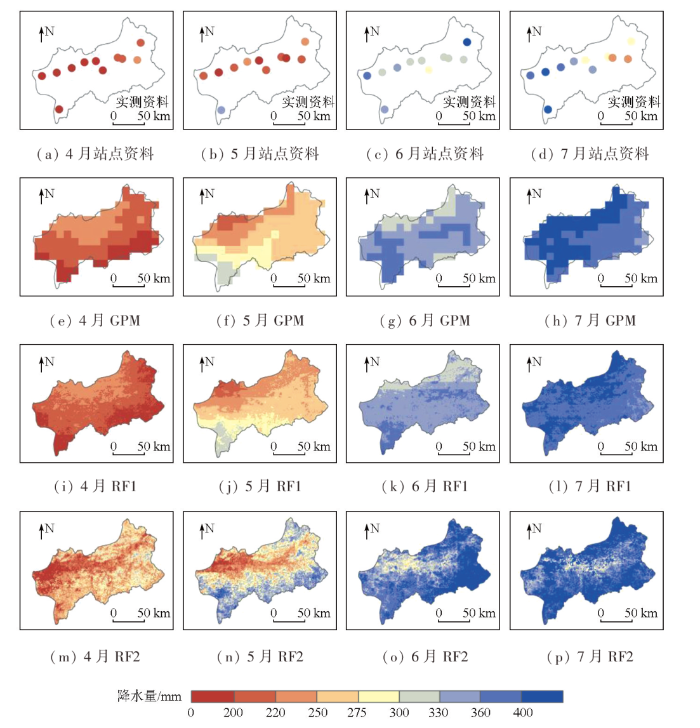
图2
GPM,RF1及RF2汛期各月平均降水量空间分布
Fig.2
Spatial distribution of average monthly precipitation in flood season for GPM, RF1 and RF2
为了具体分析3种降水产品在不同月份监测能力的差异性,本文对部分采样点日降雨量划分为小雨及无雨(<10 mm)、中雨([10~25) mm)、大雨([25~50) mm)和暴雨(≥50 mm)4个等级,分析3种产品对不同等级雨量的监测能力。由散点分布图(图3)可知,3种产品对小雨或无雨事件容易出现高估,在小雨级别经站点校正的RF2表现优秀,但容易误判无雨事件,可能由于RF2对微量降雨的捕捉有所上升而意外造成对无雨事件的错误识别; 在暴雨级别RF2和RF1延续了GPM对极端强降雨的高估,在总体趋势上3种产品基本一致,但RF2对极端强降雨事件的预测更为准确。
图3
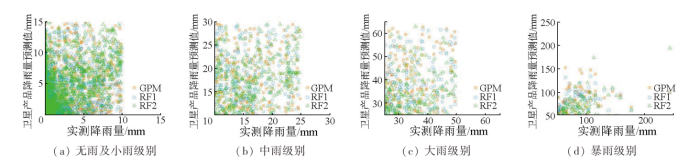
图3
不同雨量等级下降水预测值分布散点图
Fig.3
Scatter diagram of the predicted value distribution of falling water in different rainfall classes
通过表3中对3种日降水数据精度评价指标计算结果(CC,MAE,RMSE)可知,RF1与RF2降水结果与实测值的相关性较GPM有一定提升,对卫星产品的误差起到一定程度的修正。从不同月份精度评价指标均值(如图4所示)来看,GPM在4月普遍估计最好,CC为0.8,在5月相关性最差,最易发生极端降雨事件的6月和7月相关性都在0.7左右; 在4月MAE和RMSE都呈最低值而7月都出现最高值,与降水量变化有关,由于地形、观测误差等GPM在夏季容易对降水量低估; RF1和RF2结果与GPM呈现一致的趋势,都在4月表现性能最好而在夏季降水丰富的月份估计较不稳定,但对数据起到不同程度的修正。RF1在3项指标上,除7月MAE值更高外,其他月份CC值均上升、RMSE与MAE值均降低,但幅度较小; RF2在2项指标上呈现显著的改进效果,其中4月与7月的CC值提升最优,分别达0.84和0.79,MAE和RMSE相较于GPM与RF1都明显降低。在数据精度提升效果方面,RF2>RF1,可见融合站点资料能够校正卫星观测误差,避免其通过降尺度过程延续。
表3 不同产品日降水精度与降水事件探测能力评价
Tab.3
| 产品 | 精度评价指标 | 日降水 事件 | 探测 能力 | 评价 指标 | ||
|---|---|---|---|---|---|---|
| CC | MAE/mm | RMSE/mm | POD | FAR | ACC | |
| GPM | 0.696 | 6.833 | 14.894 | 0.772 | 0.448 | 0.523 |
| RF1 | 0.717 | 6.766 | 14.141 | 0.970 | 0.438 | 0.564 |
| RF2 | 0.779 | 5.480 | 11.991 | 0.871 | 0.451 | 0.530 |
图4
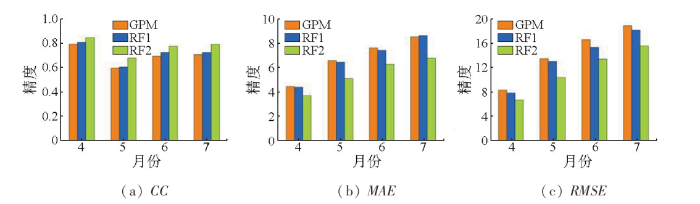
图4
日降水产品分月精度比较
Fig.4
Comparison of monthly precision of daily precipitation products
图5
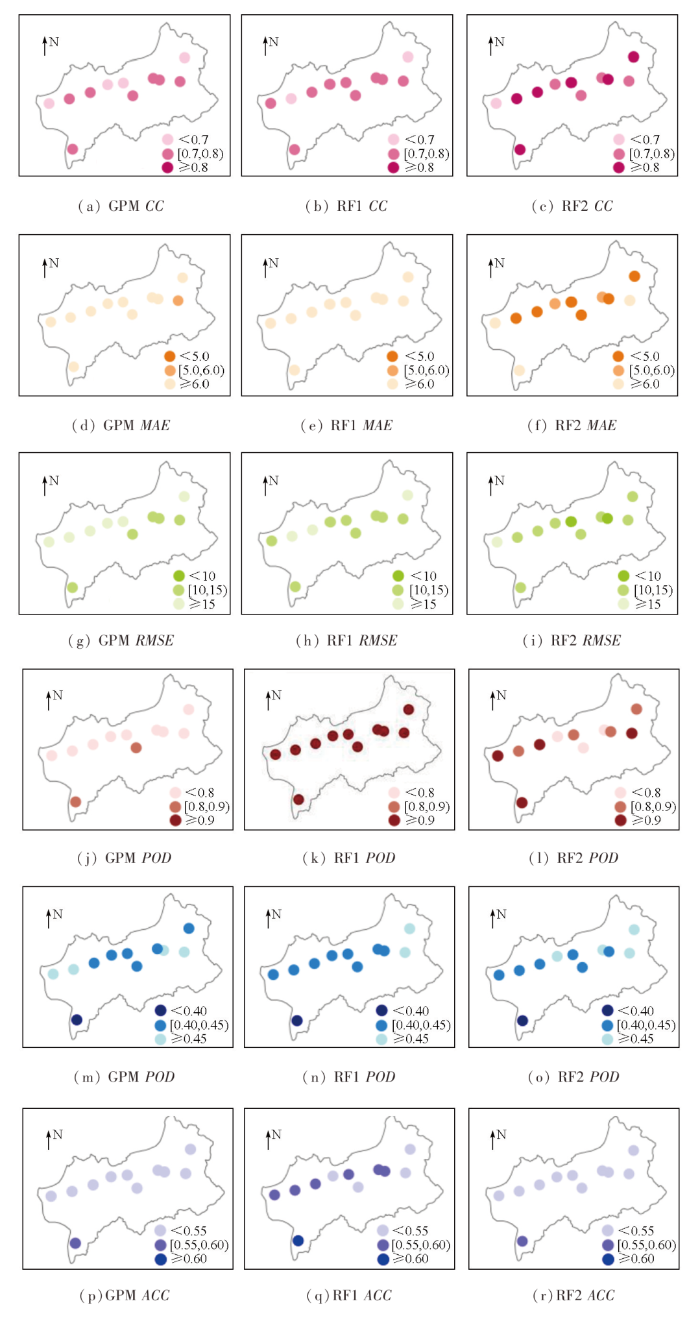
图5
GPM,RF1和RF2各评价指标空间分布
Fig.5
Spatial distribution of evaluation indexes of GPM, RF1 and RF2
通过表3中3种产品日降水事件探测能力评价结果(POD,FAR,ACC)可知,RF1和RF2在POD方面均得到改善,尤其是RF1的POD均值达0.97。在FAR和ACC方面RF1和RF2与GPM质量相当。RF1相较于GPM空报率下降、探测精度有小幅度的提升; RF2在ACC方面有一定改善,但FAR上稍高,可能与模型预测过程中对无雨事件的误判导致。总体上看,RF1与RF2优化了卫星产品的估算能力,虽然在降水事件探测能力各方面提升还不全面,但一定程度上改进了卫星产品的质量,其中改进效果RF1优于RF2。从图5后三排降水事件探测能力评价指标空间分布来看,RF1相较于GPM在对降水事件成功探测率方面各站点均表现优秀,POD>0.95; RF2较GPM探测率有所升高,改进了GPM在部分验证点位置探测能力,但提升效果不如RF1,究其原因可能与模型计算时融合站点降水资料而带来对无雨事件的误判有关。在FAR上,RF1表现更好,RF1和RF2对研究区西部验证点改进效果明显。ACC方面,RF1高于GPM与RF2,表现出良好的日降水事件探测精确度。
3.3 基于改进的降雨数据的径流模拟结果分析
以信江干流的弋阳站为流域出口位置生成数字流域并建立气象模型,图6为HEC-GeoHMS生成的研究区子流域划分结果与各气象站控制范围示意图,子流域自动编号分别为W440—W690。由于站点分布集中在信江干流,各气象站点对流域的控制面积不一。
图6
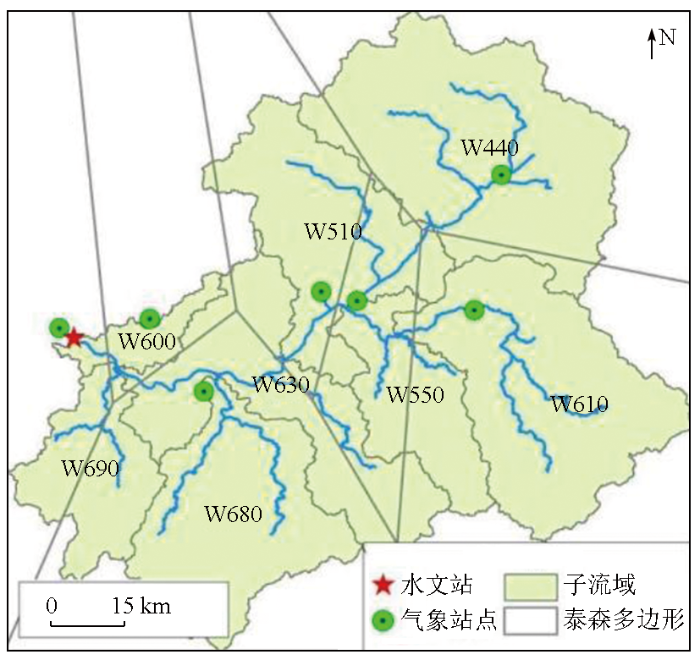
图6
子流域划分与气象站控制范围示意图
Fig.6
Schematic diagram of sub watershed division and meteorological station control range
表4为弋阳站率定期与验证期各场次GPM,RF1和RF2驱动模型径流模拟的精度评估结果。关于降水产品参与模拟的时段确定,对研究范围内所有降水-径流过程进行模拟后,验证期2020年4—7月共5个场次的模拟结果符合标准。率定期个别场次率定期模拟结果虽RNS达到预报水平,但避免影响GPM,RF1和RF2模拟进行剔除。最后共筛选出率定期与验证期所有符合预报水平的(本研究中以RNS>0.5为判定标准)共计16个场次,并以起始日进行命名,以卫星产品驱动径流模拟。基于通过验证的系数,GPM及降尺度后的2种降水产品RF1和RF2模拟结果的RNS和RCC评估见表4。由系数可知除个别场次,3种产品的模拟精度较好,验证了参数率定后模型的可行性,例如20180511,20190423,20200524等场次相较于实测降水资料模拟大幅提升。但对不同的月份,RNS变化较大,如20190617,20200418和20200524这3个时段,GPM,RF1和RF2的RNS远低于实测模拟结果,不满足预报标准,准确度与稳定度不佳。
表4 弋阳站GPM,RF1,RF2径流模拟精度评估
Tab.4
| 场次 | 参数 | GPM | RF1 | RF2 | 场次 | 参数 | GPM | RF1 | RF2 | |
|---|---|---|---|---|---|---|---|---|---|---|
| 率 定 期 | 20180410 | RNS | 0.697 | 0.689 | 0.499 | 20190423 | RNS | 0.806 | 0.851 | 0.546 |
| RCC | 0.892 | 0.870 | 0.754 | RCC | 0.915 | 0.938 | 0.854 | |||
| 20180511 | RNS | 0.870 | 0.909 | 0.751 | 20190516 | RNS | 0.509 | 0.643 | -0.459 | |
| RCC | 0.943 | 0.959 | 0.937 | RCC | 0.877 | 0.904 | 0.855 | |||
| 20180526 | RNS | 0.427 | 0.495 | 0.304 | 20190531 | RNS | 0.703 | 0.791 | 0.822 | |
| RCC | 0.764 | 0.779 | 0.874 | RCC | 0.887 | 0.898 | 0.907 | |||
| 20180610 | RNS | 0.414 | 0.433 | 0.631 | 20190617 | RNS | 0.218 | 0.363 | -0.196 | |
| RCC | 0.836 | 0.836 | 0.936 | RCC | 0.800 | 0.854 | 0.724 | |||
| 20180630 | RNS | 0.644 | 0.667 | 0.367 | 20190703 | RNS | 0.377 | 0.435 | 0.523 | |
| RCC | 0.965 | 0.970 | 0.883 | RCC | 0.788 | 0.790 | 0.746 | |||
| 20190401 | RNS | 0.712 | 0.788 | -0.117 | ||||||
| RCC | 0.910 | 0.923 | 0.848 | |||||||
| 验 证 期 | 20200418 | RNS | -0.169 | 0.062 | -0.658 | 20200608 | RNS | 0.289 | 0.773 | 0.110 |
| RCC | 0.727 | 0.709 | 0.746 | RCC | 0.956 | 0.972 | 0.947 | |||
| 20200509 | RNS | -3.681 | -1.988 | -4.469 | 20200629 | RNS | 0.600 | 0.610 | 0.618 | |
| RCC | 0.163 | 0.312 | 0.166 | RCC | 0.879 | 0.872 | 0.867 | |||
| 20200524 | RNS | 0.608 | 0.712 | 0.893 | ||||||
| RCC | 0.977 | 0.963 | 0.989 | |||||||
模拟精度上看,RF1基本优于GPM且两者变化趋势基本保持一致,可以推测出RF1模型在提升GPM分辨率的同时也优化了GPM在水文模型中的适用性,尤其是20180511和20190423等时段RNS>0.85,RCC同样保持较好水平; 但融合了站点信息的RF2模拟精度容易出现极端情况,在20180610,20190531,20190703和20200524等时段较GPM与RF1的模拟精度有较大提升,在20160526,20180630,20190401和20190617等时段较GPM有明显降低,可能来自于卫星自身误差与站点分布不均导致校正效果在不同子流域内出现明显差异这2种情况的共同作用,需要结合日径流量变化曲线进行分析。
为了分析RF1和RF2较GPM模拟径流曲线与实测径流拟合情况,并考虑到RF2模拟精度不稳定,图7—8分别为以RNS为标准弋阳站在RF2较GPM模拟精度提升与下降的时段模拟结果与实测结果的对比结果。综合来看,采用GPM,RF1和RF2这3种产品模拟径流得到的流量曲线在峰形上与实测降雨模拟结果大体一致,在20180511和20190423等时段高峰区接近实际流量峰值点; 但表现出整体上对流量的高估,导致如20200418和20200509这2个时段的预测效果不佳,并出现了峰值点滞后或提前的情况,在低值区浮动时存在一定差异,易远超于实际流量。虽然洪峰基本一致,但在20190531等时段晚于实际流量曲线峰值点1~2 d,且在低值区表现出实际径流未有的起伏; 20190617出现峰值的提前,可能与日值资料时间尺度有关。经过降尺度后的RF1,RF2与GPM相比,RF1与GPM径流曲线峰形更接近,且一定程度上修正了GPM的高估现象,如20200608时段降低了GPM对径流量峰值的显著高估、更接近平均径流量,RNS提升至3倍; 在20200418等降水产品整体模拟效果不佳的场次也最接近实际径流变化。总体上RF1延续了GPM降水模拟的特征,其原因在于RF1与GPM降水分布趋势十分接近,但在子流域降雨值提取时修正了部分因为空间分辨率不适配造成的误差,且融合了地形等多源辅助因子,优化了GPM在地形复杂区的分布细节。
图7
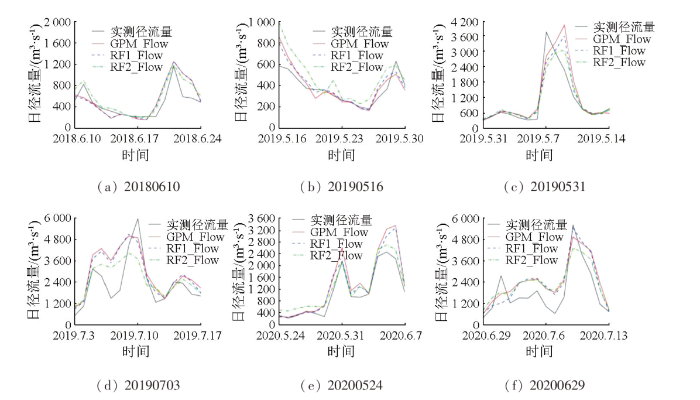
图7
模拟结果与实测结果对比(RF2较GPM模拟较好场次)
Fig.7
Comparison of simulation results and measured results
图8
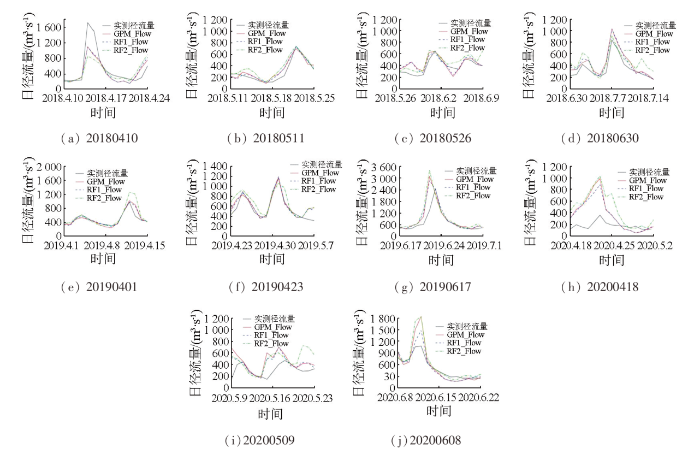
图8
模拟结果与实测结果对比(RF2较GPM模拟较差场次)
Fig.8
Comparison of simulation results and measured results
融合了站点信息的RF2模拟结果存在一定的不稳定性,曲线形状基本延续GPM的特征。如图7所示,由于站点的校正作用,RF2在部分场次如20180610和20200524等的高峰区较GPM和RF1更接近实测流量曲线,对小峰值和峰谷的捕捉更为精准,降低了GPM和RF1的高估,且由于对GPM卫星产品特征的传递也修正了气象站点不连续的空间分布缺陷,细化降水空间分布情况并提升了GPM在水文模型中的适用性。对于不同场次,降水产品的模拟效果存在差异,尤其对于高值区的捕捉更为准确,可能与研究区降水的时间分布不均有关。结合径流曲线与模拟精度分析可知,2019年5—7月和2020年6月的时段径流量曲线出现急剧增加的峰值且峰值达3 000 m3/s以上,可能由于强降雨事件导致,3种卫星产品的模拟精度均处于较好水平,与图5中GPM,RF1和RF2的CC表现一致,尤其是RF2对平均径流量估测的表现均优于GPM,在如20200524等时段有效修正了GPM和RF1对峰值的高估,展现出前文所述的RF2在降水丰富的6月和7月对GPM精度提升作用。
但如图8所示,RF2在部分场次精度提升效果不佳,主要原因是在RF2对径流曲线低值区小峰值的模拟较差,明显高估了径流量。经过与降水分布相结合分析猜测是: 其一,由雨量分级散点图(图3)与POD指数(表3)可以看出,RF2经校正后数据精度提高,但增加了对无雨事件的错判,影响RF2对降水事件的捕捉能力提升,所以降雨时观测到的降水量容易出现异于子流域真实均值的情况; 其二,地形与降水存在一定相关关系,而站点位置大多处于流域中部平原区(图1),在RF2模型中影响了地形复杂区的预测。GPM与RF1模拟出的径流曲线精度较优; RF2结合了站点实测资料与卫星降水产品的多种特征,融合站点信息起到一定校正作用但在部分时段也延续了站点分布不均而造成的缺陷。
4 结论
以信江流域为研究区域,引入高分辨率的地理位置、地形、风速、云量、地表温度及NDVI等作为解释因子建立RF降尺度模型对GPM IMERG日降水产品进行质量的提升,并对2种降水产品RF1和RF2进行精度与降水事件探测能力的评价; 再将GPM,RF1与RF2分别输入HEC-HMS模型中完成径流模拟,得到3种数据集的日径流量变化曲线并进行分析,评价RF1与RF2对GPM在径流模拟中适用性的改进作用。得到的结论如下:
1)比较RF1和RF2降尺度结果可知,以多源解释因子与GPM预测得到的RF1和RF2对降水分布细节进行了优化,提高了降水探测能力,其中未融合站点信息的RF1保留了GPM的分布特征。在精度提升效果上RF2>RF1,日尺度相关系数CC达0.78,RMSE和MAE误差值下降,这与RF2融合了站点信息有关; 但RF2对日降水事件探测的命中率不如RF1。GPM,RF1与RF2在不同月份精度评价结果有所差异,其中7月预测效果较差,可能与GPM对强降雨的探测能力有关。
2)以GPM,RF1与RF2分别驱动HEC-HMS模型完成日径流量曲线的模拟,RF1提升了GPM的模拟适用性,虽继承了GPM高估的特点但在高峰值区比GPM更接近真值; 由于气象站点集中在地势平坦的河谷平原,部分时段融合了站点信息的RF2在地形复杂区的预测准确度受到了影响,并且提升了各雨量级数据精度的同时也易对无雨事件易造成误判,命中率受影响,影响了RF2对子流域降水预测的稳定性,但在强降雨导致的径流量剧增等情况下,RF2对平均径流量的估测更为准确,且降低了GPM在径流曲线峰值区的部分高估。总体上,经过质量提升后的RF1和RF2不同程度上优化了GPM作为输入降水数据在HES-HMS模型中的适用性。
3)经过分析发现,在降尺度过程中融合站点信息能够明显提升降水产品数据质量,校正由地形等造成的卫星观测误差,但当研究区域存在站点分布不均、流域内站点密度小等问题,会对预测结果与水文模拟有影响,后期会再择其他子流域进行计算对比,寻找降尺度模型优化思路。降雨是径流量变化的重要影响因子,通过本文研究发现选择时间分辨率更高的产品捕捉流量变化,径流模拟效果应有较大的提升,后期可以再做进一步实验改进。同时本文径流模拟研究序列较短,用于验证的样本较少,后续研究中可以增加率定与验证场次。此外,根据实际站点分布或卫星对不同级别雨量观测能力的不同进行模型的优化,也是后续研究中对模型改进的一条思路。
参考文献
最新GPM降水数据在黄河流域的精度评估
[J].
The evaluation of latest GPM-Era precipitation data in Yellow River basin
[J].
Improved hydrological decision support system for the lower Mekong River Basin using satellite-based earth observations
[J].
DOI:10.3390/rs10060885
PMID:29938116
[本文引用: 1]

Multiple satellite-based earth observations and traditional station data along with the Soil & Water Assessment Tool (SWAT) hydrologic model were employed to enhance the Lower Mekong River Basin region's hydrological decision support system. A nearest neighbor approximation methodology was introduced to fill the Integrated Multi-satellite Retrieval for the Global Precipitation Measurement mission (IMERG) grid points from 2001 to 2014, together with the Tropical Rainfall Measurement Mission (TRMM) data points for continuous precipitation forcing for our hydrological decision support system. A software tool to access and format satellite-based earth observation systems of precipitation and minimum and maximum air temperatures was developed and is presented. Our results suggest that the model-simulated streamflow utilizing TRMM and IMERG forcing data was able to capture the variability of the observed streamflow patterns in the Lower Mekong better than model-simulated streamflow with in-situ precipitation station data. We also present satellite-based and in-situ precipitation adjustment maps that can serve to correct precipitation data for the Lower Mekong region for use in other applications. The inconsistency, scarcity, poor spatial representation, difficult access and incompleteness of the available in-situ precipitation data for the Mekong region make it imperative to adopt satellite-based earth observations to pursue hydrologic modeling.
基于不同卫星降雨产品的澴水花园流域径流模拟比较研究
[J].
Hydrological evaluations of runoff simulations based on multiple satellite precipitation products over the Huayuan catchment
[J].
遥感降水产品在澜沧江流域径流模拟中的适用性研究
[J].
Application of remote sensing precipitation products in runoff simulation over the Lancang River Basin
[J].
Evaluation of multiple satellite precipitation products and their potential utilities in the Yarlung Zangbo River Basin
[J].
DOI:10.1038/s41598-022-17551-y
PMID:35922539
[本文引用: 1]
Hydrological modeling in the Third Pole remains challenging due to the complex topography and scarcity of in-situ precipitation observations. In this study, we assessed five satellite precipitation products (SPPs) including TRMM3B42, PERSIANN-CDR, GPM-IMERG, CMORPH, and GSMaP, and simulated daily streamflow in the Yarlung Zangbo River Basin (YZRB) with VIC model. The performance of SPPs was evaluated by CC, RB, RMSE, POD and FAR, to compare with daily observations. Overall, all SPPs showed decreasing trends of precipitation from east to west compared to 10 km rainfall data. PERSIANN had the highest values of POD (0.65), RB (91.6%) and FAR (0.59) but worst performed in streamflow. CMORPH, GPM and TRMM fit well with the observations annually but overestimate the precipitation in the southeast during wet seasons. Simulation from GPM and CMORPH yield satisfactory results (NSE of 0.86 and 0.82, RE of - 20% and - 13%, respectively), while TRMM outperformed GPM in modeling runoff with smaller relative error. Results indicated the potential of GPM and CMORPH in providing alternative rainfall information in YZRB. Accurate evaluation of multi-source SPPs and their hydrological utility in YZRB would benefit further hydrometeorological studies and water resources management in this area.© 2022. The Author(s).
Multi-model driven by diverse precipitation datasets increases confidence in identifying dominant factors for runoff change in a subbasin of the Qaidam Basin of China
[J].
雅鲁藏布江流域多源降水产品评估及其在水文模拟中的应用
[J].
DOI:10.18306/dlkxjz.2020.07.006
[本文引用: 1]
论文对比分析了1980—2016年基于站点插值降水数据CMA(China Meteorological Administration)和APHRODITE(Asian Precipitation-Highly-Resolved Observational Data Integration Towards Evaluation)、卫星遥感降水数据PERSIANN-CDR(Precipitation Estimation from Remotely Sensed Information using Artificial Neural Network-Climate Data Record)和GPM(Global Precipitation Measurement)、大气再分析数据GLDAS(Global Land Data Assimilation System)以及区域气候模式输出数据HAR(High Asia Refined analysis)在雅鲁藏布江7个子流域的降水时空描述,利用国家气象站点数据对各套降水数据进行单点验证,并以这6套降水数据驱动VIC(Variable Infiltration Capacity)大尺度陆面水文模型反向评估了各套降水产品在雅鲁藏布江各子流域径流模拟中的应用潜力。结果表明:① PERSIANN-CDR和GLDAS年均降水量最高(770~790 mm),其次是HAR和GPM(650~660 mm),CMA和APHRODITE年均降水量最低(460~500 mm)。除GPM外,其他降水产品在各子流域都能表现季风流域的降水特征,约70%~90%的年降水量集中在6—9月份。② 除PERSIANN-CDR和GLDAS外,其他降水产品皆捕捉到流域降水自东南向西北递减的空间分布特征。其中,HAR数据空间分辨率最高,表现出更详细的流域内部降水空间分布特征。③ 与对应网格内的国家气象站降水数据对比显示,APHRODITE、GPM和HAR降水整体低估(低估10%~30%),且严重低估的站点主要集中在下游(低估40%~120%)。PERSIANN-CDR和GLDAS整体表现为高估上游流域站点降水(高估28%~60%),但低估下游流域站点降水(低估11%~21%)。④ 在流域径流模拟上,当前的6套降水产品在精度或时段上仍无法满足水文模型模拟的需求。⑤ 通过水文模型反向评估,6套降水产品中区域气候模式输出的HAR在流域平均降水量和季节分配上更合理。
Evaluation of multiple precipitation datasets and their potential utilities in hydrologic modeling over the Yarlung Zangbo River Basin
[J].
DOI:10.18306/dlkxjz.2020.07.006
[本文引用: 1]
The gauge-based precipitation data from the National Climate Center, China Meteorological Administ-ration (CMA), Asian Precipitation-Highly-Resolved Observational Data Integration Towards Evaluation (APHRODITE), Precipitation Estimation from Remotely Sensed Information using Artificial Neural Network-Climate Data Record (PERSIANN-CDR), Global Precipitation Measurement (GPM), Global Land Data Assimilation System (GLDAS), High Asia Refined analysis (HAR) are compared with each other and evaluated by the precipitation data from 16 national meteorological stations during 1980-2016 in the Yarlung Zangbo River and its sub-basins. The potential utilities of these multiple precipitation datasets are then systematically evaluated as inputs for the variable infiltration capacity (VIC) macroscale land surface hydrologic model. The results show that: 1) PERSIANN-CDR and GLDAS contain the largest precipitation estimates among the six datasets with mean annual precipitation of 770-790 mm, followed by the HAR and GPM (650-660 mm), while CMA and APHRODITE contain the lowest precipitation estimates with mean annual precipitation of 460-500 mm. All the products can detect the large-scale monsoon-dominated precipitation regime in the Yarlung Zangbo River and its sub-basins with 70%-90% of annual total precipitation occurring in June-September except the GPM. 2) The general spatial pattern of the annual mean precipitation fields is roughly in agreement among the six datasets, with a decreasing trend from the southeast to the northwest in the Yarlung Zangbo River Basin except the PERSIANN-CDR and GLDAS. 3) Relative to the data from the national meteorological stations, APHRODITE, GPM, and HAR generally underestimate precipitation by 10%-30%, while PERSIANN-CDR and GLDAS overestimate precipitation from stations in upstream sub-basins by 28%-60% and underestimate precipitation from stations in downstream sub-basins by 11%-21%. 4) The six precipitation datasets cannot satisfy the needs of hydrological simulation in term of accuracy or period in the basin. 5) HAR precipitation data—output of regional climate model—show more reasonable amount and seasonal pattern among the six datasets in the upper Brahmaputra according to the inverse evaluation by VIC hydrological model.
基于长短记忆模型的鄱阳湖流域径流模拟及其演变的归因分析
[J].
Simulation and attribution analysis based on the long-short-term-memory network for detecting the dominant cause of runoff variation in the Lake Poyang Basin
[J].
多种机器学习模型对不同洪水类型特征指标模拟效果评估
[J].
DOI:10.18306/dlkxjz.2022.07.008
[本文引用: 1]
洪水过程的特征指标不仅包括洪水量级,还包括时间、形态、动力学等指标。现有模型和方法重点关注洪水量级指标的模拟,对其他指标的模拟仍有待深入。如何实现对洪水过程所有特征指标的模拟已成为目前洪水预报的技术瓶颈。论文采用4种机器学习模型(多元线性回归、多层感知器、随机森林和支持向量机)对淮河上游长台关流域59场降雨—洪水场次7个特征指标(洪水总量、洪峰流量、洪水历时、洪峰时间偏度、高流量历时占比、涨洪和落洪速率)进行模拟,评估不同模型对不同洪水类型和特征指标的模拟效果。结果显示:① 长台关流域洪水过程可分为3类,第1类洪量中等、历时长且洪峰出现时间偏前(16场);第2类洪量低、形态矮胖且洪峰出现时间靠后(34场);第3类洪量大、涨落水迅速、形态尖瘦(9场)。② 时间指标模拟效果最优,动力学指标模拟效果最差。多元线性回归和随机森林模拟效果随所有特征指标数值的增加而增强;支持向量机的模拟效果随着洪水历时指标数值的增加而降低,随着其余特征指标数值的增加而增强;多层感知器模拟效果随着洪水总量、洪峰流量、高流量历时占比和涨洪速率等指标值的增加而增强。③ 从各类型洪水特征模拟精度来看,4种模型对第3类洪水特征模拟均为最佳,第2类最差;随机森林在第1类和第3类洪水特征模拟中效果最优,支持向量机对第2类洪水特征模拟效果最优。④ 从综合模拟精度来看,支持向量机效果最优,然后依次为随机森林、多层感知器和多元线性回归。上述4种模型率定和验证期相对误差分别为23%和98%、21%和109%、37%和75%、41%和102%。研究可为流域洪水过程深度挖掘和防洪措施制定提供参考和借鉴。
Performance of multiple machine learning model simulation of process characteristic indicators of different flood types
[J].
DOI:10.18306/dlkxjz.2022.07.008
[本文引用: 1]
The characteristic indicators of flood process include not only flood magnitude, but also flood duration, dynamics, and so on. The existing models and methods focus on the simulation of flood magnitude indicators, but the simulation of other indicators remains insufficient. In this study, four machine learning models — multiple linear regression, multi-layer perceptron, random forest, and support vector machine — were used to simulate seven characteristic indicators — total flood volume, peak flow, flood duration, time deviation of flood peak, proportion of high flow duration, flood rise and fall rates — of 59 rainfall-flood events in the Changtaiguan Basin in the upper reaches of the Huaihe River. The simulation performance of the models for different flood types and characteristic indicators were evaluated. The results show that: 1) The flood process in the Changtaiguan Basin can be divided into three categories. The first category is characterized by moderate flood volume, long duration, and earlier peak time (16 fields); the second type has low flood volume, short and fat shape, and the flood peak appears later (34 fields); the third type has large flood volume, sharp and thin shape, and flood rises and falls rapidly (9 fields). 2) Time indicator simulation performed the best and dynamic indicator simulation performed the worst; the performance of multiple linear regression and random forest simulation increased with the increase of all characteristic indicator values. The simulation performance of support vector machine decreased with the increase of flood duration, and increased with the increase of value of the remaining characteristic indicators. The simulation performance of multi-layer perceptron increased with the increase of value of four indicators, namely, total flood volume, peak flow, proportion of high flow duration, and flood rise rate. 3) With regard to the simulation accuracy of characteristic indicators of various types of floods, the four models performed the best for the simulation of the third type of floods, but the worst for the second type; random forest showed the best simulation performance for the first and third types of floods, and support vector machine showed better simulation performance for the second type of floods. 4) According to the comprehensive simulation accuracy, the support vector machine model performed the best, followed by random forest, multi-layer perceptron, and multiple linear regression. Relative errors for the calibration and validation periods were 23% and 98%, 21% and 109%, 37% and 75%, and 41% and 102%, respectively. The study results may provide some references for flood type simulation and countermeasures in the Huaihe River Basin.
湘江流域TRMM卫星降水产品降尺度研究与应用
[J].
Downscaling of TRMM precipitation products and its application in Xiangjiang River Basin
[J].
GPM卫星降水产品空间降尺度研究——以贵州省为例
[J].
Spatial downscaling of GPM precipitation products:A case study of Guizhou Province
[J].
The first comparisons of IMERG and the downscaled results based on IMERG in hydrological utility over the Ganjiang River Basin
[J].
基于改进的湿润地区站点与卫星降雨数据融合的洪水预报精度分析
[J].
Accuracy analysis of flood forecasting based on the fusion data of satellite and guage rainfalls in humid region
[J].
气候与土地利用变化对汉江流域径流的影响
[J].
DOI:10.11821/dlxb202011003
[本文引用: 1]
作为联结大气圈和地圈的纽带,水文循环同时承受气候变化和土地利用/覆被变化(LUCC)的双重影响,然而大多数的水文响应研究主要关注未来气候变化对径流的影响,忽略了未来LUCC的作用。因此,本文的研究目的是评估未来气候变化和LUCC对径流的共同影响。首先采用2种全球气候模式(BCC-CSM1.1和BNU-ESM)输出,基于DBC降尺度模型得到未来气候变化情景;然后,利用CA-Markov模型预测未来LUCC情景;最后,通过设置不同的气候和LUCC情景组合,采用SWAT模型模拟汉江流域的未来径流过程,定量评估气候变化和LUCC对径流的影响。结果表明:① 未来时期汉江流域的年降水量、日最高、最低气温相较于基准期(1966—2005年),在RCP 4.5和RCP 8.5浓度路径下,分别增加4.0%、1.8 ℃、1.6 ℃和3.7%、2.5 ℃、2.3 ℃;② 2010—2050年间,流域内林地和建设用地的面积占比将分别增加2.8%和1.2%,而耕地和草地面积占比将分别减少1.5%和2.5%;③ 与单一气候变化或LUCC情景相比,气候变化和LUCC共同影响下的径流变化幅度最大,在RCP 4.5和RCP 8.5浓度路径下未来时期年平均径流分别增加5.10%、2.67%,且气候变化对径流的影响显著大于LUCC。本文的研究结果将有助于维护未来气候变化和LUCC共同影响下汉江流域的水资源规划与管理。
Impacts of climate and land use/cover changes on runoff in the Hanjiang River basin
[J].
DOI:10.11821/dlxb202011003
[本文引用: 1]
As a link between the atmosphere and the geosphere, the hydrological cycle is affected by both climate change and Land Use/Cover Change (LUCC). However, most existing research on runoff response focused mainly on the impact of the projected climate variation, neglecting the influence of future LUCC variability. Therefore, the objective of this study is to examine the co-impacts of both projected climate change and LUCC on runoff generation. Firstly, the future climate scenarios under BCC-CSM1.1 and BNU-ESM are both downscaled and corrected by the Daily Bias Correction (DBC) model. Secondly, the LUCC scenarios are predicted based on the Cellular Automaton-Markov (CA-Markov) model. Finally, the Soil and Water Assessment Tool (SWAT) model is used to simulate the hydrological process under different combinations of climate and LUCC scenarios, with the attempt to quantitatively evaluate the impacts of climate change and LUCC on runoff generation. In this study, the Hanjiang River basin is used as the case study area. The results show that: (1) compared with the base period (1966-2005), the annual rainfall, daily maximum and minimum air temperatures during 2021-2060 will have an increase of 4.0%, 1.8 ℃, 1.6 ℃ in RCP4.5 scenario, respectively, while 3.7%, 2.5 ℃, 2.3 ℃ in RCP8.5 scenario, respectively. (2) During 2010-2050, the area proportions of forest land and construction land in the study area will increase by 2.8% and 1.2%, respectively, while those of farmland and grassland will decrease by 1.5% and 2.5%, respectively. (3) Compared with the single climate change or LUCC scenario, the variation range of future runoff under both climate and LUCC is the largest, and the influence of climate change on future runoff is significantly greater than that of LUCC. This study is helpful to maintain the future water resources planning and management of the Hanjiang River basin under future climate and LUCC scenarios.
IMERG卫星降水产品融合校准及其水文效用
[J].
Fusion Calibration of precipitation data by IMERG satellite and its hydrological applicability
[J].
Optimally integrating multi-source products for improving long series precipitation precision by using machine learning methods
[J].
Application of HEC-HMS parameter regionalization in small watershed of hilly area
[J].
Performance assessment of SWAT and HEC-HMS model for runoff simulation of Toba watershed,Ethiopia
[J].
基于HEC-HMS模型的温榆河流域水文模拟
[J].
Hydrological simulation of Wenyu River Basin based on HEC-HMS model
[J].
Hybrid approach for flood susceptibility assessment in a flood-prone mountainous catchment in China
[J].
基于TRMM数据的鄱阳湖流域降雨时空分布特征及其精度评价
[J].
Spatio-temporal distribution of precipitation in Poyang Lake basin based on TRMM data and precision evaluation
[J].
DOI:10.11820/dlkxjz.2012.09.007
[本文引用: 1]
Based on the precipitation data of Poyang lake basin based on TRMM (tropical rainfall measuring mission) satellite 3B42 V6 during 1998-2007, this paper studies the spatio-temporal distribution of precipitation. And the precisions of TRMM data are evaluated for different sub-basins, rainfall intensities and seasons through the observation rainfall data obtained from 40 weather stations, which fills in a gap in the previous studies. The results show that the heavy rain events generally occur in the northern part of Poyang lake basin (Xiushui and Raohe sub-basins) based on TRMM and observation data, which can cause signal attenuation of radar and make a large error for TRMM. The class of 10~50 mm makes the greatest contribution to the total rainfall, accounting for about 60%. The temporal distribution of precipitation in the lake basin shows that there is a dry spell from January to mid-March and a wet spell from late March to September, and another dry spell is observed after September. The spatial distribution presents that more rainfall is observed in the eastern and western parts of the basin than in the central parts. It is also found that the rainfall is 300~400 mm less than observed data in the mountainous areas of southern Jiangxi province, which may be affected by elevation and gradient of landform. So, there is a limitation for TRMM to measure the heavy rain events and the rainfall in mountainous areas.
鄱阳湖流域水文连通性的影响因素和环境效应
[J].
Influential factors and environmental effects of hydrological connectivity in the Poyang Lake catchment
[J].
鄱阳湖流域生态环境动态评估及驱动因子分析
[J].
Dynamic monitoring and driving factors analysis of ecological environment quality in Poyang Lake basin
[J].
中国月度植被指数(NDVI)空间分布数据集
[EB/OL].
Monthly vegetation index spatial distribution dataset of China
[EB/OL].
MODIS/Terra Vegetation Indices Monthly L3 Global 1km SIN Grid V006
[EB/OL].
海表温度的增暖趋势和自然变率对长江中下游夏季极端降水强度的影响
[J].
Impacts of the SST warming trend and natural variability on the summer extreme precipitation intensity of the middle and lower reaches of the Yangtze River
[J].
中国东部降水中大尺度环流和局地陆-气相互作用的贡献:河南“21·7”强降水事件特征影响因子探究
[J].
Contributions of large-scale circulation and local land-atmosphere interaction to precipitation in eastern China:Investigation on influencing factors of the July 2021 heavy precipitation event in Henan Province
[J].
夏季怒江流域水汽输送多支特征及对降水影响
[J].
DOI:10.11821/dlxb202301006
[本文引用: 1]
基于高空间分辨率0.25°的ERA-Interim再分析资料、TRMM 3B43 Version7数据、气象站点实测数据等多源数据,本文采用一种新的流域边界水汽通量概化和提取方法,揭示了夏季怒江流域水汽输送多支特征,并分析了其对降水时空分异的影响。研究表明,在高黎贡山南部、北部,伯舒拉岭北部及念青唐古拉山中部,有4支区域性水汽输送高值区,多年平均输送通量分别达102.6 kg/(m·s)、66.3 kg/(m·s)、39.7 kg/(m·s)和41.3 kg/(m·s)。多支水汽输送不仅深刻影响流域水汽输送格局,而且对降水时空分异也有不同程度影响。年际变化上,中下游横断山区水汽输送对降水的影响较小,上游青藏高原区影响较大,尤其以那曲—比如—索县一带影响最为显著。空间分布上,流域降水与水汽输送通量呈显著正相关,受多支水汽输送影响形成多个区域性多雨带。
Multiple branches of water vapor transport over the Nujiang River Basin in summer and its impact on precipitation
[J].
DOI:10.11821/dlxb202301006
[本文引用: 1]
Water vapor transport is a key factor in the transformation of atmospheric water resources to terrestrial water resources. In order to reveal the characteristics of water vapor transport and its influence on precipitation over the Nujiang River basin, high spatial resolution (0.25°) ERA-Interim reanalysis data, TRMM 3B43 Version7 data, meteorological station measured data and SRTM Version4.1 DEM data were used, and a new method to generalize and extract water vapor transport data along the watershed boundary was adopted. Through analysis and research, the multiple branches water vapor transports over the Nujiang River Basin in summer were detected, and their effects on the spatiotemporal distribution of precipitation were analyzed. The research shows that there are four regional high-value areas of water vapor transport on the western boundary of the watershed, which are located in the southern and northern parts of Gaoligong Mountain, the northern part of Boshula Mountain, and the middle of Nyenchen Tanglha Mountains, with the annual average water vapor flux being 102.6 kg/(m·s), 66.3 kg/(m·s), 39.7 kg/(m·s), and 41.3 kg/(m·s), respectively. Multiple branches water vapor transport affects not only the water vapor transport in different areas of the basin, but also the spatiotemporal characteristics of precipitation. In terms of interannual variation, the influence of water vapor transport on precipitation is weaker in the middle and downstream area (Hengduan Mountains), while it is greater in the upstream area (Qinghai-Tibet Plateau), especially in the Nagqu-Biru-Suoxian area. In terms of spatial distribution, annual precipitation in the basin is significantly positively correlated with water vapor flux and negatively correlated with water vapor flux divergence. Because of multiple branches of water vapor transport, four regional rainy areas are formed by the west side of the basin.
Reconstructing high-resolution gridded precipitation data using an improved downscaling approach over the high altitude mountain regions of Upper Indus basin (UIB)
[J].
基于深度学习的闽浙赣GPM降水产品降尺度方法
[J].
Research on downscaling of GPM precipitation products based on deep learning in Fujian-Zhejiang-Jiangxi
[J].
古尔班通古特沙漠SMAP土壤水分产品降尺度分析
[J].
DOI:10.13866/j.azr.2023.04.07
[本文引用: 1]
SMAP(Soil Moisture Active Passive,SMAP)产品空间分辨率低的特征限制了在地表高异质性的干旱区沙漠稀疏植被区的适用性。考虑到干旱区沙漠植被区特殊的环境特征,在地表温度(Land Surface Temperature,LST)、归一化植被指数(Normalized Difference Vegetation Index,NDVI)、数字高程模型(Digital Elevation Model,DEM)等传统降尺度因子的基础上,增加了与荒漠地表土壤水分关联性更强的增强型修改土壤植被指数(Enhanced Modified Soil-Adjusted Vegetation Index,EMSAVI)与比值沙地亮度指数(Ratio Sand Brightness Index,RSBI)分别作为反映研究区植被盖度和裸沙分布状况的降尺度因子,利用随机森林算法(Random Forest,RF),构建了干旱区土壤水分降尺度模型。结果表明:(1) 由相关性分析可知,EMSAVI(r<sub>干</sub>=-0.37,r<sub>湿</sub>=-0.34)、RSBI(r<sub>干</sub>=-0.42,r<sub>湿</sub>=-0.25)对荒漠土壤水分均有较好的指示作用且效果优于NDVI(r<sub>干</sub>=-0.21,r<sub>湿</sub>=0.08);(2) EMSAVI和NDVI重要性分别为18.7%、13.2%,EMSAVI在构建降尺度模型时贡献度更高。(3) 构建的干、湿季干旱区土壤水分降尺度模型得到的结果与SMAP产品的R<sup>2</sup>分别达到了0.916,0.910,RMSE分别达到了0.0075 cm<sup>3</sup>·cm<sup>-3</sup>、0.0063 cm<sup>3</sup>·cm<sup>-3</sup>,较传统模型的RMSE均降低了0.0013 cm<sup>3</sup>·cm<sup>-3</sup>。(4) 通过计算LBP(Local Binary Patterns)的差值(LBP<sub>C</sub>)对空间一致性评价,新构建降尺度模型的结果(0.0585)优于传统降尺度(0.0645)。研究结果将短波红外波段引入到植被指数建立的EMSAVI,可较好地应用于干旱区沙漠稀疏植被区土壤水分降尺度研究。
Downscaling analysis of SMAP soil moisture products in Gurbantunggut Desert
[J].
DOI:10.13866/j.azr.2023.04.07
[本文引用: 1]
The low spatial resolution of SMAP products limits its applicability to sparsely vegetated arid regions and deserts with high surface heterogeneity. Considering the special environmental characteristics of sparsely vegetated desert areas in arid regions, traditional downscaling methods such as land surface temperature (LST), normalized difference vegetation index (NDVI), and digital elevation model (DEM) have been used, among others. Based on the scale factor, the enhanced modified soil-adjusted vegetation index (Enhanced Modified Soil-Adjusted Vegetation Index, EMSAVI) and the ratio sand brightness index (RSBI), which are more correlated with the desert surface soil moisture, were added to reflect the study area. For the downscaling factors of vegetation coverage and bare sand distribution, the random forest (RF) algorithm was used to build a soil moisture downscaling model in arid areas. The results showed the following: (1) Correlation analysis showed that EMSAVI (rdry = -0.37, rwet = -0.34) and RSBI (rdry = -0.42, rwet = -0.25) were good indicators of desert soil moisture, being superior to NDVI (rdry = -0.21, rwet = 0.08). (2) The importance of EMSAVI and NDVI was 18.7% and 13.2%, respectively, and EMSAVI contributed more to the construction of the downscaling model. (3) The results obtained from the soil moisture downscaling model in dry and wet season arid regions and R2 of the SMAP product reached 0.916 and 0.910, and the RMSE reached 0.0075 cm3·cm-3 and 0.0063 cm3·cm-3, respectively, which are lower than the RMSE of the traditional model of 0.0013 cm3·cm-3. (4) By calculating the difference (LBPC) of LBP (local binary patterns) to evaluate the spatial consistency, the result of the newly constructed downscaling model (0.0585) was better than that of traditional downscaling (0.0645). This research shows that introduction of the short-wave infrared band into the EMSAVI established by the vegetation index enables its better application to the study of soil moisture downscaling in sparsely vegetated desert areas in arid regions.
基于随机森林模型的黄河流域城市建设用地结构时空演化及其驱动机制研究
[J].
DOI:10.18306/dlkxjz.2023.01.002
[本文引用: 1]
城市是区域人口、产业等要素集聚的主要空间载体,系统揭示黄河流域城市建设用地结构演化及其驱动机制对于深入推进黄河流域生态保护和高质量发展战略落实具有重要意义。基于黄河流域2007—2019年城市建设用地数据,论文运用信息熵模型分析了黄河流域城市建设用地结构的时空演化特征,并用随机森林模型探讨其驱动机制。结果表明:① 2007—2019年,黄河流域城市建设用地面积快速增长,年均增速达5.34%,但城市建设用地结构信息熵不断降低,经历了“高位无序—相对稳定—低位有序”的变化过程;② 黄河上、中、下游城市建设用地规模增速依次加大,年均增速分别达到3.91%、5.06%、6.22%;中游地区城市建设用地结构信息熵下降最多,上游地区和下游地区降幅相近;③ 黄河流域各类建设用地主要配置在省会及经济发达城市;黄河流域城市用地结构信息熵存在空间异质性,省会城市及经济发达城市建设用地结构信息熵存在降低趋势,而欠发达城市的信息熵逐步增大;④ 城市用地规模和城市人口规模对城市建设用地结构演化的作用最强,产业结构升级和财政支出规模的作用强度次之,经济发展水平和政策支持力度的作用较小,上中下游影响因子的作用强度存在异质性;⑤ 城市用地规模、城市人口规模、财政支出规模与城市建设用地结构信息熵呈正向变动关系,经济发展水平和产业结构升级与城市建设用地结构信息熵呈负向变动关系,政策支持力度则与城市建设用地结构信息熵呈现出“倒U”型关系。
Spatiotemporal changes of urban construction land structure and driving mechanism in the Yellow River Basin based on random forest model
[J].
DOI:10.18306/dlkxjz.2023.01.002
[本文引用: 1]
Cities are the main spatial carriers for the agglomeration of regional population, industry and other factors, and systematically revealing the evolution of urban construction land structure and its driving mechanism is of great significance for further promoting the implementation of ecological conservation and high-quality development strategy of the Yellow River Basin. Based on the urban construction land data of the Yellow River Basin from 2007 to 2019, the spatiotemporal change characteristics and differentiation patterns of the construction land structure in the basin were analyzed by using the information entropy model, and the formation mechanism of the driving factors was examined by using the random forest model. The results show that: 1) From 2007 to 2019, the area of urban construction land in the Yellow River Basin continued to grow, with an average annual growth rate of 5.34%, but the information entropy of urban construction land structure decreased, and experienced a change process of high-level disorder, relatively stable, and low-level orderly. 2) The growth rate of urban construction land use in the upper, middle, and lower reaches of the Yellow River increased successively, with the annual growth rate reaching 3.91%, 5.06% and 6.22% respectively. The information entropy of urban construction land use structure in the middle reaches of the Yellow River decreased the most, and the decline rates in the upper reaches and lower reaches were similar. 3) All types of construction land in the basin are mainly distributed in provincial capitals and cities in economically developed areas, and there is a clear spatial heterogeneity in the information entropy of urban construction land use structure in the region. The information entropy of urban construction land use structure in provincial capital cities and economically developed cities showed a decreasing trend, while the information entropy of less developed cities gradually increased. 4) The scale of urban land use and the size of urban population have the strongest effect on the change of urban construction land use structure, followed by the intensity of industrial structure upgrading and scale of fiscal expenditure. The role of economic development level and policy support is small, and the intensity of impact of upstream, middle reaches, and downstream influencing factors is heterogeneous. 5) The scale of urban land use, the size of urban population, and the scale of fiscal expenditure showed a positive change relationship with the information entropy of urban construction land use structure, the level of economic development and industrial structure upgrading showed a negative change relationship with the information entropy of urban construction land use structure, and the policy support showed an inverted U-shaped change relationship with the information entropy of urban construction land use structure.
城市地表温度空间降尺度研究——以北京市为例
[J].
Land surface temperature downscaling in urban area:A case study of Beijing
[J].
全球降水计划IMERG和GSMaP反演降水在四川地区的精度评估
[J].
DOI:10.11821/dlxb201907003
[本文引用: 1]
IMERG和GSMaP是全球降水计划(GPM)时代最主要的高分辨率降水产品。为研究其在中国四川地区的适用性,以中国气象局提供的自动气象站融合降水数据为参考基准,采用6种统计指数分析了IMERG(IMERG_Uncal, IMERG_Cal)和GSMaP(GSMaP_MVK, GSMaP_Gauge)系列产品在四川的误差特征。结果表明:① 在日和小时尺度上,GSMaP系列产品均高估地面降水观测,GSMaP_MVK高估最显著,校正产品GSMaP_Gauge的相关系数(CC)、相对偏差(BIAS)和均方根误差(RMSE)较GSMaP_MVK均有较大提高,尤其对川西高原降水的高估现象改善明显,而IMERG_Uncal存在低估川西高原降水、轻微高估四川盆地降水的问题,校正产品IMERG_Cal一定程度上降低了对川西高原降水的低估现象,但整体精度(CC, RMSE)提高不明显。② IMERG系列产品对降水事件的探测准确性更好,GSMaP_Gauge虽然在四川表现出较高的命中率(POD),但存在较多的误报降水,在盆地和四川南部各产品均表现出较高的POD和关键成功指数(CSI)以及低误报率(FAR),而四川西北部表现最差,尤其是在无自动站分布地区。③ 4套降水产品中,IMERG_Cal表现出最好的探测强降水和弱降水的能力,具有一定的监测极端降水的潜力。总体上,IMERG和GSMaP在盆地的反演精度优于高原山区,校正产品精度优于纯卫星产品,不同地形地区精度差异明显,表明对卫星降水产品进行不同地形误差订正仍是未来降水反演工作的重点和难点。
Evaluation of the GPM-based IMERG and GSMaP precipitation estimates over the Sichuan region
[J].
DOI:10.11821/dlxb201907003
[本文引用: 1]
The Integrated Multi-satellitE Retrievals for GPM (IMERG) and Global Satellite Mapping of Precipitation (GSMaP) are two high precisely multi-satellite precipitation estimates in the GPM era. In order to evaluate the applicability of both IMERG and GSMaP series products (IMERG_Uncal and IMERG_Cal, GSMaP_MVK and GSMaP_Gauge) over the Sichuan region in China, six statistical indices are used to systematically analyze the error characteristics of these products, benchmarked by a set of ground-based dataset from China Meterological Administration (CMA). Results show that: (1) All products show the dramatic regional difference over Sichuan at both daily and hourly scales. The GSMaP series products overestimate precipitation and the most overestimations occur over the high altitude areas located in the Western Sichuan. GSMaP_Gauge shows relatively higher correlation coefficient and lower relative bias and root mean square error due to the employment of gauge-based adjustments. On the contrary, IMERG_Uncal shows underestimation over the mountainous areas, while the relatively slight overestimation appears in the basin area with lower elevation at both daily and hourly time scales, suggesting that gauge-calibrated dataset IMERG_Cal has effectively improved the relative bias in the mountainous areas but not in the flat basin area. (2) By synthesizing the three classified statistical indices, IMERG series products exhibit better potentials in detecting precipitation events. Although GSMaP_Gauge shows a higher hit rate of precipitation, it has more false alarm ratios of precipitation. All products show better hit rate and lower false alarm rate over basin area and southern Sichuan. Furthermore, it is found that the ground-based dataset has some errors in those areas without meteorological stations, which leads to the apparent uncertainty in assessing the accuracy of satellite precipitation products over the Northwest Sichuan Plateau. (3) IMERG_Cal performs better in capturing the rainfall amounts and events compared with other products, especially for the lowest and highest rainfall intensity ranges, demonstrating its application potential for monitoring the extreme weather events. Overall, both IMERG and GSMaP estimates have relatively high uncertainties over the mountainous areas than ones over the flat basin areas. Additionally, the gauge-calibrated products obviously outperform the uncalibrated datasets. On the basis of the findings, future efforts focus on reducing and correcting the errors and biases of satellite precipitation estimates by considering both spatio-temporal characteristics and the topographical information.
遥感降水产品在中国不同气候区的适用性研究
[J].
DOI:10.12082/dqxxkx.2021.200348
[本文引用: 1]
遥感降水产品相对于气象站观测数据能够更好地反映降水的空间分布特征,对其进行不同气候区上的差异性评价对数据产品选择和遥感降水反演算法改进均有重大意义。本文选择中国典型气候区(干旱区、过渡区、湿润区和青藏高原地区),以649个经偏差矫正后的气象站降水数据为标准,评估了5种国际常用的遥感降水产品 (CHIRPS v2.0, CMORPH v1.0, MSWEP v2.0, PERSIANN-CDR, TRMM 3B42v7) 在中国典型气候区的适用性。研究发现,各产品的性能存在空间差异性。MSWEP在各气候区的相关系数(CC),Kling-Gupta efficiency(KGE),均方根误差(RMSE)等基本统计性能指标均优于其他4种产品。相对偏差(BIAS)方面,在干旱区、湿润区、青藏高原、过渡区表现较优越的产品分别为MSWEP、CHIRPS、PERSIANN、TRMM。在评估遥感降水产品对降水事件发生概率的估算能力方面,选择了误报率(FAR,降水事件预报错误的比例)、命中率(POD,降水事件预报正确的比例)、关键成功指数(CSI,降水事件正确预报综合性能)、精度指数(ACC,等级预报综合性能)和降水等级概率分布(PDF)5个指标作为评估依据,结果表明,就POD,CSI和ACC而言,在各气候区MSWEP表现明显优于其他产品;对于FAR,TRMM和CMORPH产品在湿润区表现优越,其余气候区仍以MSWEP表现较为优越;就PDF而言,PERSIANN和MSWEP产品对1~20 mm的日降水量的估算偏高,特别是MSWEP在青藏高原和湿润区对小雨的估算频率明显偏高, MSWEP有待在该区提高频率预报的能力。综合而言,多源数据融合的MSWEP在各气候区的基本统计性能和降水等级性能较好,可作为可靠的降水数据源用于中国水文气象研究,同时也表明多源数据融合产品具有良好的应用前景。
Research on the applicability of remote sensing precipitation products in different climatic regions of China
[J].
基于HEC-HMS模型的山洪灾害临界雨量研究
[J].
Research on rainfall threshold of flash flood based on HEC-HMS model
[J].
Comparison of HEC-HMS hydrologic model for estimation of runoff computation techniques as a design input:Case of Middle Awash multi-purpose dam,Ethiopia
[J].
