

0 引言
当前,大范围森林AGB遥感估测主要是将遥感数据特征作为自变量,将森林AGB作为因变量建立回归估测模型(如线性、非线性模型,机器学习模型等),遥感特征来自单一或者多种数据源,但估测方法多为数据驱动确定最终模型,通常从大量特征中进行特征优选,再估测目标变量[5-
基于以上分析,本研究以内蒙古呼伦贝尔根河市实验林场为研究区,在前人研究的基础上,提出一种联合LiDAR估测高度特征、森林郁闭度以及星载多光谱植被指数的异速生长模型方法,充分利用LiDAR提供的高度特征、郁闭度和多光谱数据提供的光谱信息,并与仅利用高度信息、高度信息与植被指数联合、高度信息与森林郁闭度联合3种模型进行对比分析,验证其可行性,为森林资源监测提供技术参考。
1 研究区概况与数据源
1.1 研究区概况
本研究试验区位于内蒙古自治区呼伦贝尔市根河市(图1),该地区地势起伏平缓,相对高差在100~300 m之间。试验区总面积约110 km2,平均海拔在1 000 m以上,属于高纬度、高寒冷地区。气候为寒温带湿润型森林气候,兼具大陆季风性气候特征,空气湿润寒冷,冬季长夏季短,每年7—8月为多雨季节。日气温温差较大,无霜期平均为90 d,平均气温-5.4 °C,极端最低气温-55 °С,结冻期210 d以上,境内遍布永冻层。试验区植被以森林植被和草原植被为主,森林覆盖率高达75%,居内蒙古自治区之首。主要优势树种为兴安落叶松(Larixgmelinii)、白桦(Betula platyphylla)、樟子松(Pinus sylvestris var.mongholica Litv)以及山杨(Populus davidiana)等[23-
图1
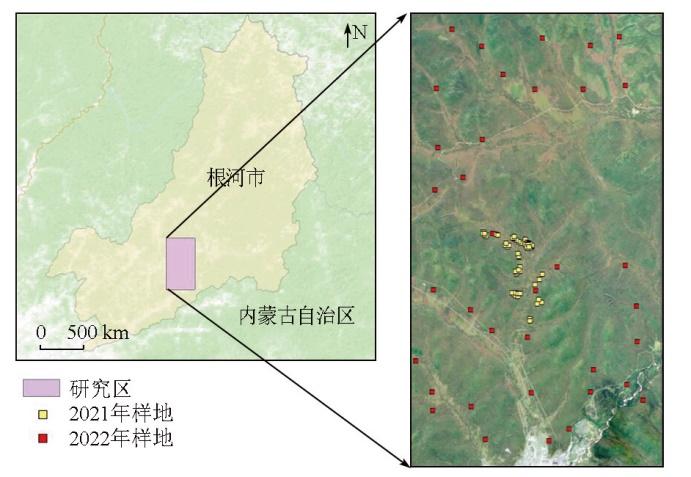
图1
研究区位置与样地分布示意图
Fig.1
Location of the study area and distribution of sample plots
1.2 数据源及其预处理
1.2.1 样地数据
2021年和2022年对试验区进行了样地调查,共获取样地108块(图1)。其中2021年60块,2022年48块,样地大小为25 m×25 m,对样地内胸径大于5 cm的树木进行每木检尺,测量胸径、树高、东西冠幅、南北冠幅及枝下高等参数,2 a数据中共有80块落叶松样地、14块白桦样地以及14块混交林。为减少后期遥感影像与样地位置偏差带来的影响,样地位置主要布设在范围较大且均匀的林分中心,样地4个角点位置及样地中心位置采用Zenith15R型GPS-RTK精确测量,测量精度优于0.15 m。样地优势树种类型包括落叶松和白桦等。然后根据周国逸等[26]提出的异速生长方程计算样地内每一个树种单木地上生物量,合计得到样地总生物量和生物量密度用于后续分析。从108块样地中随机抽取70%的样地数据用于训练,30%用于验证。样地的生物量范围为34.39~210.22 t/hm2,平均值、中值和标准差分别为98.72 t/hm2,91.78 t/hm2和39.58 t/hm2,偏度和峰度分别为0.58和-0.22,对该区域森林结构具有较好的代表性。试验区森林生长较为缓慢,因样地调查时差引起的森林样地AGB差异可以忽略不计。
1.2.2 机载激光雷达数据
LiDAR数据采集于2022年8月,使用CAF-LiCHy数据采集系统[27],其中LiDAR传感器型号为Riegl LMS-Q680i,原始LiDAR点云数据经姿态矫正、噪声点剔除、坐标转换、航带拼接、系统差改正等预处理后,利用LASTOOLS软件进行点云分类、去噪以及归一化等处理得到归一化植被点云数据。由于异速生长模型的物理意义明确,本研究采用Fusion软件[28]提取点云高度均值(mean)、森林郁闭度(canopy density)、高度最大值(maximum)以及高度百分位数(percentiles)等[29-30]用于后续分析,特征详细信息见表1。为与样地大小保持一致,将研究区按25 m×25 m统计单元分割,并统计每个统计单元内各个特征的均值用于后续分析。
表1 LiDAR数据特征
Tab.1
| LiDAR特征名称 | 特征符号 | 描述 |
|---|---|---|
| 均值 | Hmean | 25 m×25 m统计单元内点云高度均值 |
| 森林郁闭度 | CD | 25 m×25 m统计单元内冠层回波点云与全部回波点云的比值 |
| 最大值 | Hmax | 25 m×25 m统计单元内点云高度最大值 |
| 百分位数 | H10,H20,…,H90,H95 | 不同高度点云百分位数 |
1.2.3 卫星数据
卫星数据采用哨兵2A(Sentinel-2A)多光谱数据,数据来自 Copernicus Open Access Hub 网站(https://scihub.copernicus.eu/),需要2景才能对试验区实现全覆盖。受云雨天气影响,无法获取与地面样地数据获取时间完全同步的影像,因此获取了可用的与其时间相近的生长季影像,时间为2022年7月8日。利用欧洲空间局提供的开源SNAP软件(https://earth.esa.int/eogateway/tools/snap)对每景数据进行了辐射定标、大气校正和正射校正等预处理,经以上处理后的哨兵2A数据的像元大小设为25 m×25 m(和样地大小一致); 然后对这2景预处理后的数据进行镶嵌处理,进而裁切得到覆盖整个试验区的多光谱遥感数据。
本文选择了几种常用的植被指数,包括NDVI[18]、2种红边植被指数(red-edged normalized difference vegetation index,NDVIre1和NDVIre2)[31]、差值植被指数(difference vegetation index,DVI)[32]、增强植被指数(enhanced vegetation index,EVI)[33]、比值植被指数(ratio vegetation index,RVI)[34]及土壤调节植被指数(soil adjusted vegetation index,SAVI)[35]。另外,增加了一种新的植被指数——核函数归一化植被指数(kernel normalized difference vegetation index,KNDVI),该指数是采用核函数思想变换而来,已有研究显示,该指数可明显提高森林碳储量的估测精度[36]。利用相同的方法计算了NDVIre1和NDVIre2对应的核函数变换后的植被指数KNDVIre1和KNDVIre2。本文将核函数变换后的KNDVI,KNDVIre1和KNDVIre2统称为核函数植被指数。
2 研究方法
2.1 特征与AGB相关性分析
选用皮尔逊相关系数作为评价指标,对比分析LiDAR点云数据提取的高度特征、森林郁闭度以及哨兵2A多光谱数据计算的植被指数与森林AGB之间的相关关系,选择最优高度特征和植被指数特征用于后续分析[37]。
2.2 模型与优化
式中: a,b,aY,bY,aHC,bHC,aN和bN为模型参数; B为森林AGB; H为LiDAR数据提取的高度特征; VI为植被指数; CD为森林郁闭度; ρ,ρY,ρHC和ρN为对数变换后模型的随机残差项。
2.3 模型精度评价
选用调整决定系数
式中:
2.4 像元不确定性估测
式中:
式中:
残差不确定性估计参考McRoberts等[42]提出的方法,公式为:
式中: p和q为模型参数;
3 结果与分析
3.1 特征与森林AGB相关性分析
为了确定最优高度特征和植被指数,对候选特征与森林AGB的相关关系进行统计学检验,并将相关性划分为弱、中和强[45]。从表2可以看出,LiDAR高度特征与森林AGB均具有很强的相关性,其中,H90与H95高度分位数与森林AGB相关性较强,均在0.850以上,H90与森林AGB的相关性最强,相关系数达到0.860。LiDAR数据计算的森林郁闭度CD与森林AGB的相关系数可达0.452。所选的植被指数中,核函数植被指数与森林AGB的相关性明显强于原指数。除了核函数植被指数外,红边植被指数NDVIre1和NDVIre2与森林AGB的相关性明显强于其他指数,主要原因是这2种植被指数中包含了对绿色植被更加敏感的红边波段[46],其中NDVIre1的相关性较高,可达到0.435; 所有植被指数中,KNDVIre1与森林AGB相关性最强,达到0.483。
表2 特征与森林AGB相关系数
Tab.2
| LiDAR | 哨兵2A | ||
|---|---|---|---|
| 特征 | 相关性 | 特征 | 相关性 |
| H10 | 0.553***① | NDVI | 0.276** |
| H20 | 0.548*** | NDVIre1 | 0.435*** |
| H30 | 0.682*** | NDVIre2 | 0.389*** |
| H40 | 0.704*** | KNDVI | 0.347*** |
| H50 | 0.731*** | KNDVIre1 | 0.483*** |
| H60 | 0.762*** | KNDVIre2 | 0.427*** |
| H70 | 0.806*** | DVI | 0.137* |
| H80 | 0.839*** | EVI | 0.243* |
| H90 | 0.860*** | RVI | 0.269** |
| H95 | 0.851*** | SAVI | 0.276** |
| Hmean | 0.816*** | ||
| Hmax | 0.747*** | ||
| CD | 0.452*** | ||
①*为p<0.05; **为p<0.01; ***为p<0.001。
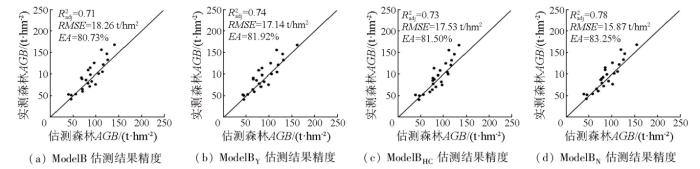
3.2 不同模型对比与精度评价
将相关性最高的H90和KNDVIre1特征应用于模型中,4种模型参数拟合结果见表3。从图2可以看出,ModelB估测结果精度
图2
3.3 不同模型像元尺度不确定性估测结果
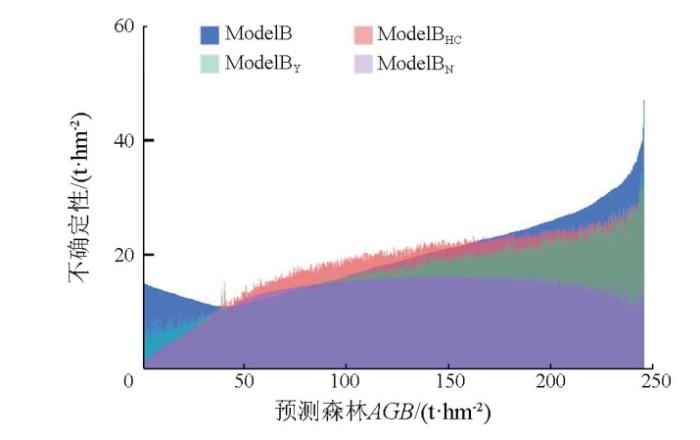
各个模型估测结果与其不确定性空间分布情况见图3,由结果可以看出4种方法森林AGB估测结果趋势基本一致,不确定性空间分布虽有差异,但本文方法的不确定性总体上低于其他3种方法。对研究区所有像元预测结果的不确定性统计分析发现,ModelB模型的不确定性范围为13.42~47.58 t/hm2,ModelBY模型不确定性范围为6.67~45.38 t/hm2,ModelBHC模型不确定性范围为0.53~41.18 t/hm2,ModelBN模型不确定性范围为0.21~18.55 t/hm2。为了进一步评价模型表现,对不同模型像元尺度不确定性变化规律进行分析,采取随机抽样的方式随机抽取3 000个点进行分析,保证抽样数据的代表性,为了避免非森林区域的影响,抽样范围限制在CHM>2.5 m的区域。从图4可以看出,随着森林AGB的增加,ModelBN不确定性先增大后减小,ModelBY和ModelBHC的不确定性不断增大,而ModelB模型不确定性先减小后增大。当森林AGB>160 t/hm2时,模型不确定性由高到低为ModelB,ModelBHC,ModelBY,ModelBN; 当森林AGB在[90,160] t/hm2时,模型不确定性由高到低为ModelBHC,ModelB,ModelBY,ModelBN; 当森林AGB<90 t/hm2时,ModelBN模型不确定性并不总是最低,ModelBHC和ModelBY模型不确定性也并不总是低于ModelB; 虽然ModelBY模型不确定性范围比ModelBHC宽,但ModelBY估测结果不确定性整体上低于ModelBHC; ModelB估测结果不确定性整体上高于其他3个模型(图4)。综合来看,模型不确定性整体趋势由高到低为ModelB,ModelBHC,ModelBY和ModelBN,本文提出的模型整体最优。
图3-1
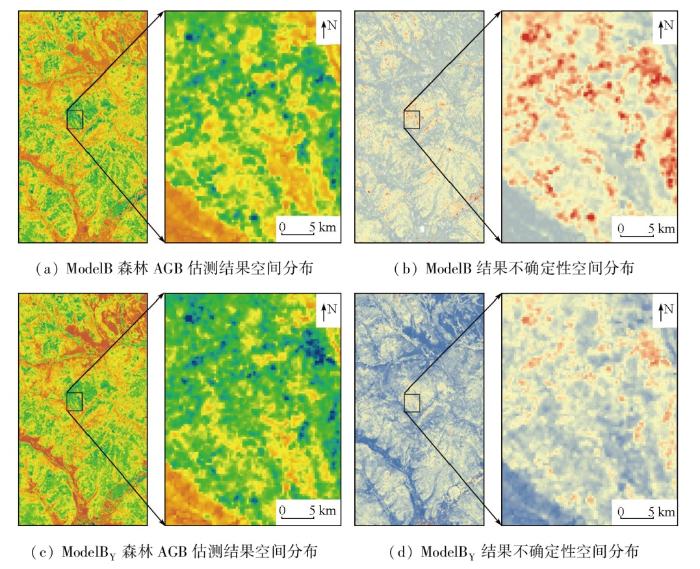
图3-1
不同模型森林AGB估测结果与不确定性空间分布
Fig.3-1
Spatial distribution of forest AGB estimation results and uncertainty on different methods
图3-2
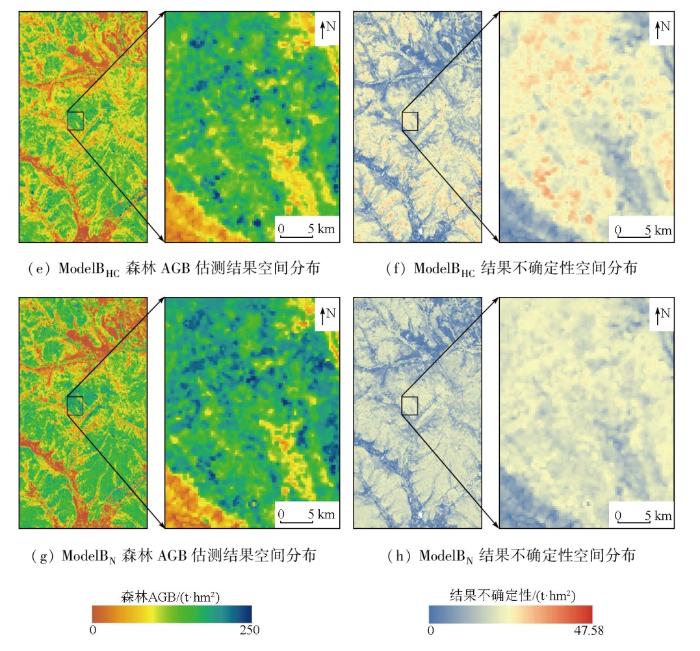
图3-2
不同模型森林AGB估测结果与不确定性空间分布
Fig.3-2
Spatial distribution of forest AGB estimation results and uncertainty on different methods
图4
4 讨论
LiDAR高度特征与森林AGB有很强的相关性,但以往研究显示最优的LiDAR高度特征与所用数据和研究区域有关,如有研究显示H60和H50点云高度分位数与森林AGB相关性最高[47-48],也有研究显示H90与森林AGB相关性最高[49],最常用的LiDAR高度特征为冠层平均高[50],本研究中,H90与研究区森林AGB的相关性最高(表2),因此LiDAR数据的实际应用中,仍需要对所用数据进行分析,确定最优高度特征。通过对比不同植被指数与森林AGB相关性发现,Camps-Valls等[36]提出的核函数植被指数特征与森林AGB的相关性优于其他植被指数,主要原因为该指数可在一定程度上改善森林AGB估测中饱和效应和非植被背景的影响,因此核函数植被指数可作为森林AGB估测的首选植被指数。然而,植被指数与森林AGB的相关性明显低于LiDAR高度特征,若单独利用植被指数估测全覆盖森林AGB,结果精度可能很难满足实际应用[51],但植被指数可很好地反映植被群落结构的平均生长状态[52],基于此,Yang等[20]提出了以森林LiDAR高度信息为底,植被指数作为指数幂的森林AGB估测异速生长模型方法,本研究对该方法进行了测试,结果精度优于仅利用LiDAR高度特征的模型估测结果(图2(a)与图2(b)),与Yang等的结果一致。通过对比发现,高度特征和森林郁闭度相结合的异速生长模型估测结果精度优于仅利用高度特征的模型方法(图2(a)与图2(c)),在此基础上,将植被指数作为指数幂,模型估测结果精度优于其他3种模型(图2(d)),再次说明了植被指数作为指数幂的可行性。
虽然本研究提出的森林AGB估测方法可以提高估测精度,但从像元不确定性变化来看,并不是在所有森林AGB范围都为最优(图4),主要原因可能为研究所用的哨兵2A数据时相为7月份,而不同植被类型的生长模式不同,代表最佳生长状态的植被指数可能出现在不同时相,这也是大量学者在应用植被指数时,采用多时相最大值合成的原因[52-53],因此,未来将针对不同时相的植被指数对模型的影响进行深入研究。另外,本研究提出的方法中森林郁闭度也是一个重要的参数,之所以采用LiDAR数据提取森林郁闭度,主要是因为与光学或SAR等数据相比,LiDAR提取的森林郁闭度精度更高[54-55]。但激光雷达点云数据受扫描角度和点云密度等因素影响较大,在一定程度上会影响森林郁闭度的估测精度,进而对森林AGB估测产生一定的影响,这些因素如何影响本研究提出的模型可能是复杂的,也有待将来进一步研究。综合来看,本文提出的方法模型简单,且具有一定物理意义,可为森林AGB估测提供一种新的选择。
5 结论
研究提出了一种联合LiDAR高度特征、森林郁闭度以及星载多光谱植被指数的异速生长模型构建方法,并与已有的3种模型进行了对比,分析了LiDAR高度特征和星载多光谱植被指数与森林AGB相关性,得出以下结论:
1)LiDAR高度特征与森林AGB强相关,本研究中H90与森林AGB相关性最高; 与常用的植被指数相比,核函数植被指数更适用于森林AGB估测。
2)植被指数作为指数幂可提高森林AGB估测精度,联合LiDAR高度特征、森林郁闭度以及植被指数的森林AGB估测异速生长模型方法是可行的,可改善森林AGB的估测精度。
参考文献
The BIOMASS mission:Mapping global forest biomass to better understand the terrestrial carbon cycle
[J].
Comparing echo-based and canopy height model-based metrics for enhancing estimation of forest aboveground biomass in a model-assisted framework
[J].
大兴安岭东部主要林分类型乔木层生物量估算模型
[J].
DOI:10.13287/j.1001-9332.201809.014
[本文引用: 1]

大尺度森林生物量的估算方法是人们目前关注的焦点,建立林分生物量模型成为一种趋势.本研究以大兴安岭东部6个主要林分类型为研究对象,构建了其总量及各分项一元、二元可加性林分生物量模型.采用似然分析法判断总量及各分项生物量异速生长模型的误差结构(可加型或相乘型),采用非线性似乎不相关回归模型方法估计模型参数.结果表明: 经似然分析法判断,大兴安岭东部6个主要林分类型总量及各分项生物量异速生长模型的误差结构都是相乘型的,对数转换的可加性生物量可以被选用.各林分类型可加性生物量模型的调整后确定系数为0.78~0.99,平均相对误差为-2.3%~6.9%,平均相对误差绝对值6.3%~43.3%.增加林分平均高可以提高绝大多数生物量模型的拟合效果和预测能力,而且总量、地上和树干生物量模型效果较好,树根、树枝、树叶和树冠生物量模型效果较差.为了使模型参数估计更有效,所建立的生物量模型应当考虑林分总生物量及各分项生物量的可加性.本研究建立的林分总量与各分项生物量模型都能对大兴安岭东部6个主要林分类型生物量进行较好的估计.
Stand-level biomass estimation models for the tree layer of main forest types in East Daxing’an Mountains,China
[J].
DOI:10.13287/j.1001-9332.201809.014
[本文引用: 1]
Forest biomass estimation methods of regional scale attract most attention of the resear-chers, with developing stand-level biomass model being a research trend. Based on the biomass data from fix forest types, two additive systems of biomass equations based one- and two-variable were developed. The model error structure (additive vs. multiplicative) of the allometric equation was evaluated using the likelihood analysis. The nonlinear seemingly unrelated regression (NSUR) was used to estimate the parameters in the additive system of stand-level biomass equations. The results showed that the assumption of multiplicative error structure was strongly supported for the stand-level biomass equations of total and components for those forest types. Thus, the additive system of log-transformed biomass equations was developed. The adjusted coefficient of determination of the additive system of biomass equations was 0.78-0.99, the mean relative error was between -2.3%-6.9%, and the mean absolute relative error was between 6.3%-43.3%. Adding mean tree height in the additive systems of biomass equations could significantly improve the model fitting performance and predicting precision for most of the models. The biomass equations of total, aboveground and stem were better than biomass equations of root, branch, foliage and crown. In order to estimate model parameters more effectively, the additivity property of estimating tree total, sub-totals, and component biomass should be taken into account. Overall, the stand-level biomass models established in this study would be suitable for predicting stand-level biomass of six forest types in Daxing’an mountains.
森林地上生物量遥感估测研究进展
[J].
Advances in the estimation of above-ground biomass of forest using remote sensing
[J].
Combining LiDAR and hyperspectral data for aboveground biomass modeling in the Brazilian Amazon using different regression algorithms
[J].
Forest biomass estimation from airborne LiDAR data using machine learning approaches
[J].
基于Sentinel-1和Sentinel-2数据的杉木林地上生物量估算
[J].
DOI:10.3969/j.issn.1000-2006.201811012
[本文引用: 1]
目的雷达和光学遥感数据可以提供不同方面的信息,利用Sentinel?1与Sentinel?2联合估算亚热带地区森林地上生物量,探索光学数据与合成孔径雷达(SAR)数据结合对于提高森林地上生物量估测的优势。方法以福建省将乐国有林场杉木林为研究对象,以Sentinel?1 SAR数据和Sentinel?2光学数据为数据源,采用多元线性逐步回归方法进行建模,以决定系数(R2)、调整决定系数(R2<sub>adj</sub>)、均方根误差(RMSE)、方差膨胀因子(VIF)为模型评价指标,对比分析Sentinel?2光学数据与Sentinel?2结合Sentinel?1 SAR数据估算森林地上生物量的能力。结果基于Sentinel?2光学数据的森林地上生物量估算模型,其调整决定系数(R2<sub>adj</sub>)达到0.501、均方根误差(RMSE)为64.04 Mg/hm<sup>2</sup>;Sentinel?2光学数据结合Sentinel?1 SAR数据的森林地上生物量估算模型,其调整决定系数(R2<sub>adj</sub>)达到0.575、均方根误差(RMSE)为59.13 Mg/hm<sup>2</sup>,对比Sentinel?2估算模型,该模型精度有明显提高。结论Sentinel?2卫星的多光谱数据能够作为估算亚热带地区森林地上生物量的有效数据,加入Sentinel?1 SAR影像的极化纹理信息后,利用Sentinel?1雷达传感器的全天候获取数据能力与Sentinel?2多光谱传感器丰富的光谱波段信息特点,以及两者短重访周期的能力,能够有效提高估算森林地上生物量模型的精度。
Estimation of aboveground biomass in a Chinese fir(Cunninghamia lanceolata)forest combining data of Sentinel-1 and Sentinel-2[J].Journal of Nanjing Forestry University (Natural Sciences Edition)
Modelling above-ground biomass stock over Norway using national forest inventory data with ArcticDEM and Sentinel-2 data
[J].
A LiDAR biomass index-based approach for tree- and plot-level biomass mapping over forest farms using 3D point clouds
[J].
A general model for the structure and allometry of plant vascular systems
[J].
基于林分高度及郁闭度的森林生物量和蓄积量模型研究
[J].
Research on forest biomass and stock volume model based on stand height and canopy density
[J].
Influence of micro-topography and crown characteristics on tree height estimations in tropical forests based on LiDAR canopy height models
[J].
Improved allometric models to estimate the aboveground biomass of tropical trees
[J].
DOI:10.1111/gcb.12629
PMID:24817483
[本文引用: 1]
Terrestrial carbon stock mapping is important for the successful implementation of climate change mitigation policies. Its accuracy depends on the availability of reliable allometric models to infer oven-dry aboveground biomass of trees from census data. The degree of uncertainty associated with previously published pantropical aboveground biomass allometries is large. We analyzed a global database of directly harvested trees at 58 sites, spanning a wide range of climatic conditions and vegetation types (4004 trees ≥ 5 cm trunk diameter). When trunk diameter, total tree height, and wood specific gravity were included in the aboveground biomass model as covariates, a single model was found to hold across tropical vegetation types, with no detectable effect of region or environmental factors. The mean percent bias and variance of this model was only slightly higher than that of locally fitted models. Wood specific gravity was an important predictor of aboveground biomass, especially when including a much broader range of vegetation types than previous studies. The generic tree diameter-height relationship depended linearly on a bioclimatic stress variable E, which compounds indices of temperature variability, precipitation variability, and drought intensity. For cases in which total tree height is unavailable for aboveground biomass estimation, a pantropical model incorporating wood density, trunk diameter, and the variable E outperformed previously published models without height. However, to minimize bias, the development of locally derived diameter-height relationships is advised whenever possible. Both new allometric models should contribute to improve the accuracy of biomass assessment protocols in tropical vegetation types, and to advancing our understanding of architectural and evolutionary constraints on woody plant development.© 2014 John Wiley & Sons Ltd.
Mapping tropical forest trees across large areas with lightweight cost-effective terrestrial laser scanning
[J].
Application des sciences accessoires et principalement des mathematiques a la physiologie generale
[J].
Morphological,physiological and biochemical responses of plants to drought stress
[J].
Relationships between NDVI,canopy structure,and photosynthesis in three Californian vegetation types
[J].
Monitoring the vernal advancement and retrogradation (green wave effect) of natural vegetation
[R].
Estimating leaf area index of mangroves from satellite data
[J].
Allometry-based estimation of forest aboveground biomass combining LiDAR canopy height attri-butes and optical spectral indexes
[J].
Assessing general relationships between aboveground biomass and vegetation structure parameters for improved carbon estimate from lidar remote sensing
[J].
Area-based vs tree-centric approaches to mapping forest carbon in Southeast Asian forests from airborne laser scanning data
[J].
基于多源数据的根河实验区生物量反演研究
[J].
Retrieval of forest above-ground biomass using multi-source data in Genhe,Inner Mongolia
[J].
内蒙古大兴安岭森林可燃物燃烧释放PM2.5中水溶性离子排放特性
[J].
DOI:10.13287/j.1001-9332.202107.003
研究森林可燃物燃烧释放的细颗粒物(PM<sub>2.5</sub>)的排放因子对于揭示森林火灾对大气和生态系统的影响至关重要,而水溶性离子是细颗粒物的重要化学成分,对颗粒物的形成具有重要意义。利用自主设计的生物质燃烧系统,模拟内蒙古大兴安岭5种典型乔木(蒙古栎、白桦、兴安落叶松、黑桦、山杨)的3种组成部分(树干、树枝、树皮)及其地表死可燃物(凋落物层、半腐殖质层、腐殖质层)以及3种典型灌木(平榛、二色胡枝子、兴安杜鹃)树枝燃烧,采用ISC1100离子色谱分析仪测定2种燃烧状态(阴燃和明燃)下PM<sub>2.5</sub>中水溶性离子(Na<sup>+</sup>、NH<sub>4</sub><sup>+</sup>、K<sup>+</sup>、Mg<sup>2+</sup>、Ca<sup>2+</sup>、F<sup>-</sup>、Cl<sup>-</sup>、NO<sub>3</sub><sup>-</sup>、NO<sub>2</sub><sup>-</sup>、SO<sub>4</sub><sup>2-</sup>)的排放因子。结果表明:乔木所有组成部分及其地表死可燃物和灌木树枝燃烧所排放PM<sub>2.5</sub>中检测到的水溶性离子,阴燃以K<sup>+</sup>、Cl<sup>-</sup>和Na<sup>+</sup>为主要组分,明燃以K<sup>+</sup>、Cl<sup>-</sup>和SO<sub>4</sub><sup>2-</sup>为主要组分。不同燃烧状态下相同乔木树种及其地表死可燃物和相同灌木排放PM<sub>2.5</sub>中检测到的水溶性离子总量均存在显著差异。灌木树枝在阴燃期间PM<sub>2.5</sub>中水溶性无机离子的排放因子比明燃更高。乔木释放的PM<sub>2.5</sub>中阳离子与阴离子的比率为1.26,地表死可燃物为1.12,灌木为2.0,表明颗粒物呈碱性。内蒙古大兴安岭的森林大火不会通过释放水溶性离子导致生态系统的酸化。
Emission characteristics of water-soluble ions in PM2.5 released by forest fuel combustion in Great Xing’an Mountains,Inner Mongolia,China
[J].
基于AISA eagle Ⅱ机载高光谱数据的森林可燃物类型识别方法
[J].
DOI:10.11873/j.issn.1004-0323.2021.3.0544
[本文引用: 1]
为形成林场级森林可燃物类型遥感精细识别方法,以内蒙古大兴安岭根河林业局潮查林场为试验区,结合地面调查和森林资源调查等资料,建立了该区域的森林可燃物类型机载高光谱影像数据分类体系;通过对各类型的原始光谱曲线、一阶微分曲线、二阶微分曲线和包络线消除曲线进行分析,得到了适用于各类型识别的特征波段;并基于生成的特征波段的主成分分析分量(信息量95%以上)及其纹理特征影像,采用随机森林方法对该区域的森林可燃物类型进行了识别。利用机载高光谱遥感数据与其他数据相结合,研究形成了林场级森林可燃物类型随机森林识别方法,识别总体精度达86.31%,Kappa系数0.836;兴安落叶松和白桦的制图精度分别达到95.58%、94.34%,表明该方法适宜用于乔木可燃物的细分,可为林场级森林可燃物更新管理、森林火灾的科学预防及扑救提供技术支撑。
An identification method on forest fuel types based on AISA eagle Ⅱ hyperspectral data
[J].
LiCHy:The CAF’s LiDAR,CCD and hyperspectral integrated airborne observation system
[J].
FUSION/LDV:Software for LiDAR data analysis and visualization,January 2021-FUSION Version 4.20
[EB/OL].
集成Landsat OLI和机载LiDAR条带数据的亚热带森林生物量制图
[J].
Mapping biomass by integrating Landsat OLI and airborne LiDAR transect data in subtropical forests
[J].
Remote sensing of species mixtures in conifer plantations using LiDAR height and intensity data
[J].
Examining the strength of the newly-launched Sentinel 2 MSI sensor in detecting and discriminating subtle differences between C3 and C4 grass species
[J].
Distinguishing vegetation from soil background information
[J].
A feedback based modification of the NDVI to minimize canopy background and atmospheric noise
[J].
Derivation of leaf-area index from quality of light on the forest floor
[J].
A soil-adjusted vegetation index (SAVI)
[J].
A unified vegetation index for quantifying the terrestrial biosphere
[J].
Evaluating the uncertainty of Landsat-derived vegetation indices in quantifying forest fuel treatments using bi-temporal LiDAR data
[J].
Om Konstruktion af Normal-Tilvæxtoversigter,med særligt Hensyn til Iagttagelserne fra Odsherred.Tidsskr
[J].
Combining canopy height and tree species map information for large-scale timber volume estimations under strong heterogeneity of auxiliary data and variable sample plot sizes
[J].
2006 IPCC guidelines for national greenhouse gas inventories,volume 4:Agriculture,forestry and other land use
[J/OL].
Mapping aboveground biomass and its prediction uncertainty using LiDAR and field data,accounting for tree-level allometric and LiDAR model errors
[J].
How many bootstrap replications are necessary for estimating remote sensing-assisted,model-based standard errors?
[J].
Effects of sample size and model form on the accuracy of model-based estimators of growing stock volume
[J].
A ratio estimator for bias correction in logarithmic regressions
[J].
Correlation coefficients:Appropriate use and interpretation
[J].
Estimating natural grassland biomass by vegetation indices using Sentinel 2 remote sensing data
[J].
Simulated impact of sample plot size and co-registration error on the accuracy and uncertainty of LiDAR-derived estimates of forest stand biomass
[J].
In situ reference datasets from the TropiSAR and AfriSAR campaigns in support of upcoming spaceborne biomass missions
[J].
Aboveground biomass density models for NASA’s Global Ecosystem Dynamics Investigation (GEDI) lidar mission
[J].
Small field plots can cause substantial uncertainty in gridded aboveground biomass products from airborne lidar data
[J].
Combining UAV and Sentinel-2 auxiliary data for forest growing stock volume estimation through hierarchical model-based inference
[J].
Effects of temporal,spatial,and elevational variation in bioclimatic indices on the NDVI of different vegetation types in Southwest China
[J].
Identification of “ever-cropped” land (1984—2010) using Landsat annual maximum NDVI image composites:Southwestern Kansas case study
[J].
Airborne discrete-return LIDAR data in the estimation of vertical canopy cover,angular ca-nopy closure and leaf area index
[J].
Comparison of canopy cover estimations from airborne LiDAR,aerial imagery,and satellite imagery
[J].
