

0 引言
ESV最早由Daily提出,将其按属性划分为13类[1]。同一时期,Costanza[7]则做了更为详细的划分,将其分为17类,并提出了基于单位面积价值当量的测算方法。谢高地等[8-
生态系统服务与景观生态格局都和土地利用变化密切相关[23-24],因此一些学者逐渐开始研究二者之间的关系。目前,生态系统服务与景观格局的集成已成为跨学科领域研究中的热点,文疆回等[25]利用地理加权回归模型,深入研究了贵州省景观格局变化对生态系统服务的影响; 曹君等[26]和郑博福等[27]分别探究了赣南地区和纽约湾区景观格局指数与ESV的关系。此外,国内外对ESV和景观生态风险的综合分析也逐渐成为新的研究方向,李超等[3]和梁仕豪等[6]采用空间自相关模型对ESV与景观生态风险进行了关联性分析; Zhang等[28]利用重心迁移模型探究ESV与景观生态风险的交互机制; Zhang等[29]基于ESV与景观生态风险进行分区,并分析了各区人口、土地利用的差异。此类研究多聚焦特定时间截面下的静态特征,却在一定程度上忽略了价值、风险的时空变化过程和演变趋势。事实上,生态系统在不同时期会受到不同的干扰,从“前期-中期-后期”3个时期分析其动态变化,可以为未来提高ESV以及降低生态风险提供参考。若能够在时空动态视角下将二者放在同一水平来研究其相互作用下的空间聚集效应并进行生态分区,有助于解释区域生态系统退化并识别生态脆弱区。
基于此,本文以河北省秦皇岛市为例,综合采用景观生态学法、当量因子法、GIS网格法以及空间自相关等方法,通过对2001—2021年的时空动态视角下ESV和ERI进行分析,揭示其演变规律,并基于“价值-风险”的空间聚集模式进行生态分区,以期为揭示旅游发达地区生态系统稳定性,实现区域可持续发展提供科学决策依据。
1 研究区概况与数据源
1.1 研究区概况
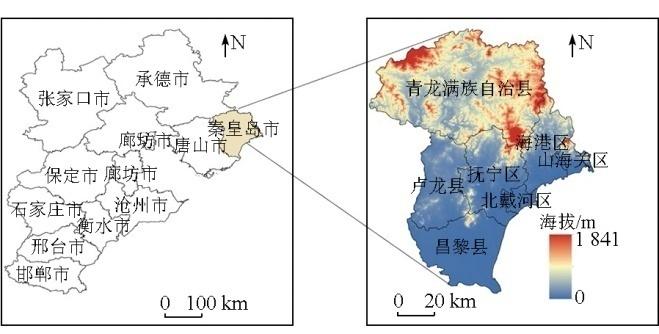
秦皇岛市(图1)位于河北省东北部(118°33'9″~119°51'9″E,39°24'52″~40°37'39″N),处于燕山山脉以东的丘陵地区和山前平原地带,南靠渤海,北靠燕山,东连辽宁,西靠京津,位于华北和东北2大经济区的交界处,居环渤海经济圈的中心位置,陆域面积7 802 km2,海域面积1 805 km2。秦皇岛属于暖温带半湿润大陆性季风气候,受海洋影响较大,平均气温11.1℃,年平均降水量602.3 mm。秦皇岛地区森林覆盖率位居河北省第2位,河流在其境内分布广泛,生态系统受到人类干扰较小,但是由于近年来经济飞速发展,局部区域存在过度开发、水土流失严重等问题。
图1
1.2 数据来源
本文采用的河北省秦皇岛市2001年、2006年、2011年、2016年和2021年土地利用分类数据来自武汉大学黄昕团队空间分辨率为30 m的中国土地覆盖数据(China land cover dataset,CLCD)(http: //doi.org/10.5281/zenodo.4417809)。根据研究需要,将原本的耕地、林地、灌木、草地、水域、冰川、湿地、荒漠和建设用地重分类为耕地、林地、草地、水域、未利用地和建设用地等6类。数字高程模型(digital elevation model,DEM)来源于地理空间数据云30 m空间分辨率数字高程数据(https://www.gscloud.cn/)。计算秦皇岛ESV所需的全国年平均粮食价格来源于《中国粮食年鉴》(https://www.zgtjnj.org/)以及国家粮食和物资储备局(http: //www.lswz.gov.cn/)。粮食总产量来源于《河北省统计年鉴》(http: //tjj.hebei.gov.cn/)。修正ESV所需的全国单位面积粮食产量来源于国家统计局(https://www.stats.gov.cn/)。
2 研究方法
2.1 ESV估算
2.1.1 当量因子法确定标准单位ESV
式中:
2.1.2 时空修正因子修正单位ESV
利用河北省秦皇岛市单位面积平均粮食产量和全国单位面积粮食产量,对其相关研究数据进行考据并加以修正[31]。ESV当量修订公式为:
式中:
2.1.3 单元网格ESV核算
在ArcGIS中,将研究区域网格化。根据相关理论研究成果[32],网格面积应是斑块平均面积的2—5倍。结合研究区特点,确定2 km×2 km网格为评价单元,共计2 098个。每个网格单一土地利用ESV公式为:
式中: ESVi为单元网格中第i类土地利用类型的生态系统服务价值; Aij为第j个网格第i种土地利用类型的分布面积; VCi为第i种土地利用类型的ESV系数; n为土地利用类型数量。
2.2 ERI构建
基于土地利用和景观格局指数的评估方法,参考相关研究成果[33],本研究选择景观脆弱度、干扰度和损失度,构建ERI的计算模型,进而对2 098个评价单元的ERI值进行了量化。计算公式为:
式中: ERIk为第k个评价单元的ERI; N为景观数量; i为景观类型; Aki为第k个评价单元内第i类景观的面积; Ak为第k个评价单元总面积; Ri为景观损失度指数; Ei为景观干扰度指数; Vi为景观脆弱度指数; Ci为景观破碎度指数; Si为景观分离度指数; DOi为景观优势度指数; a,b和c分别为相应景观指数的权重,a+b+c=1,a,b和c权重分别为0.5,0.3和0.2。
2.3 时空动态视角下价值、风险变化分类
通过计算ESV和ERI划分低、较低、中、较高和高5个等级。为了明晰ESV和ERI的动态演变趋势,本研究集成“前期-中期-后期”视角的动态管控框架[34],基于上述5个等级重新划分为低、中、高3个等级。首先,将低和较低价值重新划分为低价值,中价值仍划分为中价值,高和较高价值划分为高价值; 低和较低风险划分为低风险,中风险仍划分为中风险,高和较高风险划分为高风险。其次,以前期(2001年)、中期(2011年)及后期(2021年)3个时期ESV和ERI等级的演变过程为基准,将其演变过程划分为4种类型。中期ESV和ERI在前、后期如果等级未改变,则为维持型; 后期等级上升,则为升级型; 后期等级下降,趋于缓和,将其划分为缓和型; 等级波动变化,则为波动型(表1)。
表1 时空动态视角下的价值、风险变化分类
Tab.1
| 编号 | 价值一级 | 编号 | 价值二级 | 编号 | 风险一级 | 编号 | 风险二级 | 等级组合划分 |
|---|---|---|---|---|---|---|---|---|
| Ⅰ | 价值维持型 | 1 | 低价值稳定可控型 | Ⅰ | 风险维持型 | 1 | 低风险稳定可控型 | 低-低-低 |
| 2 | 中价值基本可控型 | 2 | 中风险基本可控型 | 中-中-中 | ||||
| 3 | 高价值严重失控型 | 3 | 高风险严重失控型 | 高-高-高 | ||||
| Ⅱ | 价值升级型 | 4 | 低价值潜在升级型 | Ⅱ | 风险升级型 | 4 | 低风险潜在升级型 | 低-低-中 低-低-高 |
| 5 | 中价值潜在升级型 | 5 | 中风险潜在升级型 | 低-中-高 中-中 高 | ||||
| 6 | 中价值基本可控型 | 6 | 中风险基本可控型 | 低-中-中 | ||||
| 7 | 高价值基本失控型 | 7 | 高风险基本失控型 | 低-高-高 中-高-高 | ||||
| Ⅲ | 价值缓和型 | 8 | 高价值潜在缓和型 | Ⅲ | 风险缓和型 | 8 | 高风险潜在缓和型 | 高-高-低 高-高-中 |
| 9 | 中价值潜在缓和型 | 9 | 中风险潜在缓和型 | 高-中-低 中-中-低 | ||||
| 10 | 中价值缓和维持型 | 10 | 中风险缓和维持型 | 高-中-中 | ||||
| 11 | 低价值缓和维持型 | 11 | 低风险缓和维持型 | 中-低-低 高-低-低 | ||||
| Ⅳ | 价值波动型 | 12 | 低价值潜在升级型 | Ⅳ | 风险波动型 | 12 | 低风险潜在升级型 | 中-低-中 中-低-高 高-低-中 高-低-高 |
| 13 | 中价值潜在升级型 | 13 | 中风险潜在升级型 | 高-中-高 | ||||
| 14 | 中价值潜在缓和型 | 14 | 中风险潜在缓和型 | 低-中-低 | ||||
| 15 | 高价值潜在缓和型 | 15 | 高风险潜在缓和型 | 低-高-低 中-高-低 低-高-中 中-高-中 |
2.4 基于“价值-风险”的生态分区识别
利用全局Moran’s I指数和局部Moran’s I指数,对ESV和ERI的空间关联性和差异性进行分析。综合考虑ESV和ERI的计算均与比率相关,其方差的波动性可能导致Moran’ I指数的统计失去真实性,故而采用基于经验贝叶斯方法(empirical bayes index,EBI)修正的全局空间自相关指数进行比对分析,综合评估二者之间的空间分布模式[35]。
双变量局部Moran’ I指数公式为:
式中: I为局部Moran’I指数; n为评价单元数; yi为第i个单元上的值;
EBI公式为:
式中: i,j分别为评价单元; Ri和Rj为综合变量;
3 结果与分析
3.1 土地利用变化分析
如图2所示,研究区各地类面积均有所增减。其中,建设用地的覆盖面积增加最为迅速,净增加369.25 km2,增长幅度为54.54%。耕地覆盖面积缩减量最多,从2001年的3 560.10 km2缩减至2021年的3 254.29 km2,缩减量为305.81 km2,但因其基数大,下降幅度仅为8.59%。草地的面积缩减较多,缩减量为179.29 km2,下降幅度为29.05%。未利用地面积与水域面积波动不大,分别缩减和增加了5.65 km2和19.87 km2,下降幅度和增长幅度分别为64.87%和35.50%。林地的面积逐年增加,其面积增加量仅次于建设用地,增加101.63 km2,增长幅度为29.05%。
图2
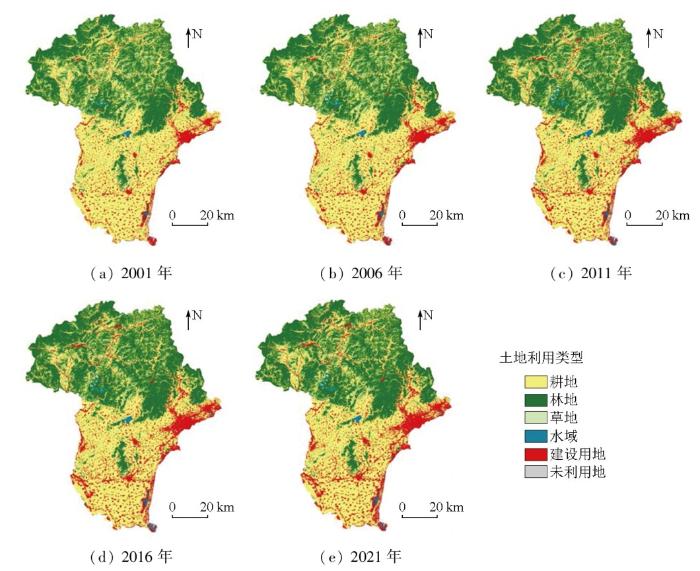
图2
2001—2021年秦皇岛市土地利用类型变化
Fig.2
Changes of land use types in Qinhuangdao City from 2001 to 2021
根据计算可知,从2001—2021年期间,每5 a秦皇岛市土地利用类型之间一直在发生转移。2001—2006年,耕地转出最为活跃,流出面积350.84 km2,其次为草地和林地; 建设用地流入面积最多,为198.73 km2,主要来源于耕地的流入。2006—2011年,耕地仍为最主要的转出地类,主要转为了林地和建设用地; 林地流入面积最多,主要来源于耕地和草地。2011—2016年,耕地、林地和草地成为最主要的流出地类,三者流出面积相差不大; 耕地成了流入面积最多的地类,其次为建设用地和林地。2016—2021年,耕地和草地流出最为明显,耕地流入面积最多,为144.01 km2,占总转入面积的47.56%(图3)。
图3
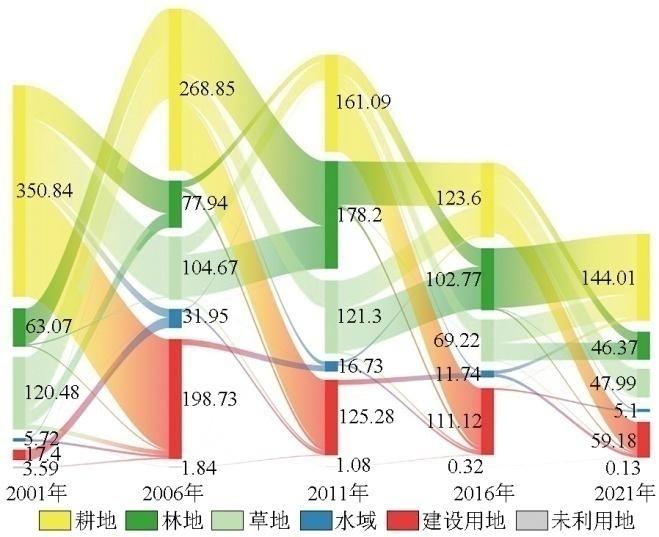
图3
2001—2021年秦皇岛市每5 a土地利用转移矩阵(km2)
Fig.3
Land use transfer matrix every five years in Qinhuangdao City from 2001 to 2021
3.2 ESV时空分布特征
3.2.1 ESV估算
经计算,2001年、2006年、2011年、2016年和2021年研究区ESV分别为24.07×10⁸元、24.18×10⁸元、25.22×10⁸元、25.33×10⁸元和24.8×10⁸元,总体变化幅度不大。从土地资源价值来看,林地ESV的贡献量最大,占总价值的72%~73%。2001—2021年林地产生的ESV整体呈先下降后升高再下降的趋势,总体增长了62.55×10⁶元。其次为耕地和水域,二者的ESV分别占总价值的14%~16%和8%~11%。耕地ESV从2001—2016年持续下降,2021年有所回升,总体降低了32.69×10⁶元; 水域ESV自2001—2016年一直升高,到2021年有所下降,总体增加了66.54×10⁶元。2001—2021年草地ESV占总价值的2%~3%,20年来持续下降,降低了24.23×10⁶元(表2)。
表2 2001—2021年秦皇岛市各土地利用类型生态系统服务价值变化及占比
Tab.2
| 土地利 用类型 | 2001年 | 2006年 | 2011年 | 2016年 | 2021年 | |||||
|---|---|---|---|---|---|---|---|---|---|---|
| ESV/106元 | 占比/% | ESV/106元 | 占比/% | ESV/106元 | 占比/% | ESV/106元 | 占比/% | ESV/106元 | 占比/% | |
| 耕地 | 380.55 | 15.81 | 373.10 | 15.43 | 348.94 | 13.83 | 344.93 | 13.62 | 347.86 | 14.03 |
| 林地 | 1 755.97 | 72.94 | 1 741.17 | 71.99 | 1 839.88 | 72.94 | 1 853.23 | 73.15 | 1 818.52 | 73.34 |
| 草地 | 83.42 | 3.47 | 82.31 | 3.40 | 74.28 | 2.94 | 62.06 | 2.45 | 59.19 | 2.39 |
| 未利用地 | 0.05 | 0.00 | 0.03 | 0.00 | 0.02 | 0.00 | 0.02 | 0.00 | 0.02 | 0.00 |
| 水域 | 187.41 | 7.78 | 221.88 | 9.17 | 259.21 | 10.28 | 273.07 | 10.78 | 253.95 | 10.24 |
| 总计 | 2 407.40 | 100.00 | 2 418.49 | 100.00 | 2 522.33 | 100.00 | 2 533.31 | 100.00 | 2 479.54 | 100.00 |
单项ESV及占比如表3所示,其中一级分类中调节服务占比最多,文化服务占比最少。二级分类可以归结为三个梯级,气候调节、水文调节和土壤保持属于第一梯级,占总ESV比例高于57%。气体调节、生物多样性、环境净化、食物生产、美学景观、原料生产属于单项ESV的第二梯级,占总ESV比例高于38%。水资源供给和养分循环属于ESV的第三梯级,ESV在0.75×10⁸元左右,占比不到4%。
表3 2001-2021秦皇岛市单项ESV及占比
Tab.3
| 一级 | 二级 | 2001年 | 2006年 | 2011年 | 2016年 | 2021年 | |||||
|---|---|---|---|---|---|---|---|---|---|---|---|
| ESV/108元 | 占比/% | ESV/108元 | 占比/% | ESV/108元 | 占比/% | ESV/108元 | 占比/% | ESV/108元 | 占比/% | ||
| 供给服务 | 食物生产 | 1.07 | 4.45 | 1.05 | 4.34 | 1.02 | 4.04 | 1.01 | 3.99 | 1.01 | 4.07 |
| 原料生产 | 0.95 | 3.95 | 0.93 | 3.85 | 0.94 | 3.73 | 0.94 | 3.71 | 0.93 | 3.75 | |
| 水资源供给 | 0.44 | 1.83 | 0.46 | 1.90 | 0.50 | 1.98 | 0.50 | 1.97 | 0.49 | 1.98 | |
| 调节服务 | 气体调节 | 2.52 | 10.47 | 2.49 | 10.30 | 2.55 | 10.11 | 2.54 | 10.03 | 2.51 | 10.12 |
| 气候调节 | 5.94 | 24.68 | 5.89 | 24.36 | 6.16 | 24.43 | 6.17 | 24.36 | 6.05 | 24.40 | |
| 净化环境 | 1.76 | 7.31 | 1.76 | 7.28 | 1.85 | 7.34 | 1.86 | 7.34 | 1.82 | 7.34 | |
| 水文调节 | 4.61 | 19.15 | 4.86 | 20.10 | 5.29 | 20.98 | 5.39 | 21.28 | 5.18 | 20.89 | |
| 支持服务 | 土壤保持 | 3.27 | 13.59 | 3.23 | 13.36 | 3.29 | 13.05 | 3.28 | 12.95 | 3.24 | 13.06 |
| 维持养分 循环 | 0.29 | 1.20 | 0.29 | 1.20 | 0.29 | 1.15 | 0.29 | 1.14 | 0.28 | 1.13 | |
| 生物多样性 | 2.23 | 9.26 | 2.22 | 9.18 | 2.32 | 9.20 | 2.32 | 9.16 | 2.28 | 9.19 | |
| 文化服务 | 美学景观 | 0.99 | 4.11 | 0.99 | 4.09 | 1.04 | 4.12 | 1.04 | 4.11 | 1.02 | 4.11 |
| 总计 | 24.07 | 100.00 | 24.18 | 100.00 | 25.22 | 100.00 | 25.33 | 100.00 | 24.80 | 100.00 | |
3.2.2 ESV可视化
通过克里金插值法,将秦皇岛市的ESV在地理空间上反映,得到ESV的空间可视化分布。为更加清晰地展现ESV和ERI的等级分布,将研究区ESV划分为低价值(ESV≤0.7×106元)、较低价值(0.7×10⁶元<ESV≤1.4×10⁶元)、中等价值(1.4×10⁶元<ESV≤2.1×10⁶元)、较高价值(2.1×10⁶元<ESV≤2.8×10⁶元)和高价值(ESV>2.8×10⁶元)5个等级,得到2001—2021年秦皇岛市ESV空间分布图(图4)。从图4中可以看出,ESV等级呈“大分散、小聚集”交错分布。2001—2021年,高价值区集中分布在青龙满族自治县和抚宁区,且青龙满族自治县的高价值区域面积呈现持续扩大趋势,主要来源于林地和水域生态系统。抚宁区的高价值区域面积有所增加,但不太明显,主要来源于水域生态系统。较高价值区主要分布在青龙满自治县、抚宁区、山海关区和吕黎县,因为其森林覆盖广阔,是一个生产力高且相对稳定的生态系统,生态价值相对较高。中价值集中分布在研究区的北半部分,主要包括青龙满族自治县、抚宁区、海港区和山海关区,呈现在较高价值区外围分布特征,主要是因为少量耕地包围在草地生态系统,草地分布较多而价值中等。较低价值分散分布在中等价值周边,主要是因为少量草地掺杂在耕地生态系统中,耕地分布较多而价值较低。低价值主要分布在研究区的南半部分,主要类型为耕地。
图4
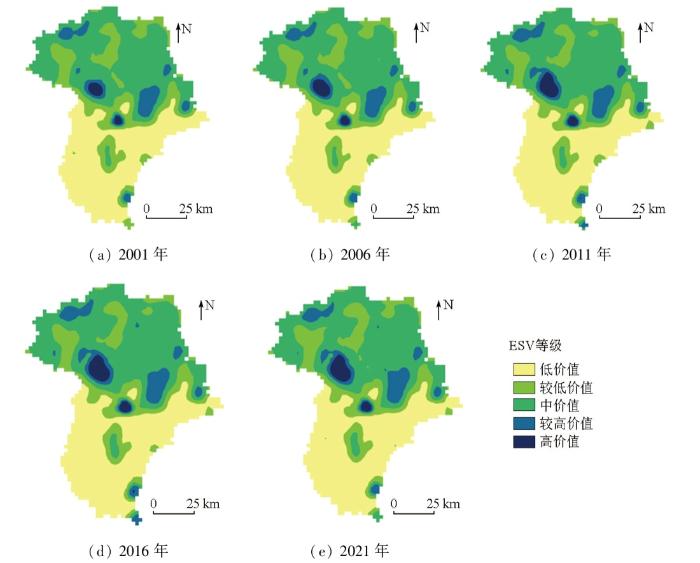
图4
2001—2021年秦皇岛市ESV空间分布图
Fig.4
Spatial distribution of ESV in Qinhuangdao City from 2001 to 2021
3.2.3 时空动态视角下ESV
将生态价值前期、中期和后期聚焦到栅格单元,依据价值演变过程,得到维持型、升级型、缓和型以及波动型4个价值演变类型。价值维持型所占比例最大,高达88.92%。低价值稳定可控型在该类型中占比高于50%,主要分布在除青龙满族自治县以外的6个区县。中价值基本可控型和高价值严重失控型分布范围较少,2种类型基本分布在青龙满族自治县。价值升级型分布范围较少,占比7.38%,该类型小片零散分布在青龙满族自治县,主要为高价值基本失控型。高价值基本失控型前期为中、低价值,中期升级为高价值,并在后期继续保持高价值类型。价值缓和型和价值波动型二者总占比不足2%,零散“点状”分布在研究区(图5)。
图5
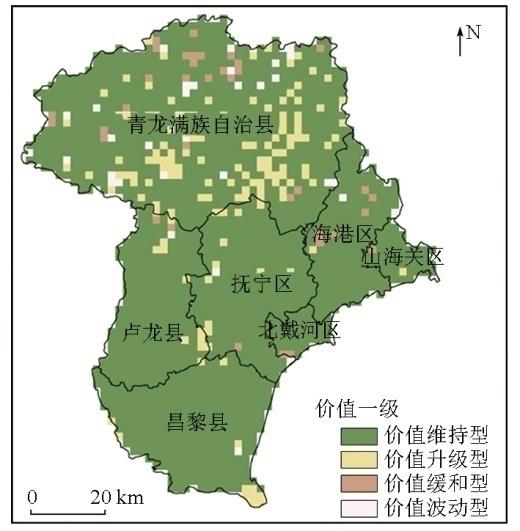
图5
时空动态视角下的ESV分区空间分布
Fig.5
Spatial distribution of ESV zones from the perspective of spatiotemporal dynamics
3.3 景观生态风险时空分布特征
3.3.1 景观生态风险数量特征分析
根据实际环境条件,将研究区划分为低风险(ERI≤0.04)、较低风险(0.04<ERI≤0.05)、中风险(0.05<ERI≤0.06)、较高风险(0.06<ERI≤0.07)和高风险(ERI>0.07)5个等级。2001—2021年,秦皇岛市生态风险均值整体处于波动下降的状态,5个时期分别为0.056 1,0.055 3,0.053 8,0.053 2和0.052 1,生态风险等级逐渐向低风险转移,分布特征呈现为“北端高、南端低”,生态风险极大值与极小值之间的差距也在逐渐缩小。等级为低、较低和中生态风险区逐渐增加,由2001年的1 167个增加到2021年的1 363个,占比增加9.35%。较高风险区有所增长,但变化总体不大。2001—2021年,高风险区呈现持续降低趋势,由565个减少到340个,占比减少10.72%(表4)。
表4 秦皇岛市生态风险等级个数及比例
Tab.4
| 生态风 险等级 | 2001年 | 2006年 | 2011年 | 2016年 | 2021年 | |||||
|---|---|---|---|---|---|---|---|---|---|---|
| 个数 | 占比/% | 个数 | 占比/% | 个数 | 占比/% | 个数 | 占比/% | 个数 | 占比/% | |
| 低风险 | 274 | 13.06 | 289 | 13.78 | 319 | 15.20 | 325 | 15.49 | 336 | 16.02 |
| 较低风险 | 570 | 27.17 | 578 | 27.55 | 591 | 28.17 | 590 | 28.12 | 610 | 29.08 |
| 中风险 | 323 | 15.40 | 326 | 15.54 | 356 | 16.97 | 401 | 19.11 | 417 | 19.88 |
| 较高风险 | 366 | 17.45 | 366 | 17.45 | 388 | 18.49 | 382 | 18.21 | 395 | 18.83 |
| 高风险 | 565 | 26.93 | 539 | 25.69 | 444 | 21.16 | 400 | 19.07 | 340 | 16.21 |
| 总计 | 2 098 | 100.00 | 2 098 | 100.00 | 2 098 | 100.00 | 2 098 | 100.00 | 2 098 | 100.00 |
3.3.2 景观生态风险可视化分析
进一步通过ArcGIS10.7软件进行空间插值和风险等级分类,得到秦皇岛市景观生态的低风险、较低风险、中风险、较高风险和高风险5个风险等级的空间分布格局。整体上看,高风险区域从“大片集中”至“小片分散”分布于青龙满族自治县,该地区多为林地,且水域错综复杂的分布在其周边,森林覆盖度极高,地形高低变化很大,斜坡很陡,植物在自然环境中生长缓慢,生态系统的自我调节能力较差。其中,较高风险区以“片状”形式分布在青龙满族自治县高风险区周围以及周边区县,如抚宁区、海港区和卢龙县; 中风险区少量“点状”分布在青龙满族自治县和吕黎县,大量“连片”分布在抚宁区、海港区、卢龙县和山海关区; 较低风险和低风险区主要分布在吕黎县,还包括卢龙县、北戴河区、海港区和山海关区。从时间尺度上看,景观生态高风险区呈现持续减少的趋势,较高风险区“点状”分布区逐渐变小,整体上较高风险区面积变化不大。低、较低以及中风险区面积逐渐增大,是因为较高风险区大部分转化为了中风险区(图6)。
图6
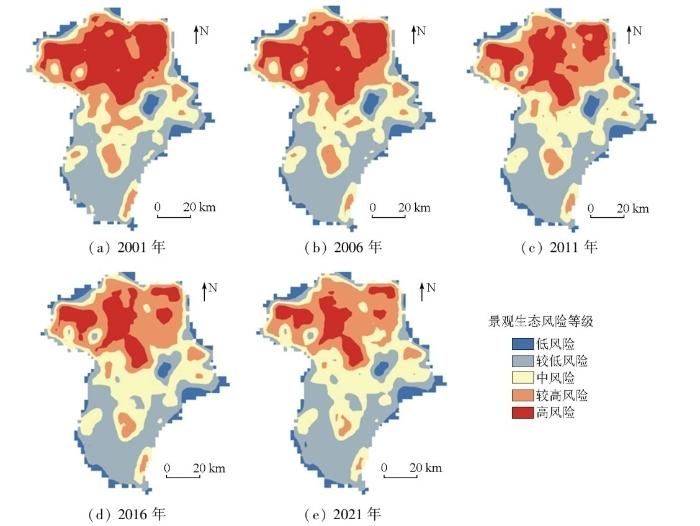
图6
2001—2021年秦皇岛市景观生态风险空间分布图
Fig.6
Spatial distribution of landscape ecological risks in Qinhuangdao City from 2001 to 2021
3.3.3 时空动态视角下景观生态风险变化
依据风险演变过程分区原则,得到维持型、升级型、缓和型以及波动型4种演变类型(图7)。研究区风险维持型占比高达42.10%,集中分布在研究区的北部以及零散分布在南部各区县城镇。风险缓和型占比32.62%,主要为低风险缓和维持型。此类型前期为中、高风险,中期转化为低风险,并在后期继续维持低风险类型。由于旅游业的发展,使其建设用地扩张,占用了耕、林、草地,使其风险下降。风险升级型占比18.97%,主要是中、低风险升级为高风险,因为人类活动频繁,加速干扰了森林生态系统,增加了生态风险。风险波动型占比6.31%,主要为中期是高风险,前后期是低、中风险的地区。
图7
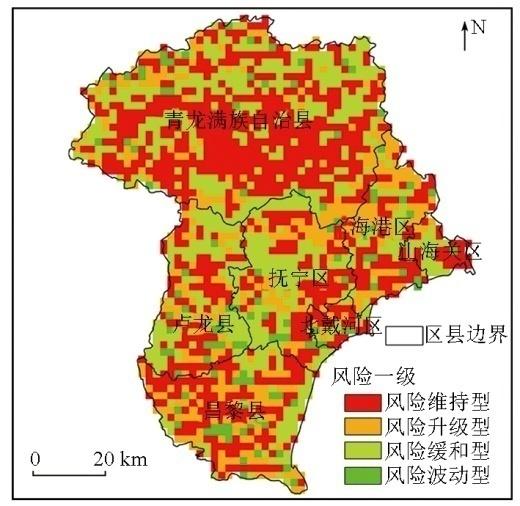
图7
时空动态视角下的景观生态风险分区空间分布
Fig.7
Spatial distribution of landscape ecological risk zones from the perspective of spatiotemporal dynamics
3.4 生态分区建设
3.4.1 空间相关性
利用GeoDa软件计算,得到ERI散点图(图8)。2001—2021年的Moran’s I分别为0.685,0.682,0.684,0.667和0.667,且P<0.05,从图中可以看出研究区ESV与ERI存在显著的正向空间关联性。
图8
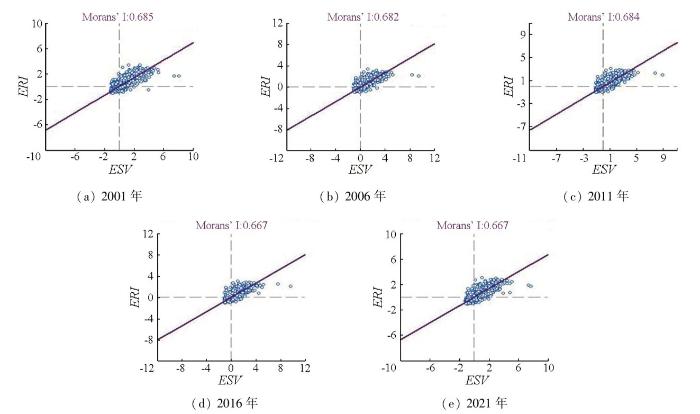
图8
2001—2021年ESV与ERI的相关性指数分布图
Fig.8
Correlation index distribution of ESV and landscape ERI from 2001 to 2021
3.4.2 生态分区结果
利用GeoDa软件绘制LISA聚集图,进行局部空间的自相关分析。基于Z检验(P<0.05),获得了秦皇岛ESV和ERI的双变量LISA分布图,有助于揭示两者在局部空间上的异质性差异。将空间自相关达到显著性水平P<0.05的区域关联模式分为高价值-高风险、高价值-低风险、低价值-高风险、低价值-低风险以及不显著5个不同的模式(图9)。
图9
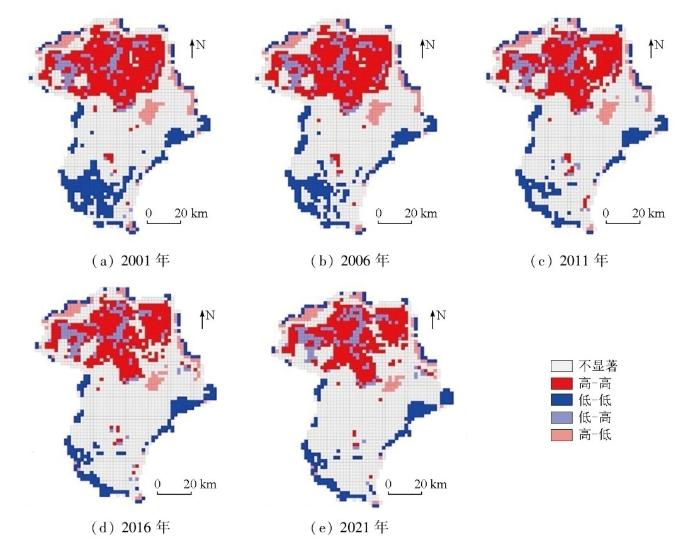
图9
2001—2021年ESV与ERI的双变量LISA聚集图
Fig.9
Bivariate LISA aggregation plot of ESV and ERI from 2001 to 2021
1)高价值-高风险区在2001年、2006年、2011年、2016年和2021年这5 a分别占研究区面积的23.12%,22.83%,21.12%,20.16%和19.11%,该区在研究区广泛分布,以北部地区较为集中,分布于青龙满族自治县以及抚宁区,分布面积呈逐年减少的趋势。青龙满族自治县的建设用地由“点—线”发散式分布于耕地之间,耕地又被大量的林草地包围,该县在具备一定的林草耕地覆盖的同时又有城镇分布; 抚宁区则存在小片水域,使得该区域ESV高,水域周边出现了建设用地以及耕地,导致ERI升高。这就使得在同一研究单元中,青龙满族自治县以及抚宁区的部分地区高价值与高风险并存。
2)低价值-高风险区面积总体呈现波动增加的趋势。在5个时期分别占研究区面积的5.77%,5.86%,5.62%,5.91%和6.34%。该区被“高-高”区所包围,以“散状式”大量分布于青龙满族自治县,少量集中于海港区。该区城市范围不断扩大,导致建设用地增加,大量草地被占用,并转化为价值较低、风险较高的耕地。人类不合理的土地利用方式攫取了较多的生态价值,导致人地冲突加剧,造成了一些地区生态风险的提高。
3)低价值-低风险区面积呈逐年降低的趋势。在5个时期分别占研究区面积15.11%,13.16%,10.63%,10.30%和9.91%,主要分布在吕黎县以及山海关区,少量分散分布于海港区、北戴河区、卢龙县以及青龙满族自治县的边界处。该地区土地类型主要是连片的耕地,并伴随着不断增加的建设用地。耕地和建设用地对ESV的贡献相对较小,因此能提供的生态价值远远低于其他类型的用地。这些地区的用地类型相对简单,大部分耕地分布在地势平坦的区域,然而由于建设用地分布在这里,使得该地区成为人类活动比较频繁的区域。人类的各种活动可能会对耕地和建设用地的生态环境产生改变和影响,从而使得该区域保持相对稳定,生态风险较低。
4)高价值-低风险区面积最小,呈现下降变化趋势。在5个时期分别占研究区面积4.91%,4.62%,4.72%,4.29%和3.91%,主要分布于青龙满族自治区,少量分布于海港区和抚宁区,河北柳江盆地分布于此地。在该地区,能够产生较高ESV的林地和草地具有较高的植被覆盖率、较少的人口分布以及较少受经济活动的影响,对生态系统的干扰较小,能够实现系统的良性运行,从而创造较高的价值。
5)不显著区是指ESV与ERI二者空间集聚关系不显著的区域,其占研究区总面积的51%~61%。该区域地类主要为农田,ESV与ERI等级分布均较低,不存在明显集聚中心。
4 讨论与结论
4.1 讨论
本研究核算出的秦皇岛市ESV与京津冀研究中秦皇岛市ESV存在差异[36],主要是因为修正因子与研究区范围的不同。ESV北高南低的空间分异特征照应了以上研究结论,高值区主要位于青龙满族自治县和抚宁区,是因为青龙满族自治县森林覆盖率较高以及抚宁区水域面积较大水源涵养功能强。本次研究ERI整体保持稳定,景观生态风险水平主要表现为高生态风险水平和低生态风险水平,与京津冀景观生态风险的研究成果吻合较好[37]。同时,本研究选择“前期-中期-后期”3个时段对ESV和ERI时空动态演变规律进行研究,相对于仅仅研究末期和初期的变化,此方法能够清晰地显示ESV和ERI的动态演变趋势,集成“前期-中期-后期”视角的动态管控框架。ERI和ESV相关性分析可以较好地把人类福祉和生态环境变化相挂钩,并从一定程度上体现社会经济发展所导致的生态环境变化情况,从而为生态环境保护及可持续发展等方面提供决策支持。然而,由于ESV和ERI均基于区域土地利用类型数据进行的计算,对两者相互作用的分析还无法描述并体现生态系统服务和生态风险之间的直接内在关联。为此,应充实生态系统服务和生态风险的研究内容,研究粮食生产、水源涵养、碳固存、生境质量、土壤保持等生态系统功能与生态敏感性等改进的传统生态风险之间的关系,构建“生态系统服务-生态风险”框架,更好地厘清两者间的相互关系,为生态保护提出决策建议。
4.2 结论
1)研究区生态系统服务价值总体变化幅度不大,价值等级呈现“大分散、小聚集”交错分布的空间格局。从土地资源价值来看,林地生态系统的价值的贡献量最大,占总生态系统服务价值72%~73%。单项生态系统服务中,调节服务占比最多,高于60%。价值演变类型中,价值维持型所占比例极大,其中低价值稳定可控型在价值维持型中占比高于50%。
2)研究区生态风险均值处于波动下降的状态,生态风险等级逐渐向低风险转移,分布特征呈现为“北端高、南端低”。高风险区面积持续缩小,较高风险区面积几乎无变化,低、较低以及中风险区面积逐渐增大。风险演变类型中,风险维持型占比高达42.10%,主要为高风险严重失控型和低风险稳定可控型。
3)研究区以高价值-高风险区为主,集中在北部地区,分布在青龙满族自治县和抚宁区。低价值-低风险区以“线状”包围式分布在研究区边界,分散在吕黎县以及山海关区。低价值-高风险以“散状式”大量分布于青龙满族自治县,少量集中于海港区。高价值-低风险区面积最小,呈现下降变化趋势,主要分布在青龙满族自治县,少量分布于抚宁区和海港区。
参考文献
生态系统服务的生态学机制研究进展
[J].
Ecological mechanisms of ecosystem ser-vices
[J].
城市化背景下粤港澳大湾区生态风险时空演变及生态分区识别研究
[J].
Study on spatial and temporal evolution of ecological risk and ecological zoning identification in Guangdong-Hong Kong-Macao Greater Bay Area under the background of urbanization
[J].
我国城市总体规划生态考量的不足及对策探讨
[J].
Inadequate ecological consideration in urban master plan and countermeasures
[J].
Evaluating the landscape ecological risk based on GIS:A case-study in the Poyang Lake region of China
[J].
吉林省生态系统服务价值与景观生态风险关联性及其空间分异
[J].
DOI:10.13287/j.1001-9332.202403.022
[本文引用: 3]

探究生态系统服务价值与景观生态风险之间的相关性及其空间分异的驱动因子,有助于维护区域生态安全的稳定并促进人类福祉的持续创造。本研究以吉林省为例,基于5 km×5 km的评价单元,对2000、2005、2010、2015、2020年土地利用数据进行网格化和重采样,定量评价研究区的景观生态风险和生态系统服务价值,揭示其时空变化特征,并采用双变量空间自相关分析方法和地理探测器模型揭示二者的相关性及其空间分异的驱动因子。结果表明: 2000—2020年间,研究区生态系统服务价值总量由3858.95亿元下降至3782.11亿元。研究区东部以极低风险区、中风险区和低风险区为主,西部以极高风险区和高风险区为主。吉林省景观生态风险与生态系统服务价值间呈现出显著的负相关性以及显著的空间负相关性。土地利用类型和人为影响指数是促使研究区生态系统服务价值和景观生态风险产生空间分异的重要驱动因子。未来应通过合理规范土地利用和合理控制人为活动强度对吉林省进行生态环境优化。
Correlations between ecosystem service value and landscape ecological risk and its spatial heterogeneity in Jilin Province,China
[J].
The value of the world’s ecosystem services and natural capital
[J].
青藏高原生态资产的价值评估
[J].
Ecological assets valuation of the Tibetan Plateau
[J].
DOI:10.11849/zrzyxb.2003.02.010
[本文引用: 1]
Based on a series of1∶1000000maps of natural resources of China,6categories of ecological assets were divided,which included forest,grassland,farmland,wetland,water body and desert.By means of GIS,the1∶4000000Ecological Assets Map of Tibetan Plateau was compiled and the relative data were calculated.According to partial global ecosystem services value evaluation results obtained by Costanza et al.(1997)along with responses of ecological questionnaire s from specialists of China,this paper established the ecosystem services value unit area of Chinese terrestrial ecosystems.We used the ecological assets value table as a basis and also adjusted price value by biomass and then,the ecological assets value of the Tibetan Plateau was estimated.The results indicated that ecosystem services value of Tibetan Plateau is some 9363.9×10<sup>8</sup> yuan annually,accounting for17.68%of annual ecosystem services value of China and0.61%of the world.The value of soil formation and disposition provided by ecosys-tem s is the highest,which occupies19.3%of the total ecosystem services value and then,the value of waste treatment takes up16.8%,water conservation value,16.5%and biodiversity,16%.The forest and the grassland ecosystem s offered the main ecosystem services value,being31.3%and48.3%of the total value provided by different ecosystem types,respectively.
一个基于专家知识的生态系统服务价值化方法
[J].
Expert knowledge based valuation method of ecosystem services in China
[J].
DOI:10.11849/zrzyxb.2008.05.019
Valuation of global ecosystem services by R Costanza(1997)has attracted attention of the Chinese ecological researchers over the years. And many Chinese scientists have been using the methods to valuate the ecosystem services for forest, grassland and farmland ecosystems. However, it has been turned out that there are several shortcomings in direct adaptation of the methods, for instance, some ecosystem services have been insufficiently valuated or even ignored via using Costanza’s method. To fill this gap, we have, on the basis of Costanza’s method, developed a new method or 'unit value’ based method for assessment of ecosystem services. Expert interviews with structured questionnaire were contacted in 2002 and 2007 respectively, and altogether 700 Chinese ecologists were involved in the interviews for testing the method. It has been found that the values of ecosystem services from expert knowledge based unit value method and biomass based method are comparative. Therefore, expert knowledge based assessment of ecosystem services could be used as a method for assessing ecosystem services with known land use areas, and a good result could be generated within a short period of time. However, for scientifically sound and concrete results, the spatial disparity of ecosystem services should be taken into account.
基于单位面积价值当量因子的生态系统服务价值化方法改进
[J].
Improvement of the evaluation method for ecosystem service value based on per unit area
[J].
粤港澳大湾区生态系统服务价值的时空演化及其影响机制
[J].
DOI:10.11821/dlxb202111014
[本文引用: 1]
生态系统服务是生态要素、结构、功能和产品造福于人类社会的媒介和通道。根据生态系统服务价值(ESV)及其影响机制调节人类社会对生态系统的利用强度和保护方式,对于实现人地和谐的可持续发展目标具有重要意义。本文以粤港澳大湾区作为研究对象,依托遥感数据修订ESV核算结果,更加准确地揭示2000—2015年粤港澳大湾区ESV的时空演变特征,并引入面板分位数回归深入探索生态系统服务影响因素的分段效应,增加对生态系统服务影响机制的认识。结果显示:① 2000—2015年粤港澳大湾区ESV减速下降,下降区域主要分布在粤港澳大湾区中部和珠江入海口两岸等城市快速扩张区。② 在城市交界处,土地利用变化会带来更为强烈的ESV变化。③ 在ESV水平不同的区域,影响因素具有不同的影响效果。用地完整度仅在ESV的低值区可以促进生态系统服务能力提升。气温对生态系统服务能力的正向作用随ESV的提高而增强,经济密度对生态系统服务能力的负向作用随ESV的提高而减弱,二者均会导致ESV高值区与低值区间的差距增大,形成“自然马太效应”。
Spatiotemporal evolution and influencing mechanism of ecosystem service value in the Guangdong-Hong Kong-Macao Greater Bay Area
[J].
DOI:10.11821/dlxb202111014
[本文引用: 1]
Ecosystem services are the media and channels through which ecological elements, structures, functions and products benefit human society. Regulating the utilization intensity and protection methods of the human society on the ecosystem according to the ecosystem service value (ESV) and its influencing mechanism is of great significance for achieving the sustainable development goals of harmony between man and land. This paper takes the Guangdong-Hong Kong-Macao Greater Bay Area (GBA) as the research object and revises the ESV accounting results based on remote sensing data to more accurately reveal the spatiotemporal evolution characteristics of ESV in the GBA from 2000 to 2015. And, panel quantile regression is implemented to deeply probe the segmentation effects of the factors affecting ecosystem services and to increase the understanding of the influencing mechanism of ecosystem services. The main results are as follows: (1) In the GBA, the value of regulation services accounts for the highest proportion among the four ecosystem sub-services. From 2000 to 2015, the total ESV declined with a decreasing rate, and the values of leading ecosystem service and hydrologic regulation service had the similar variation trend. The decline areas were mainly distributed in the central part of the GBA and areas along the Pearl River Estuary. (2) Elastic index, indicating response of ESV to land use change, reached the peak (1.08) between 2010 and 2015. Changes in land use types per unit area induced greater ESV declines. The spatial distribution of elastic index showed that land use changes brought about more intense ESV variations at the junction of cities from 2000 to 2015. (3) In areas with different ESV levels, influencing factors have different effects. Land use integrity can only promote ecosystem service capabilities in low-ESV areas. The positive effect of temperature on ecosystem service capacity increase with the increase of ESV, which is self-reinforcement of ecosystem. Moreover, the negative effect of economic density on ecosystem service capacity decreases with the increase of ESV, which is self-protection of ecosystem. Combination of the self-reinforcement and self-protection will lead to the ESV gap between the high- and low-ESV areas, and induce the "natural Matthew effect".
Assessing the amenity value of forest ecosystem services:Perspectives from the use of sustainable green spaces
[J].
气候变化背景下未来中国草地生态系统服务价值时空动态格局
[J].DOI:10.16258/j.cnki.1674-5906.2017.10.002
Temporal-spatial dynamic pattern of grassland ecosystem service value under the background of climate change in the future in China
[J].
鄱阳湖生态经济区生态系统服务价值预测与驱动力
[J].
Ecosystem services value prediction and driving forces in the Poyang Lake Ecoeconomic Zone
[J].
森林生态系统服务功能对经济社会的贡献研究——以广西西江经济带为例
[J].
Study on the contribution of forest ecosystem services to economy and society:A case study of Xijiang economic belt in Guangxi
[J].
流域土地利用与景观生态风险响应关系研究
[J].
Correlational relationship between land use and landscape ecological risks in Inner Mongolia section of middle Nenjiang River
[J].
景观生态风险评价研究进展与展望
[J].
DOI:10.11821/dlxb201504013
[本文引用: 1]
面向全球城市化进程的快速推进与生物圈环境变化的不断增强,生态风险评价能够明晰制约区域生态持续性的主要生态要素与过程,成为当前自然地理学与宏观生态学应对社会—生态系统综合管理的热点研究领域之一。景观生态学高度关注空间异质性及景观格局—过程互馈,景观生态风险评价则为这一领域提供了新的研究视角。本文明确界定了景观生态风险评价的概念内涵,系统梳理了景观生态风险评价与生态风险评价、区域生态风险评价的异同;从评价对象的类型选择、评价单元的景观意义表征、评价方法的范式统一、评价模型的指数化途径和评价指标权重设定等方面,探讨了国内外景观生态风险评价的近今进展;同时,研究还展望了景观生态风险评价的重点发展方向,即基于景观过程的生态内涵明晰、尺度推绎在风险评价中的应用、评价结果的不确定性分析、耦合非线性生态模型的风险阈值判定、生态系统服务及其价值的整合、源汇景观过程识别与模型综合集成。
Review on landscape ecological risk assessment
[J].
DOI:10.11821/dlxb201504013
[本文引用: 1]
Under the background of accelerating global urbanization and environmental change, it is of great significance for ecological risk assessment to identify local ecological elements and processes influencing regional ecological sustainability. Ecological risk assessment has been regarded as one of the key topics in researches on integrated management of social ecological system in the view of physical geography and macro ecology. With a special focus on spatial heterogeneity and the correlations between landscape patterns and ecological processes deriving from landscape ecology, landscape ecological risk assessment (LERA) deepens this topic with a new perspective and paradigm. In this paper, through the contrast among ecological risk assessment, regional ecological risk assessment, and landscape ecological risk assessment, the connotation of LERA is clearly defined. Detailed research progresses on LERA are also discussed and focused on region selection of assessing target, landscape meaning characterization of assessing unit, paradigm uniformity of assessing method, indexation of assessing model, and weight setting of assessing index. Finally, future research prospects on LERA are proposed, including detecting ecological implication in the view of landscape process, applying the scaling concept in risk assessment, quantifying the uncertainty of assessing results, coupling nonlinear ecological model with risk threshold determination, incorporating values of ecosystem services into risk assessment, and integrating multiple ecological models through the identification of source and sink landscape process. A framework has also been constructed to illustrate the logic relationships among the prospects of LERA.
干旱区内陆流域区域景观生态风险分析——以阜康三工河流域为例
[J].本文以新疆阜康三工河流域为研究区域,分析了干旱区内陆流域的景观生态的基本特点。在此基础上,基于景观格局构造了景观损失指数和综合风险指数作为区域景观生态风险评价指标,并利用空间分析方法对风险指数进行变量空间化,通过对生态风险指数采样结果进行半方差分析和空间插值,揭示了该区域的生态环境状况的空间分布特征。结果表明 :研究区内的生态风险有不断扩大的趋势,区域内形成三个高的景观生态风险区域。根据评价结果,提出了内陆流域生态环境的重点保护与治理区以及合理的保护与综合整治对策.
Ecological risk analysis of regional landscape in inland river watershed of arid area:A case study of Sangong River Basin in Fukang
[J].
海口市海岸带近30年土地利用变化的景观生态风险评价
[J].
Landscape ecological risk assessment of land use changes in the coastal area of Haikou City in the past 30 years
[J].
京津冀地区生境质量与景观格局演变及关联性
[J].
Spatiotemporal evolution and spatial correlation of habitat quality and landscape pattern over Beijing-Tianjin-Hebei region
[J].
基于土地利用变化的玛纳斯河流域景观生态风险评价
[J].
Landscape ecological risk assessment in Manas River Basin based on land use change
[J].
Ecosystem service values in the Dongting Lake eco-economic zone and the synergistic impact of its driving factors
[J].
湘西州地区生态系统服务价值时空特征及驱动分析
[J].
The characteristics and driving factors of spatiotemporal changes in the ecosystem service value in Xiangxi,Hunan,China
[J].
贵州省生态系统服务价值时空演变及其对景观格局变化的响应
[J].
DOI:10.13287/j.1001-9332.202211.020
[本文引用: 1]
贵州省是我国生态文明试验区,也是世界上岩溶地貌发育最典型的地区之一,探明其生态系统服务价值变化及其与景观格局在空间上的相关性分布特征,有利于因地制宜地制定生态环境治理和保护措施。本研究分析了2005—2018年间贵州省景观格局和生态系统服务的时空变化,并构建二者之间的地理加权回归模型,探讨其相关系数在空间上的变化。结果表明: 2005—2018年间,贵州省景观类型的转移主要发生在建设用地、森林、水域、草地和农田5种景观之间,景观破碎度和多样性增加;生态系统服务价值逐年增长,森林是贵州省生态系统服务价值的主要贡献者,生态系统服务以调节服务为主;对于高价值景观类型而言,多样性提升和破碎度降低有利于生态系统服务价值增长;而在低价值景观类型集中的区域,则呈现出相反的影响效果。应根据贵州省不同区域的生态环境特征,调整景观转移方向和不同景观类型的多样性和破碎度空间分布,从而实现生态系统服务价值增长。
Temporal and spatial variation of ecosystem service value and its response to landscape pattern change in Guizhou Province,China
[J].
1996—2015年纽约湾区生态系统服务对景观格局变化的响应
[J].
DOI:10.3969/j.issn.1004-9479.2021.04.2020124
[本文引用: 1]
生态系统服务价值对景观格局演变的响应研究已成为地理学、生态学等领域的研究热点。以纽约湾区为研究区,利用1996—2015年土地覆被数据和数字高程数据,采用生态系统服务价值当量估算法、景观格局指数、空间自相关分析等方法,分析1996—2015年湾区景观格局的时空演变规律,定量评估研究区生态系统服务价值,探讨纽约湾区生态系统服务价值对景观格局变化的响应。结果表明:①纽约湾区景观以林地和建设用地为主,其整体变化幅度较小,20年间湿地面积减少约10.94%,而建设用地增长幅度较高,约25.91%。②纽约湾区1996—2015年间ESV总量呈逐步减少,20年间共减少57.83亿元,2000—2005年间下降幅度较大约1.69%。③湾区ESV空间异质性较强,不同地区ESV增减所对应的土地利用转移各有差异。湾区南部热点区多出现湿地增加,而北部则以水域、草地增加为主。湾区西部冷点区多为湿地转林地的现象,而中部冷点区则以建设用地增加为主。④除建设用地外,湾区其余地类均呈现人为干预越少,景观结合度、聚集度越高,越有利于提升湾区整体的生态系统服务价值的规律。⑤纽约湾区ESV强度与土地利用程度(La)的空间关联性较弱,且湾区生态环境质量逐年下降。研究结果希望对世界级大湾区环境资源利用率的提升研究具有借鉴意义。
Response of ecosystem services to landscape pattern changes in the New York Bay Area from 1996 to 2015
[J].
DOI:10.3969/j.issn.1004-9479.2021.04.2020124
[本文引用: 1]
The response of ecosystem service values to the evolution of landscape pattern has become a hot topic in the fields of geography and ecology. Based on the digital elevation data and land cover data in the New York Bay Area from 1996 to 2015, this paper analyzed the temporal and spatial evolution law of the bay area landscape pattern from 1996 to 2015, quantitatively evaluated the ecosystem service value of the bay area, and discussed the response of ecosystem service values to landscape pattern change by using the methods of ecosystem service value equivalent estimation, landscape pattern index and spatial autocorrelation analysis.The results show that: ① The landscape of the New York Bay area is dominated by forest and construction, and its overall change is relatively weak. The wetland area decreased by approximately 10.94% in 20 years, and the construction land increased by approximately 25.91%.② From 1996 to 2015, the ESV in the New York Bay area decreased gradually, with a total decrease of 5.783 billion yuan in 20 years, and a rapid decrease of about 1.69% between 2000 and 2005.③ The spatial heterogeneity of ESV in the Bay Area is strong, and the land-use transfer corresponding to the increase and decrease of ESV in different regions varies. The hotspots in the southern part of the Bay Area tend to increase in wetlands, while the northern part is dominated by waters and grasslands. The cold spot areas in the west of the Bay Area are mostly wetland to forest, while the central cold spot areas are dominated by increased construction.④ Except for the construction land, the less human intervention, the higher landscape integration and aggregation, the more conducive to enhance the overall ecosystem service value of the bay area.⑤ The spatial correlation between ESV intensity and land use (LA) is weak, and the eco-environmental quality of New York Bay area is declining year by year. The results of the study are expected to be of reference to the study of improving the utilization of environmental resources in the world-class Greater Bay Area.
赣南地区景观格局变化及其对生态系统服务价值的影响
[J].
Landscape pattern change and its impacts on the ecosystem services value in southern Jiangxi Province
[J].
Spatiotemporal exploration of ecosystem service value,landscape ecological risk,and their interactive relationship in Hunan Province,Central-South China,over the past 30 years
[J].
Designing a sustainable development path based on landscape ecological risk and ecosystem service value in Southwest China
[J].
基于MAUP下川滇生态屏障区生态系统服务价值多尺度空间分异及地理探测响应
[J].
Multi-scale spatial differentiation and geographic detection response of ecosystem service value in Sichuan-Yunnan ecological barrier based on the modifiable areal unit problem
[J].
基于土地利用的江苏省各市生态系统服务价值时空变化研究
[J].
DOI:10.12302/j.issn.1000-2006.202109012
[本文引用: 1]
【目的】土地利用变化必然改变生态系统结构进而导致生态系统服务价值产生变化。探究江苏省长时间序列的生态系统服务价值与土地利用变化的关系,为江苏省生态可持续发展与土地利用规划管理提供科学依据。【方法】以江苏省为研究区,基于1980—2020年每隔10 a的各市土地利用数据,建立土地利用转移矩阵,分析江苏省土地利用变化特征。采用单位面积价值当量法计算不同时期江苏省各地级市及不同区域的生态系统服务价值;借助GIS技术进行生态系统服务价值空间插值分析(IDW),分析江苏省生态系统服务价值时空动态;利用弹性系数计算土地利用变化率以及生态系统服务价值变化率比值,揭示土地利用变化对生态系统服务价值的响应规律。【结果】1980—2020年的土地利用转移矩阵结果显示,江苏省土地转出量最大的是耕地,转入量最大的是建设用地,其中土地利用转移最主要的方式是耕地转为建设用地。基于单位面积价值法计算结果表明,研究期内江苏省总生态系统服务价值呈上升趋势,不同生态系统服务类型中,水文调节价值最大,水资源供给价值最小。从不同城市角度来看,苏州、盐城、淮安的总生态系统服务价值较高,空间插值分析结果显示,江苏省总生态系统服务价值在长时间序列中表现出明显的连续性与差异性,总体呈现东高西低、南高北低的特征。弹性系数结果显示,高弹性值的区域相对主要集聚于东部沿海,中弹性值的区域相对广泛呈片状分布,低弹性值的区域分布相对分散。【结论】江苏省土地利用变化显著,生态系统服务高值分布与土地利用类型覆盖面积以及生态系统服务价值系数有重要关系,土地利用变化对生态系统服务价值产生影响,同时决定了生态系统服务价值的弹性变化。生态系统服务价值的系数越高,其对土地利用变化越敏感。
Spatial and temporal variations of ecosystem service values in Jiangsu Province based on land-use change
[J].
基于LUCC的陕西渭北旱塬区景观生态风险评价
[J].
Landscape ecological risk assessment in Weibei dryland region of Shaanxi Province based on LUCC
[J].
基于生态系统服务价值和景观生态风险的生态分区识别与优化策略——以祁连山国家公园青海片区为例
[J].
Ecological zoning identification and optimization strategies based on ecosystem service value and landscape ecological risk:Taking Qinghai area of Qilian Mountain National Park as an example
[J].
时空动态视角下快速城市化地区景观生态风险评价与分区
[J].
Assessing landscape ecological risk in rapidly urbanized areas from the perspective of spatiotemporal dynamics
[J].
滨州市生态系统服务价值与生态风险时空演变及其关联性
[J].
Spatiotemporal evolution and correlation analysis of ecosystem service values and ecological risk in Binzhou
[J].
京津冀城市群城镇化与生态建设对生态系统服务价值的影响
[J].
Impact of urbanization and ecological construction on the ecosystem services value in the Beijing-Tianjin-Hebei urban agglomeration
[J].
京津冀城市群土地利用生态风险的时空变化分析
[J].
Spatiotemporal analysis of the dynamic changes in land use ecological risks in the urban agglomeration of Beijing-Tianjin-Hebei vegion
[J].
