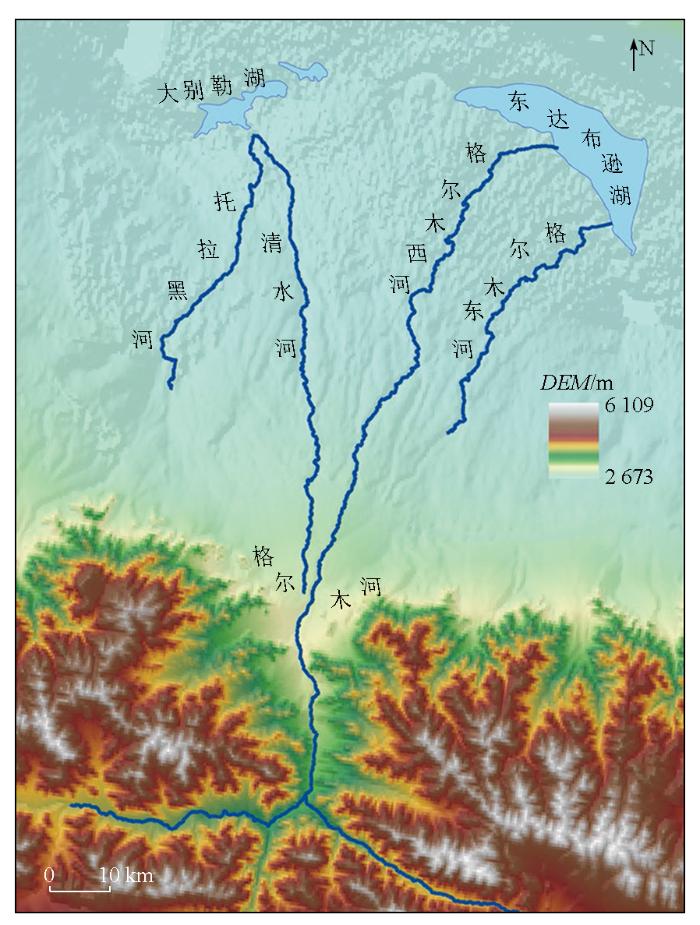
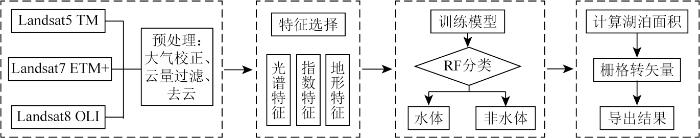
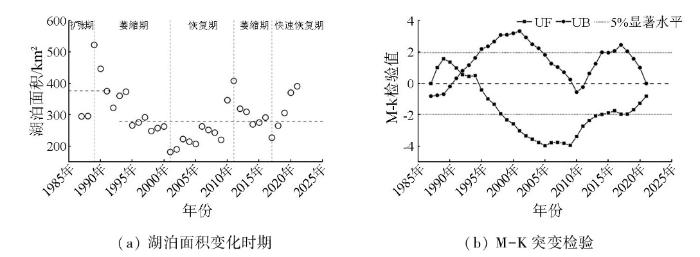
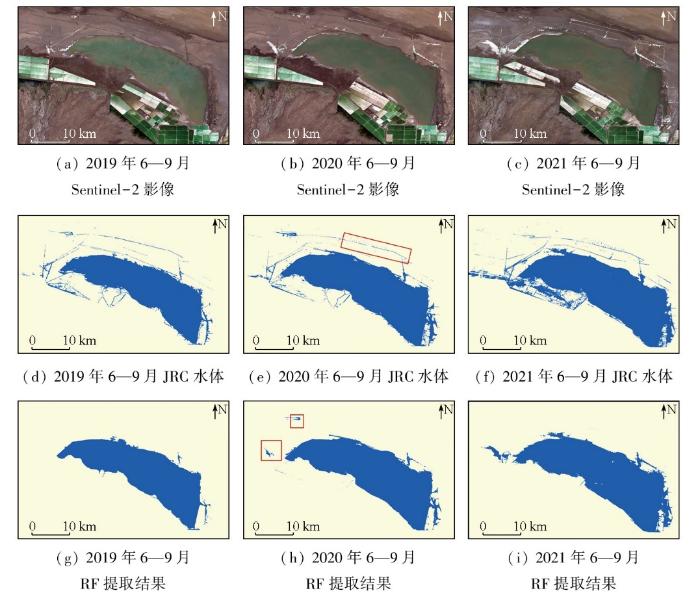
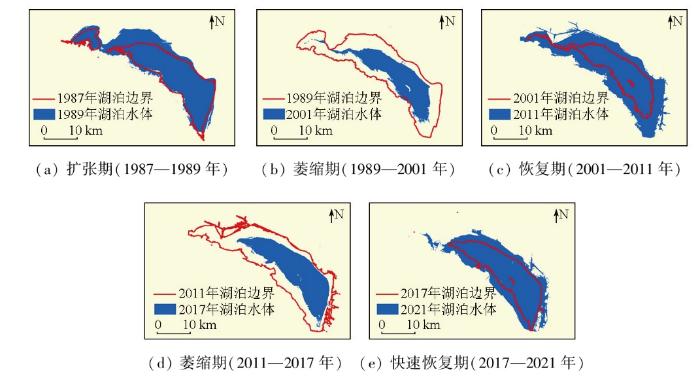
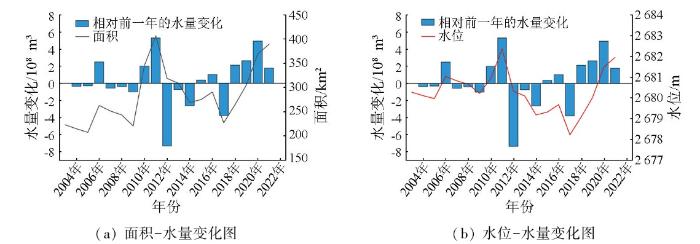
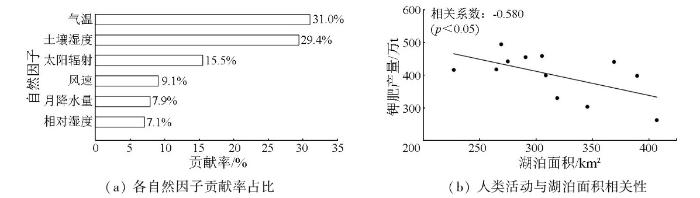
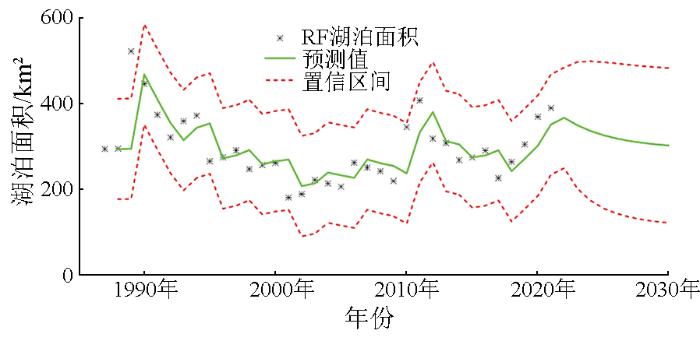
Changes in lake area and water volume exert significant impacts on the ecological environment of arid regions. Targeting East Dabuxun Lake,Golmud River Basin,Qinghai Province,this study developed a multi-index random forest algorithm based on the Google Earth Engine (GEE) cloud platform and Landsat imagery to extract the lake area from 1987 to 2021. Then,an area-water level relationship was established using laser altimetry data from ICESat and CryoSat satellites to estimate changes in water volume. Finally,the impacts of natural factors and human activities on the lake were evaluated,using ERA5-Land climate data and records of potash mining,along with correlation analysis and random forest-based contribution assessment. The results indicate that the temporal changes in lake area over time can be divided into five stages:expansion,shrinkage,recovery,re-shrinkage,and rapid recovery. Spatially,the lake exhibited a pattern of shrinkage in the south and expansion towards the northwest. From 2003 to 2021,the water volume of East Dabuxun Lake showed an upward trend. Temperature,glacier and permafrost melting,and solar radiation were identified as the main natural factors influencing lake area,with contribution rates of 31.0%,29.4%,and 15.5%,respectively. In terms of human activities,potash mining emerged as a major driver of lake area changes after 2010. Based on predictions by the auto-regressive moving average model (ARIMA),the lake area is projected to decline to 302.78 km2 by 2030.
Keywords:random forest;
lake water volume estimation;
correlation analysis;
lake area prediction;
East Dabuxun Lake
ZHOU Yujing, JIN Xiaomei, MA Jingxuan, LI Qing. Variations in area and water volume of East Dabuxun Lake,Qinghai Province[J]. Remote Sensing for Land & Resources, 2025, 37(5): 15-23 doi:10.6046/zrzyyg.2024195
目前,常用的湖泊面积光学遥感提取方法包含水体指数法与分类法[5-6]。许多学者提出了如归一化水体指数(normalized difference water index,NDWI)、改进的归一化水体指数(modified normalized difference water index,MNDWI)和增强型水体指数(enhanced water index,EWI)等水体指数,常应用于湖泊水面和流域水体的提取;也有学者提出了支持向量机法、决策树法等分类法来识别水域。但由于这些方法通常需要人工设置阈值或分类规则,难以充分捕捉到复杂的地物特征和空间信息。而随机森林(random forest,RF)作为机器学习领域的一种算法,因其对数据中的噪声和异常值更具鲁棒性,能够捕捉数据中的复杂关系,且分类精度高[7-8],已成为遥感湖泊识别算法中非常适用的方法[7,9]。此外,随着测高雷达卫星技术的发展,国内外诸多学者利用ICESat和CryoSat等数据反演湖泊的长时序水位变化,进而刻画湖泊水面-水位关系和估算水量变化,为缺乏水位观测资料的湖泊水量研究提供了技术支持[10-12]。
数据信息如表1所示。光学遥感数据分别来自GEE提供的Landsat5,7,8,9和Sentinel-2数据集;水位数据分别来自美国冰雪数据中心(National Snow and Ice Data Center,NSIDC)和欧洲航天局(European Space Agency,ESA)的ICESat/GLA 14与CryoSat-2/SIRAL GDR;驱动因素分析使用的气温、降水量、风速、太阳辐射、相对湿度和土壤湿度数据均来自欧洲中期天气预报中心(European Centre for Medium-Range Weather Forecasts,ECMWF);人类活动中的钾肥产量(折纯)数据来源于《格尔木市国民经济和社会发展统计公报》。此外,本文采用GEE提供的欧盟委员会联合研究中心(Joint Research Centre,JRC)水体数据集(V1.4)作为湖泊面积对比验证数据集[17],通过计算一致性比例[18]以说明计算所得湖泊面积的准确性。相较于传统实测数据验证,大数据具有时间序列长、稳定性好等优势。该数据集是由JRC基于数百万张Landsat5,7,8影像开发而成的,其中永久性水体在全球和中国区域的精度分别为93.54%和86.81%,目前已被广泛用于湖泊流域大数据研究及验证[19]。
对1987—2021年6—9月东达布逊湖面积时间序列进行差分平稳,建立ARIMA (1,1,1)模型。其残差及参数检验结果表明拟合结果有效,并且在赤池信息量(Akaike information criterion,AIC)和贝叶斯信息量(Bayesian information criterion,BIC)下与其他多个模型对比,该模型为相对最优模型(表4)。
Lakes are important water resources on the Mongolian Plateau (MP) for human's livelihood and production as well as maintaining ecosystem services. Previous studies, based on the Landsat-based analyses at epoch scale and visual interpretation approach, have reported a significant loss in the lake areas and numbers, especially from the late 1990s to 2010. Given the remarkable inter- and infra-annual variations of lakes in the aril and semi-arid region, a comprehensive picture of annual lake dynamics is needed. Here we took advantages of the power of all the available Landsat images and the cloud computing platform Google Earth Engine (GEE) to map water body for each scene, and then extracted lakes by post-processing including raster-to-vector conversion and separation of lakes and rivers. Continuous dynamics of the lakes over 1 km2 was monitored annually on the MP from 1991 to 2017. We found a significant shrinkage in the lake areas and numbers of the MP from 1991 to 2009, then the decreasing lakes on the MP have recovered since circa 2009. Specifically, Inner Mongolia of China experienced more dramatic lake variations than Mongolia. A few administrative regions with huge lakes, including Hulunbuir and Xilin Gol in Inner Mongolia and Ubsa in Mongolia, dominated the lake area variations in the study area, suggesting that the prior treatments on these major lakes would be critical for water management on the MP. The varied drivers of lake variations in different regions showed the complexity of factors impacting lakes. While both natural and anthropogenic factors significantly affected lake dynamics before 2009, precipitation played increasingly important rule for the recovery of lakes on the MP after 2009. J.V, (C) 2019 Elsevier B.V.
LiX S, ZhangD H, JiangC C, et al.
Comparison of lake area extraction algorithms in Qinghai Tibet Plateau leveraging Google Earth Engine and Landsat-9 data
Long-term spatiotemporal variation in water area of the Xin’anjiang Reservoir(Lake Qiandao)from 1987 to 2022 and its relationships with water level and water storage
[J]. Journal of Lake Sciences, 2024, 36(3):913-926.
Research on the impact of human activities on global climate change is not only the frontier of the discipline, but also the hotspot and difficulty. At present, the research focuses on the climate phenomena of urban impervious surface (IS), such as heat island and rain island effects, while the research on other climate factors has not yet to be carried out. Based on the Global IS Data Set (GAIA) and the China Region High-resolution Surface Meteorological Element Data Set, though the Mann-Kendall (M-K) mutation test and Bayesian model, this paper studied the spatiotemporal variation of IS, the relationship between meteorological elements and IS, and abnormal climatic phenomena for the 34 lakeside urban agglomerations in the Central Yunnan Plateau controlled by the subtropical high from 1985 to 2018. The results showed that the IS area increased by 227.56% compared with that in 1985, with the highest growth rate (89.85 km2/a) in the past 10 years (2007-2018), mainly expanding in S, NE, SE and W directions. During the past 34 years, the climate of the Central Yunnan urban agglomeration experienced three rapid transformation stages: cold and humid (1985-1995), warm and humid (1996-2006), and warm and dry (2007-2018). Compared with the permeable surface, IS had some significant climatic phenomena, including heat island (air temperature increases by 0.63 ℃, long wave increases by 4.49 W m²), rain island (precipitation increased by 38.27 mm), wet island (specific humidity increases by 0.51 g/kg), wind speed low island (wind speed decreased by 0.025 m/s) and air pressure high island (air pressure increased by 602.64 Pa). The spatial distribution of IS has a significant relationship with meteorological elements in a specific interval, such as long wave of 313~329 W m², specific humidity of 8.9~9.9 g/kg, air pressure of 76235~79946 Pa, short wave of 186~194 W m², precipitation of 840~876 mm and 876~998 mm, wind speed of 2.08~2.38 m/s and air temperature of 13.85~15.85 ℃. In that interval, meteorological elements respond significantly with the increase of the proportion of IS distribution. The impact of IS on air pressure and humidity has the abnormal characteristics of air pressure-temperature and humidity, which may be caused by subtropical high, elevation and large lakes (lake-land breeze).
Lakes over the Qinghai-Tibet Plateau are considered as the important indicators of regional climate variability. Since the mid-1990s, the expansion caused by the increasing precipitation due to the warming and humidifying environment and the accelerated melting of glacier and frozen soil has been the most prominent environmental change feature of Qinghai-Tibet Plateau. It is worth mentioning that the spatial distribution characteristics of lake water level changes are highly consistent with the precipitation changes in the affected areas of Westerlies and Indian monsoon zone. The harsh natural environment makes it difficult to achieve the field observations of inland lakes on the Qinghai-Tibet Plateau. Currently, the development of remote sensing technologies can overcome the above-mentioned limitations, which has become the main research means of lake change monitoring on the Qinghai-Tibet Plateau. Based on the remote sensing monitoring technologies and methods, this paper summarized the research progress on the aspects of lake extent extraction, water volume change, water environment and ice phenology. Some studies have applied multi-source remote sensing and hydrological models to quantitatively evaluate water balance in the basin scale. The results have shown that the main contribution factor of lake water increase in inland areas of Qinghai-Tibet Plateau was the increase of precipitation, while the contribution of glacier melting, frozen soil melting and other factors was relatively small. Currently, academic circles generally believe that the annual variation of precipitation is the main reason for the recent changes of lakes in Qinghai-Tibet Plateau, and the accelerated melting of glacier and frozen soil further accelerates the expansion of lakes or inhibits the contraction of some lakes. The previous research on the climate response mechanism of lake changes in the Qinghai-Tibet Plateau was mostly limited to the qualitative description of climate factors, such as precipitation, evaporation, temperature, wind speed and glacier melting, etc. Now, in the aspect of lake water balance, more and more researches are making progress in quantification. In the future, with the open sharing of more remote sensing data as well as the building of more hydrological and meteorological stations, better data conditions will be provided for the quantitative research on water balance of lakes on the Qinghai-Tibet Plateau.
The plateau lakes are sensitive indicators of climate change. The variation of lake area were monitored by using multi-source satellite data from 1976 to 2017 in the Qaidam Basin. The results show that the climate of the basin had been warming and humidifying in the 50 years, especially since 2000. The rising rate of annual average temperature had increased from east to west, and the increasing rate of precipitation had decreased from east to west. The Torsu Lake in the eastern part of the basin had less decreased from 1956 to 2017, with a rate of -0.41 km<sup>2</sup>·a<sup>-1</sup>. However, during the period of 2005-2017, the lake surface had expanded at a rate of 1.34 km<sup>2</sup>·a<sup>-1</sup>. The area of Xiaochaidan Lake in the basin middle had increased 19.87 km<sup>2</sup> as compared with that in the past 13 years; while the area of the western Gaskule Lake had increased first and then decreased. Climate change, variations of vegetation area and lake runoff and human activity are the main causes of lake area change in Qaidam Basin.
... 目前,常用的湖泊面积光学遥感提取方法包含水体指数法与分类法[5-6].许多学者提出了如归一化水体指数(normalized difference water index,NDWI)、改进的归一化水体指数(modified normalized difference water index,MNDWI)和增强型水体指数(enhanced water index,EWI)等水体指数,常应用于湖泊水面和流域水体的提取;也有学者提出了支持向量机法、决策树法等分类法来识别水域.但由于这些方法通常需要人工设置阈值或分类规则,难以充分捕捉到复杂的地物特征和空间信息.而随机森林(random forest,RF)作为机器学习领域的一种算法,因其对数据中的噪声和异常值更具鲁棒性,能够捕捉数据中的复杂关系,且分类精度高[7-8],已成为遥感湖泊识别算法中非常适用的方法[7,9].此外,随着测高雷达卫星技术的发展,国内外诸多学者利用ICESat和CryoSat等数据反演湖泊的长时序水位变化,进而刻画湖泊水面-水位关系和估算水量变化,为缺乏水位观测资料的湖泊水量研究提供了技术支持[10-12]. ...
水体遥感指数研究进展
1
2021
... 目前,常用的湖泊面积光学遥感提取方法包含水体指数法与分类法[5-6].许多学者提出了如归一化水体指数(normalized difference water index,NDWI)、改进的归一化水体指数(modified normalized difference water index,MNDWI)和增强型水体指数(enhanced water index,EWI)等水体指数,常应用于湖泊水面和流域水体的提取;也有学者提出了支持向量机法、决策树法等分类法来识别水域.但由于这些方法通常需要人工设置阈值或分类规则,难以充分捕捉到复杂的地物特征和空间信息.而随机森林(random forest,RF)作为机器学习领域的一种算法,因其对数据中的噪声和异常值更具鲁棒性,能够捕捉数据中的复杂关系,且分类精度高[7-8],已成为遥感湖泊识别算法中非常适用的方法[7,9].此外,随着测高雷达卫星技术的发展,国内外诸多学者利用ICESat和CryoSat等数据反演湖泊的长时序水位变化,进而刻画湖泊水面-水位关系和估算水量变化,为缺乏水位观测资料的湖泊水量研究提供了技术支持[10-12]. ...
Continuous monitoring of lake dynamics on the Mongolian Plateau using all available Landsat imagery and Google Earth Engine
1
2019
... 目前,常用的湖泊面积光学遥感提取方法包含水体指数法与分类法[5-6].许多学者提出了如归一化水体指数(normalized difference water index,NDWI)、改进的归一化水体指数(modified normalized difference water index,MNDWI)和增强型水体指数(enhanced water index,EWI)等水体指数,常应用于湖泊水面和流域水体的提取;也有学者提出了支持向量机法、决策树法等分类法来识别水域.但由于这些方法通常需要人工设置阈值或分类规则,难以充分捕捉到复杂的地物特征和空间信息.而随机森林(random forest,RF)作为机器学习领域的一种算法,因其对数据中的噪声和异常值更具鲁棒性,能够捕捉数据中的复杂关系,且分类精度高[7-8],已成为遥感湖泊识别算法中非常适用的方法[7,9].此外,随着测高雷达卫星技术的发展,国内外诸多学者利用ICESat和CryoSat等数据反演湖泊的长时序水位变化,进而刻画湖泊水面-水位关系和估算水量变化,为缺乏水位观测资料的湖泊水量研究提供了技术支持[10-12]. ...
Comparison of lake area extraction algorithms in Qinghai Tibet Plateau leveraging Google Earth Engine and Landsat-9 data
2
2022
... 目前,常用的湖泊面积光学遥感提取方法包含水体指数法与分类法[5-6].许多学者提出了如归一化水体指数(normalized difference water index,NDWI)、改进的归一化水体指数(modified normalized difference water index,MNDWI)和增强型水体指数(enhanced water index,EWI)等水体指数,常应用于湖泊水面和流域水体的提取;也有学者提出了支持向量机法、决策树法等分类法来识别水域.但由于这些方法通常需要人工设置阈值或分类规则,难以充分捕捉到复杂的地物特征和空间信息.而随机森林(random forest,RF)作为机器学习领域的一种算法,因其对数据中的噪声和异常值更具鲁棒性,能够捕捉数据中的复杂关系,且分类精度高[7-8],已成为遥感湖泊识别算法中非常适用的方法[7,9].此外,随着测高雷达卫星技术的发展,国内外诸多学者利用ICESat和CryoSat等数据反演湖泊的长时序水位变化,进而刻画湖泊水面-水位关系和估算水量变化,为缺乏水位观测资料的湖泊水量研究提供了技术支持[10-12]. ...
Testing accuracy of land cover classification algorithms in the Qilian Mountains based on GEE cloud platform
1
2021
... 目前,常用的湖泊面积光学遥感提取方法包含水体指数法与分类法[5-6].许多学者提出了如归一化水体指数(normalized difference water index,NDWI)、改进的归一化水体指数(modified normalized difference water index,MNDWI)和增强型水体指数(enhanced water index,EWI)等水体指数,常应用于湖泊水面和流域水体的提取;也有学者提出了支持向量机法、决策树法等分类法来识别水域.但由于这些方法通常需要人工设置阈值或分类规则,难以充分捕捉到复杂的地物特征和空间信息.而随机森林(random forest,RF)作为机器学习领域的一种算法,因其对数据中的噪声和异常值更具鲁棒性,能够捕捉数据中的复杂关系,且分类精度高[7-8],已成为遥感湖泊识别算法中非常适用的方法[7,9].此外,随着测高雷达卫星技术的发展,国内外诸多学者利用ICESat和CryoSat等数据反演湖泊的长时序水位变化,进而刻画湖泊水面-水位关系和估算水量变化,为缺乏水位观测资料的湖泊水量研究提供了技术支持[10-12]. ...
Dynamic change analysis of surface water in the Yangtze River Basin based on MODIS products
1
2018
... 目前,常用的湖泊面积光学遥感提取方法包含水体指数法与分类法[5-6].许多学者提出了如归一化水体指数(normalized difference water index,NDWI)、改进的归一化水体指数(modified normalized difference water index,MNDWI)和增强型水体指数(enhanced water index,EWI)等水体指数,常应用于湖泊水面和流域水体的提取;也有学者提出了支持向量机法、决策树法等分类法来识别水域.但由于这些方法通常需要人工设置阈值或分类规则,难以充分捕捉到复杂的地物特征和空间信息.而随机森林(random forest,RF)作为机器学习领域的一种算法,因其对数据中的噪声和异常值更具鲁棒性,能够捕捉数据中的复杂关系,且分类精度高[7-8],已成为遥感湖泊识别算法中非常适用的方法[7,9].此外,随着测高雷达卫星技术的发展,国内外诸多学者利用ICESat和CryoSat等数据反演湖泊的长时序水位变化,进而刻画湖泊水面-水位关系和估算水量变化,为缺乏水位观测资料的湖泊水量研究提供了技术支持[10-12]. ...
Monitoring water level and volume changes of lakes and reservoirs in the Yellow River Basin using ICESat-2 laser altimetry and Google Earth Engine
1
2022
... 目前,常用的湖泊面积光学遥感提取方法包含水体指数法与分类法[5-6].许多学者提出了如归一化水体指数(normalized difference water index,NDWI)、改进的归一化水体指数(modified normalized difference water index,MNDWI)和增强型水体指数(enhanced water index,EWI)等水体指数,常应用于湖泊水面和流域水体的提取;也有学者提出了支持向量机法、决策树法等分类法来识别水域.但由于这些方法通常需要人工设置阈值或分类规则,难以充分捕捉到复杂的地物特征和空间信息.而随机森林(random forest,RF)作为机器学习领域的一种算法,因其对数据中的噪声和异常值更具鲁棒性,能够捕捉数据中的复杂关系,且分类精度高[7-8],已成为遥感湖泊识别算法中非常适用的方法[7,9].此外,随着测高雷达卫星技术的发展,国内外诸多学者利用ICESat和CryoSat等数据反演湖泊的长时序水位变化,进而刻画湖泊水面-水位关系和估算水量变化,为缺乏水位观测资料的湖泊水量研究提供了技术支持[10-12]. ...
... 目前,常用的湖泊面积光学遥感提取方法包含水体指数法与分类法[5-6].许多学者提出了如归一化水体指数(normalized difference water index,NDWI)、改进的归一化水体指数(modified normalized difference water index,MNDWI)和增强型水体指数(enhanced water index,EWI)等水体指数,常应用于湖泊水面和流域水体的提取;也有学者提出了支持向量机法、决策树法等分类法来识别水域.但由于这些方法通常需要人工设置阈值或分类规则,难以充分捕捉到复杂的地物特征和空间信息.而随机森林(random forest,RF)作为机器学习领域的一种算法,因其对数据中的噪声和异常值更具鲁棒性,能够捕捉数据中的复杂关系,且分类精度高[7-8],已成为遥感湖泊识别算法中非常适用的方法[7,9].此外,随着测高雷达卫星技术的发展,国内外诸多学者利用ICESat和CryoSat等数据反演湖泊的长时序水位变化,进而刻画湖泊水面-水位关系和估算水量变化,为缺乏水位观测资料的湖泊水量研究提供了技术支持[10-12]. ...
ICESat-2数据监测青藏高原湖泊2018—2021年水位变化
1
2022
... 目前,常用的湖泊面积光学遥感提取方法包含水体指数法与分类法[5-6].许多学者提出了如归一化水体指数(normalized difference water index,NDWI)、改进的归一化水体指数(modified normalized difference water index,MNDWI)和增强型水体指数(enhanced water index,EWI)等水体指数,常应用于湖泊水面和流域水体的提取;也有学者提出了支持向量机法、决策树法等分类法来识别水域.但由于这些方法通常需要人工设置阈值或分类规则,难以充分捕捉到复杂的地物特征和空间信息.而随机森林(random forest,RF)作为机器学习领域的一种算法,因其对数据中的噪声和异常值更具鲁棒性,能够捕捉数据中的复杂关系,且分类精度高[7-8],已成为遥感湖泊识别算法中非常适用的方法[7,9].此外,随着测高雷达卫星技术的发展,国内外诸多学者利用ICESat和CryoSat等数据反演湖泊的长时序水位变化,进而刻画湖泊水面-水位关系和估算水量变化,为缺乏水位观测资料的湖泊水量研究提供了技术支持[10-12]. ...
High-resolution mapping of global surface water and its long-term changes
1
2016
... 数据信息如表1所示.光学遥感数据分别来自GEE提供的Landsat5,7,8,9和Sentinel-2数据集;水位数据分别来自美国冰雪数据中心(National Snow and Ice Data Center,NSIDC)和欧洲航天局(European Space Agency,ESA)的ICESat/GLA 14与CryoSat-2/SIRAL GDR;驱动因素分析使用的气温、降水量、风速、太阳辐射、相对湿度和土壤湿度数据均来自欧洲中期天气预报中心(European Centre for Medium-Range Weather Forecasts,ECMWF);人类活动中的钾肥产量(折纯)数据来源于《格尔木市国民经济和社会发展统计公报》.此外,本文采用GEE提供的欧盟委员会联合研究中心(Joint Research Centre,JRC)水体数据集(V1.4)作为湖泊面积对比验证数据集[17],通过计算一致性比例[18]以说明计算所得湖泊面积的准确性.相较于传统实测数据验证,大数据具有时间序列长、稳定性好等优势.该数据集是由JRC基于数百万张Landsat5,7,8影像开发而成的,其中永久性水体在全球和中国区域的精度分别为93.54%和86.81%,目前已被广泛用于湖泊流域大数据研究及验证[19]. ...
1990—2021年蒙古高原年度丰水期水体数据集
1
2023
... 数据信息如表1所示.光学遥感数据分别来自GEE提供的Landsat5,7,8,9和Sentinel-2数据集;水位数据分别来自美国冰雪数据中心(National Snow and Ice Data Center,NSIDC)和欧洲航天局(European Space Agency,ESA)的ICESat/GLA 14与CryoSat-2/SIRAL GDR;驱动因素分析使用的气温、降水量、风速、太阳辐射、相对湿度和土壤湿度数据均来自欧洲中期天气预报中心(European Centre for Medium-Range Weather Forecasts,ECMWF);人类活动中的钾肥产量(折纯)数据来源于《格尔木市国民经济和社会发展统计公报》.此外,本文采用GEE提供的欧盟委员会联合研究中心(Joint Research Centre,JRC)水体数据集(V1.4)作为湖泊面积对比验证数据集[17],通过计算一致性比例[18]以说明计算所得湖泊面积的准确性.相较于传统实测数据验证,大数据具有时间序列长、稳定性好等优势.该数据集是由JRC基于数百万张Landsat5,7,8影像开发而成的,其中永久性水体在全球和中国区域的精度分别为93.54%和86.81%,目前已被广泛用于湖泊流域大数据研究及验证[19]. ...
1987—2022年新安江水库(千岛湖)水面面积时空变化及其与水位、蓄水量的响应关系
1
2024
... 数据信息如表1所示.光学遥感数据分别来自GEE提供的Landsat5,7,8,9和Sentinel-2数据集;水位数据分别来自美国冰雪数据中心(National Snow and Ice Data Center,NSIDC)和欧洲航天局(European Space Agency,ESA)的ICESat/GLA 14与CryoSat-2/SIRAL GDR;驱动因素分析使用的气温、降水量、风速、太阳辐射、相对湿度和土壤湿度数据均来自欧洲中期天气预报中心(European Centre for Medium-Range Weather Forecasts,ECMWF);人类活动中的钾肥产量(折纯)数据来源于《格尔木市国民经济和社会发展统计公报》.此外,本文采用GEE提供的欧盟委员会联合研究中心(Joint Research Centre,JRC)水体数据集(V1.4)作为湖泊面积对比验证数据集[17],通过计算一致性比例[18]以说明计算所得湖泊面积的准确性.相较于传统实测数据验证,大数据具有时间序列长、稳定性好等优势.该数据集是由JRC基于数百万张Landsat5,7,8影像开发而成的,其中永久性水体在全球和中国区域的精度分别为93.54%和86.81%,目前已被广泛用于湖泊流域大数据研究及验证[19]. ...
Random forest classifier for remote sensing classification


