

0 引言
黑土地是我国重要的耕地资源,黑土地的合理利用直接关系到我国的粮食安全。高标准农田建设是巩固和提高粮食生产能力、保障国家粮食安全和推动农业高质量发展的关键举措[1]。《全国高标准农田建设规划(2021—2030年)》提出,高标准农田建设要以保障粮食产能为基础,产能提升与绿色发展相协调。高标准农田建设不只局限于高标准农田数量增长和质量提升,还需要进一步考虑周边生态环境的协调性[2-3]。在东北黑土区,大量耕地分布在漫川漫岗地区,农田防护林建设水平参差不齐,不同地区黑土地抗风蚀、水蚀的能力不同,很多地区的黑土层出现“变薄”“变瘦”的现象[4-
本文以黑龙江省嫩江市为研究区,从耕地本身地形条件和周边生态环境状况2个方面,根据嫩江市耕地及其周边生态环境的特点,综合考虑地形部位、周边生态用地状况等因素,构建耕地生态防护能力综合评价模型,分析嫩江市耕地生态防护能力,并结合当地政策文件对评价结果进行验证,以期为遏制耕地侵蚀、明确研究区耕地生态建设方向、提高耕地生产力提供科学参考。
1 研究区概况与数据源
1.1 研究区概况
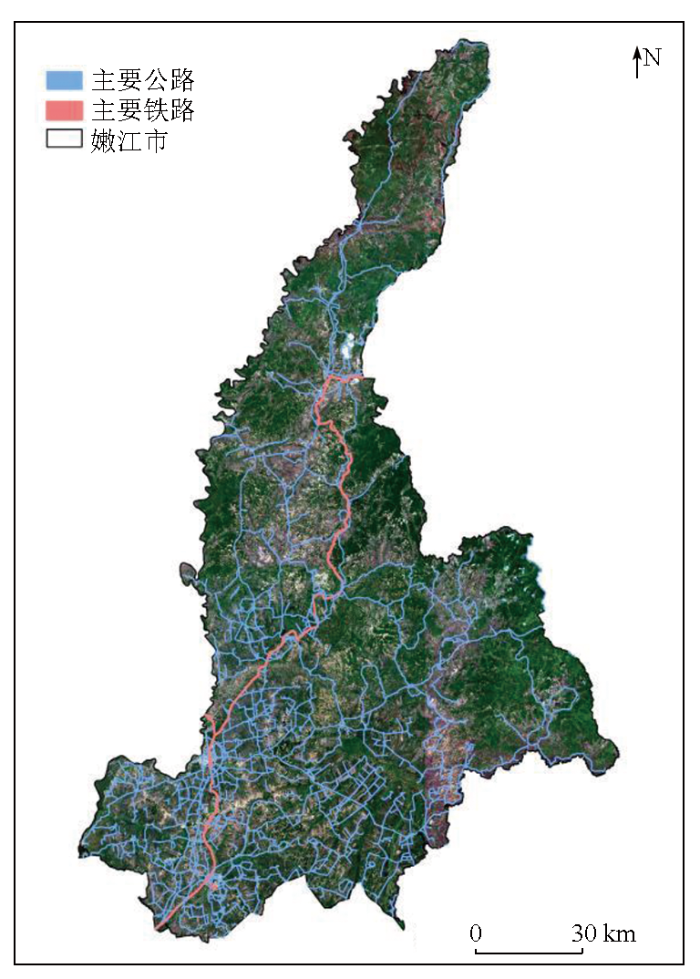
黑龙江省嫩江市位于嫩江流域上游(图1),地理范围为124°44'30″~126°49'30″E,48°42'35″~51°00'05″N,总面积约1.52万km2,耕地面积约1 146万亩①(① 1亩≈666.67 m2),其中旱地1 144万亩。嫩江市北依伊勒呼里山,东接小兴安岭,西邻嫩江,南连松嫩平原,是“国家重要商品粮基地”“农业产业化基地”以及“产粮大县(市)”。该市属寒温带大陆性季风气候,年平均气温在-0.4~3.2 ℃之间,海拔193~729.7 m,地势北高南低、东高西低。典型土壤类型包括暗棕壤、黑土、火山灰土等,主要种植作物有玉米、大豆等。
图1
1.2 数据源
本文数据主要包括嫩江市第三次全国国土调查数据、2019年6月按月合成的Sentinel-2遥感影像、来源于ALOS PALSAR数据集的12.5 m分辨率的数字高程模型(digital elevation model,DEM)数据。
2 研究方法
2.1 技术路线
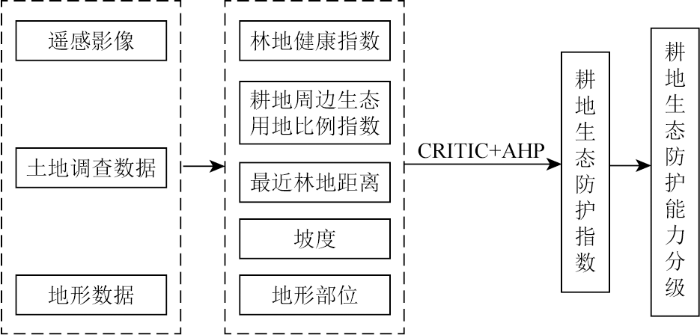
本文基于研究区国土调查数据、DEM数据和遥感影像数据,从地形地貌、耕地周边生态用地分布状况、防护林生长状况等方面,构建林地健康指数、耕地周边生态用地比例指数、最近林地距离、坡度和地形部位等指标,对耕地生态防护能力进行综合评价,通过标准间相关性衡量指标的重要性(criteria importance through intercrieria correlation,CRITIC)和层次分析法(analytic hierarchy process,AHP)综合确定各评价指标权重。本文技术路线如图2所示。
图2
2.2 耕地最近林地健康指数计算
根据嫩江市的特点,改进遥感生态指数(remote sensing based ecological index,RSEI)构建林地健康指数。RSEI是由绿度、湿度、干度、热度4个因子通过主成分分析构建的综合生态指标,该指数在大尺度的生态环境质量评价中广泛应用[14
式中: WET为湿度指数; SI为土壤指数; B1为沿海和气溶胶波段反射率; B2为蓝波段反射率; B4为红波段反射率; B5—B7为红边波段反射率; B8和B8a为近红外波段反射率; B9为水蒸气波段反射率; B10—B12为短波红外波段反射率。
2.3 坡度和地形部位计算
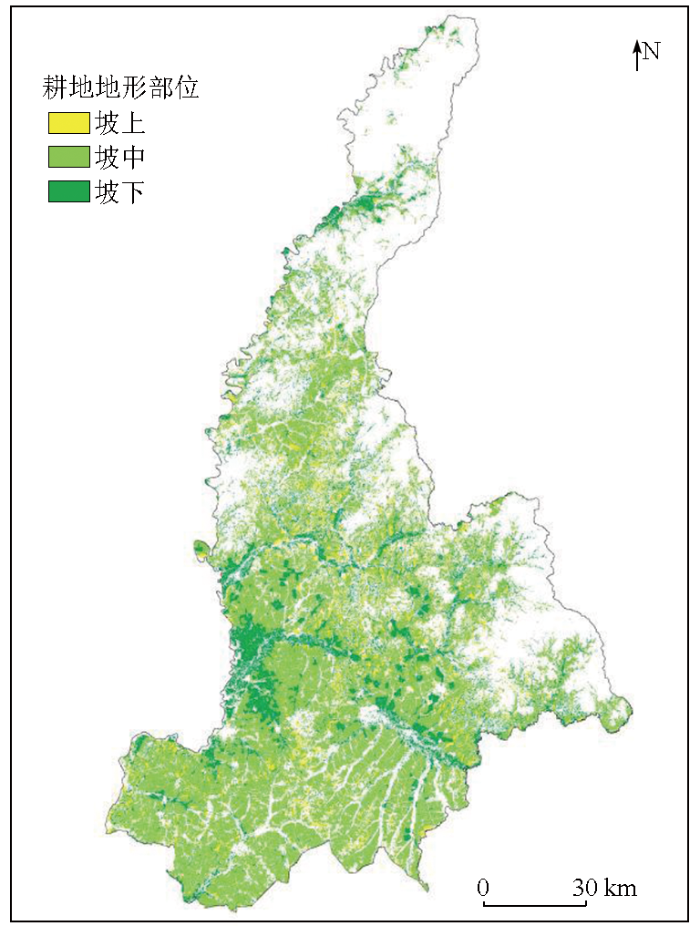
本文通过研究区12.5 m分辨率的DEM,计算得到耕地地块质心所在位置的坡度,代表整个地块的平均坡度。耕地地形部位指坡耕地地块所在位置在坡面上所处的位置,以地形部位指数(topographic position index,TPI)表示,分为坡上、坡中、坡下。对于坡度小于2°的耕地默认为平地,抗水蚀能力最强,TPI取最小值。TPI计算公式为[20
式中: Zi为i点的高程值;
在已有研究中一般将TPI≤-0.5SD(SD为该区域地形起伏度的标准差[22-23])的区域定义为坡下,(-0.5SD,0.5SD)的区域为坡中,≥0.5SD的区域为坡上。TPI越大,则认为耕地越靠近坡顶,受到水力侵蚀的风险越大。计算TPI时,首先要确定最佳计算窗口的大小,一般地形起伏度最大的窗口即为最佳窗口。在确定最佳计算窗口时,采用均值变点法。其中变点指: 设{Xt,t =1,2,…,N}为非线性系统的输出,其系统模型或输出序列在某时刻突然变化,该时刻即为变点,变点所对应的窗口大小即为最佳窗口。均值变点法计算过程为: 令i=2,3,…,N,对每个i将样本分为X1,X2,…,
式中: Si为两段样本的离差平方和之和;
2.4 耕地周边生态用地分布状况
耕地周边林地和草地等生态防护用地分布状况决定了抗风蚀、水蚀的能力,已有研究用耕地距林地的最近距离来反映耕地周边生态用地分布状况,但这种方法忽略了耕地周边林地、草地分布状况[24]。因此,本文用耕地距林地的最近距离和耕地周边林地、草地面积比例来反映。首先要确定耕地周边的范围,根据已有研究,农田周边林地有效防护范围约为20倍树高。经过实地调查,研究区农田周边林地树高普遍在15~20 m,考虑到缓冲区是根据耕地边缘设置,缓冲区宽度应取树高下限,即15 m×20,即300 m[25-
3 试验结果与分析
3.1 单因子评价结果
3.1.1 坡度和地形部位评价
由研究区DEM生成耕地坡度,如图3所示。嫩江市耕地坡度整体以10°以下的缓坡为主,其中嫩江市西部耕地坡度较小,是坡度为0°~2°耕地的主要分布区域,坡度较大的耕地主要分布于嫩江市东部和北部。从数量上看,嫩江市耕地坡度在[0, 2)°,[2, 6)°,[6, 10)°,[10, 15)°和≥15°这5个等级的耕地比例分别为14.48%,80.27%,4.91%,0.33%和0.02%,计算结果符合嫩江市耕地广泛分布于漫坡、漫岗地带的特点。
图3
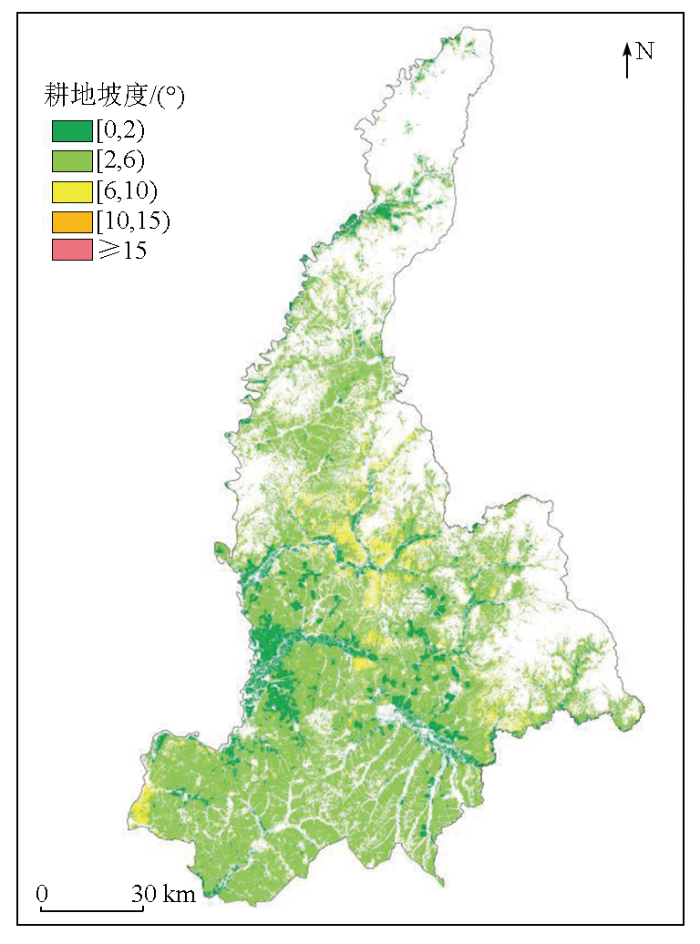
图4
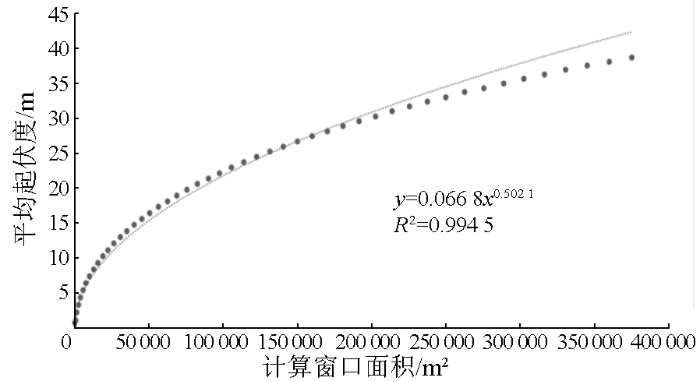
图4
平均起伏度与计算窗口面积拟合特征
Fig.4
Fitting characteristics between average undulation and calculation window area
图5
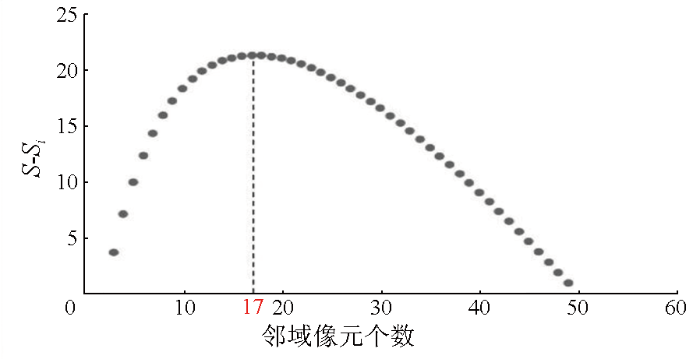
图5
S-Si随邻域像元个数变化的特征
Fig.5
Characteristics of S-Si changimg with the number of neighboring pixels
图6
3.1.2 最近林地健康指数
基于研究区2019年6月按月合成的Sentinel-2遥感影像,计算得到耕地最近林地健康指数,见图7。嫩江市整体耕地最近林地健康指数差异较大。
图7
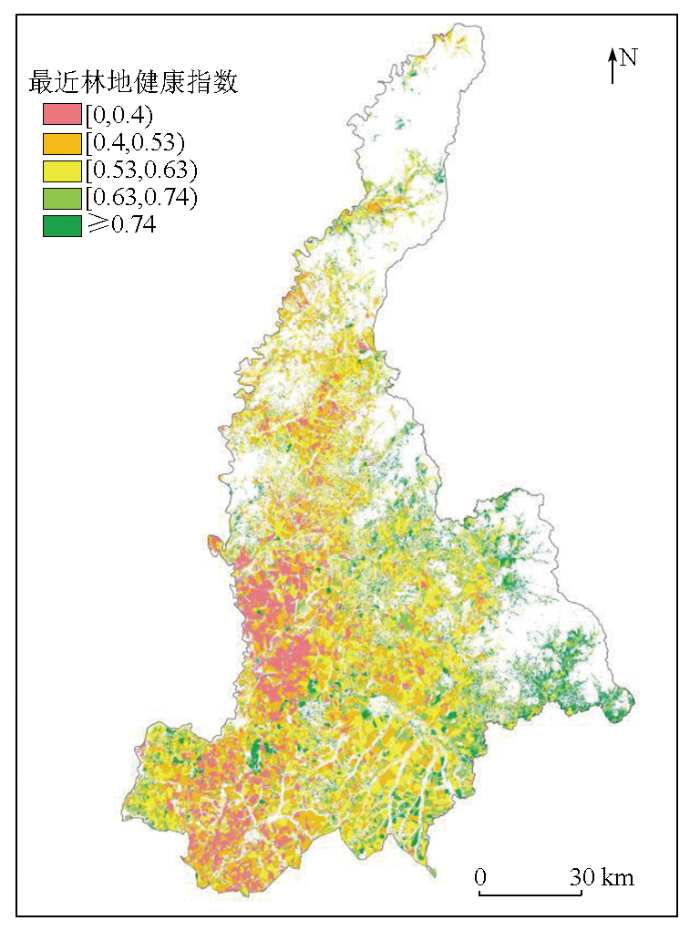
图7
嫩江市耕地最近林地健康指数
Fig.7
Forest health index of the nearest neighboring cultivated land in Nenjiang City
从分布上看,嫩江市东部的耕地最近林地健康水平显著高于嫩江市西部; 从数量上看,耕地最近林地健康指数在0.4以下的耕地占比最大,达到了29.53%。嫩江市耕地周边防护林建设水平较低。
3.1.3 耕地周边生态用地分布状况
如图8所示,通过耕地近邻分析,得到距离耕地最近的林地地块。嫩江市耕地最近林地距离普遍在10 m以内,距林地距离较远的耕地大多分布在坡度较小的平原地带,如西部和东部地势平坦区域的部分耕地周边缺乏防护林保护,因此耕地最近林地距离较大。
图8
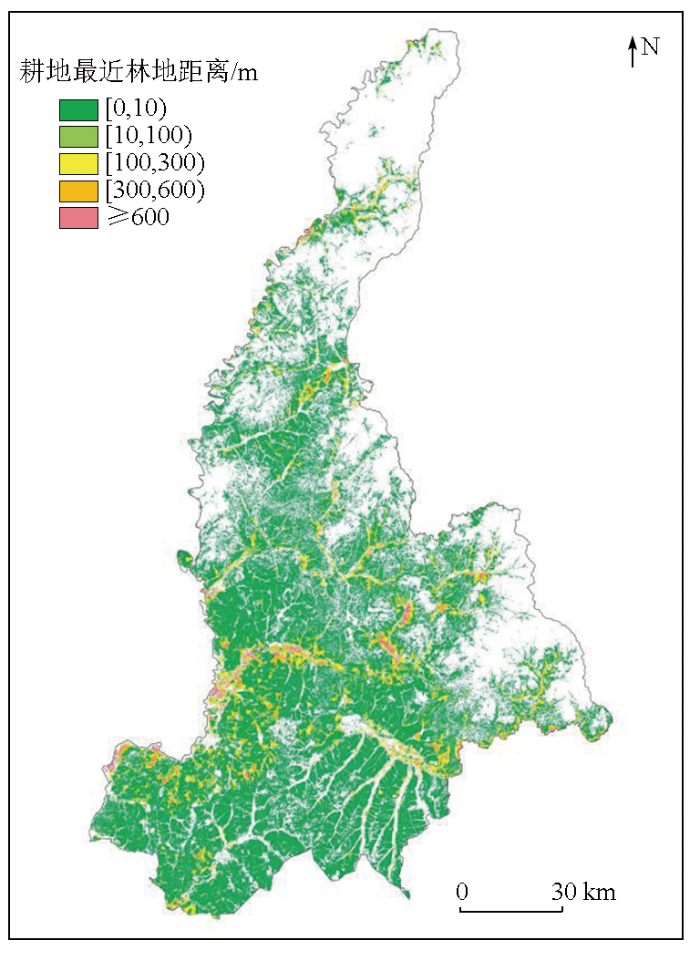
图8
嫩江市耕地最近林地距离
Fig.8
Distance to nearest forest for cultivated land in Nenjiang City
在耕地周边300 m范围内计算林地和草地面积,二者按照2∶1的权重计算得到耕地周边生态用地比例指数(图9)。嫩江市耕地周边生态用地比例整体较低,大部分在0.12以下,中等比例的耕地数量也相对较多; 在空间分布上整体呈现北高南低,东高西低的态势,中等比例的耕地分布较为分散。
图9
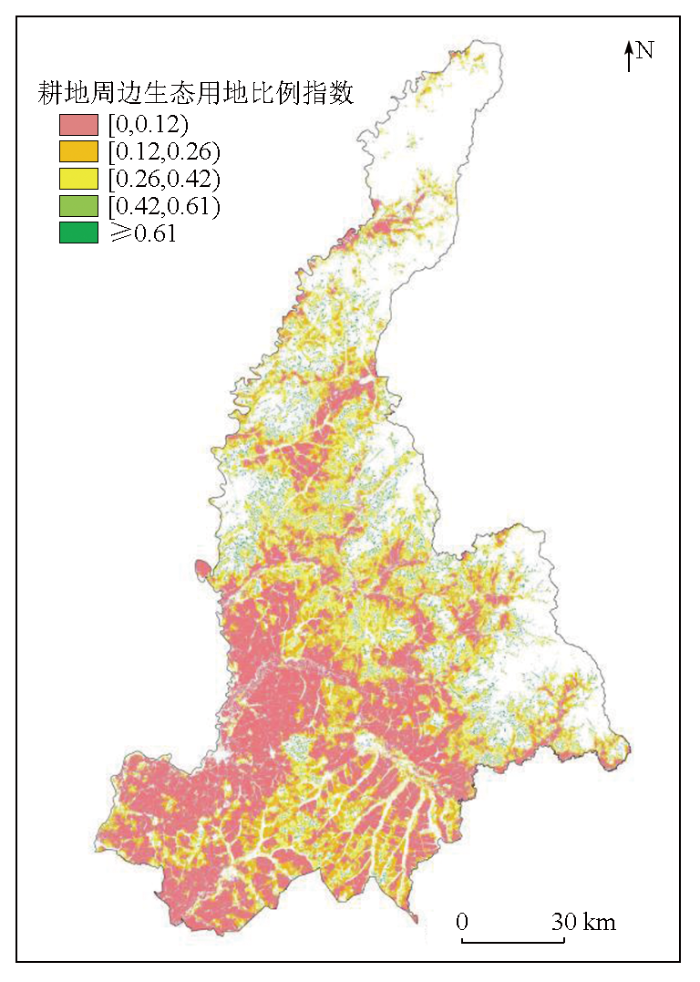
图9
嫩江市耕地周边生态用地比例指数
Fig.9
Index of the proportion of ecological land around cultivated land in Nenjiang City
3.2 耕地生态防护等级评价
经AHP法计算得到最近林地距离、缓冲区内林地面积、林地健康指数、地形部位和坡度的权重分别为0.09,0.18,0.07,0.36和0.30; 经CRITIC法计算得到的权重分别为0.11,0.28,0.19,0.29和0.13。2种方法求平均得到各指标最终权重值分别为0.10,0.23,0.13,0.32和0.22。
基于各指标综合权重,计算嫩江市耕地的生态防护指数,取值范围在0~1之间,使用相等间隔法将耕地生态防护指数分为5个等级。从图10可以看出,嫩江市耕地的生态防护等级主要以中等和中低等为主,低等和高等的耕地较少。从空间分布上来看,嫩江市各生态防护等级的耕地呈交错分布,其中,中高等和高等的耕地主要分布在嫩江市东南部。评价结果统计如表1所示,从耕地生态防护等级面积来看,耕地生态防护等级为中等的耕地面积最大,为3 490.78 km2,占嫩江市耕地面积的45.28%,耕地生态防护等级为高等的耕地面积为162.49 km2,仅占嫩江市耕地面积的2.11%。综合来看,嫩江市总体耕地生态防护水平处于中等偏下,耕地生态防护能力等级较高的耕地多分布于嫩江中部地势平坦、地形部位靠下且生态用地密集分布的区域; 嫩江市西南部耕地生态防护能力普遍较低,这一地区耕地周边生态用地比例不足且耕地周边林地的健康状况等级整体低于嫩江市东部和北部。嫩江市需进一步加强耕地周边生态防护建设,提升耕地生态防护能力。
图10
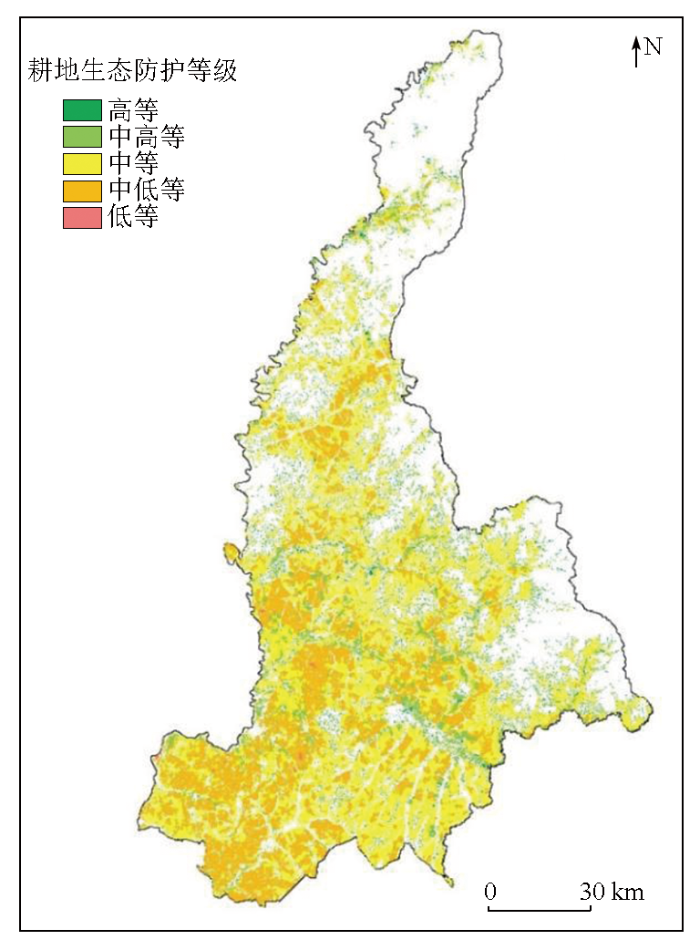
图10
嫩江市耕地生态防护等级图
Fig.10
Ecological protection grade of cultivated land in Nenjiang City
表1 嫩江市耕地生态防护等级整体评价结果
Tab.1
| 耕地生态防护等级 | 面积/km2 | 占比/% |
|---|---|---|
| 低等 | 10.62 | 0.14 |
| 中低等 | 2 637.05 | 34.21 |
| 中等 | 3 490.78 | 45.28 |
| 中高等 | 1 407.99 | 18.26 |
| 高等 | 162.49 | 2.11 |
3.3 耕地生态防护评价结果验证
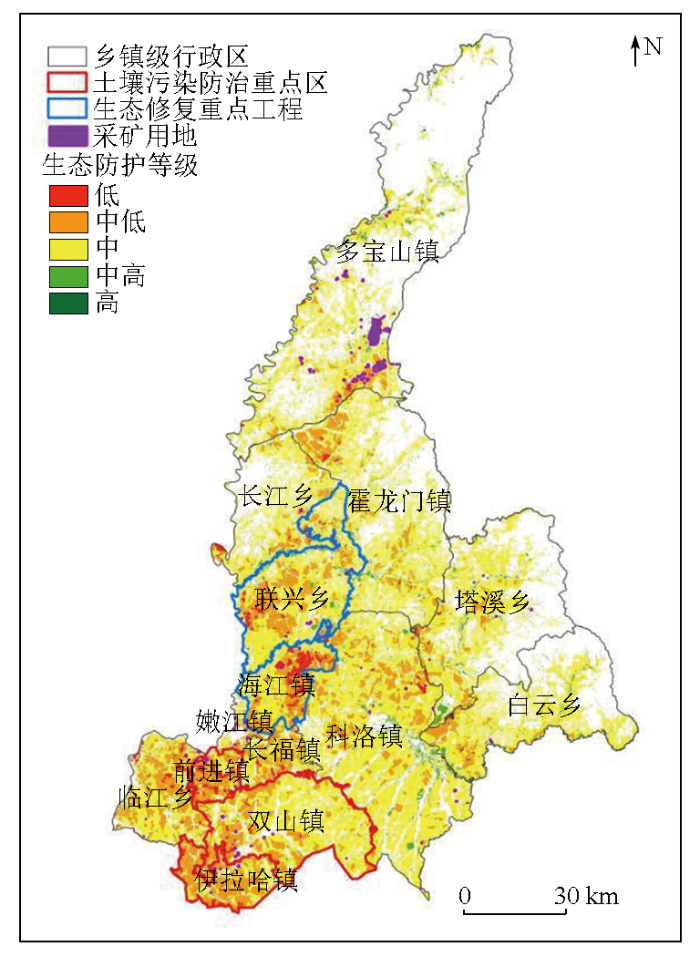
耕地生态防护评价是以耕地地块为单元进行分析,可以作为针对特定耕地地块建设和改造的参考,有助于实现耕地的精细化管理。而在验证时,为了将评价结果的空间分布与嫩江市国土空间规划、高标准农田建设的相关政策文件相对应,本文以行政边界作为约束,对嫩江市14个乡镇的生态防护评价结果进行验证,同时也能为嫩江市未来的耕地生态治理和区域规划建设提供科学依据。
根据《嫩江市国土空间总体规划(2021—2035年)》和《嫩江市土地利用总体规划(2006—2020年)》,嫩江市的前进镇、双山镇和伊拉哈镇属于土壤污染防治重点区域,该区域存在重金属污染物进入农田链条、粮食金属物超标等问题,导致土壤污染、耕地生态变差; 根据《嫩江市砂石土资源开发利用专项规划》,嫩江市的采矿区主要分布在多宝山镇、双山镇、伊拉哈镇、前进镇和联兴乡,采矿导致水土流失,破坏土壤质地,使得耕地生态防护等级降低。从图11可以看出,嫩江市的土壤污染防治重点区和采矿区与本文生态防护等级中低区域重合,间接证明了本文研究结果的合理性。同时,根据《嫩江市国土空间总体规划(2021—2035年)》,嫩江市将在海江镇和联兴乡等地设立生态修复重点工程,提升该区域的森林质量,加强黑土地保护,提高耕地质量。本文研究结果中海江镇和联兴乡存在较多生态防护等级低、中低区域,需加强该区域耕地周边生态防护建设,与嫩江市的规划相一致,从而间接验证了本文研究结果的科学性与合理性。
图11
已有研究中通常以耕地周边生态用地的距离反映耕地生态环境状况,以坡度反映耕地本身的抗侵蚀能力[33
根据耕地生态防护评价结果,嫩江市耕地生态防护等级以中等和中低等为主,整体耕地生态防护能力较低,易受风蚀、水蚀等影响。根据各单项指标评价结果,虽然耕地距林地距离普遍较近,但耕地周边生态用地占比普遍较低,且林地健康指数不高,表明嫩江市耕地周边生态用地建设水平仍然不足,需要加强周边林地、草地的建设和保护,尤其在坡度较大、地形部位偏上的地区,更要注重生态用地的建设和保护。
4 结论
本文以东北典型黑土分布区嫩江市为研究区,构建了嫩江市耕地生态防护能力指标体系和权重确定方法,从单个因子和综合评价,对嫩江市耕地生态防护能力进行全面评价,细化了耕地生态防护能力评价体系,明确了制约研究区耕地生态防护能力的主要因素,得出如下结论:
1)本文针对研究区特点,构建了包含林地健康指数、耕地周边生态用地比例指数、最近林地距离、坡度和地形部位等的耕地生态防护能力指标体系,采用CRITIC法和AHP法共同确定评价指标权重。
2)嫩江市耕地生态防护各单项指标中,耕地周边生态用地比例和林地健康指数较低,是导致研究区耕地生态防护能力偏低的主要原因。耕地生态防护综合评价等级整体处于中等偏下的水平,耕地生态防护等级为以中等、中低等为主,中高等和高等占比较少,耕地生态防护水平有较大提升空间。
各个因素对耕地生态安全的影响机制以及各因素之间的相互影响,以及耕地对各因素的响应机制及因素之间的相关关系,将是未来研究的重点。
参考文献
高标准农田建设:基于地表基质调查的解决方案
[J].
High-standard farmland construction:Ground substrate survey-based solutions
[J].
耕地数量、质量、生态三位一体保护内涵及路径探析
[J].
Analysis on trinity connotation and approach to protect quantity,quality and ecology of cultivated land
[J].
耕地数量、质量、生态三位一体综合监管体系研究
[J].
Trinity comprehensive regulatory system about quantity,quality and ecology of cultivated land
[J].
东北黑土地不同类型区主要特征及保护利用对策
[J].
Main characteristics and utilization countermeasures for black soils in different regions of Northeast China
[J].
Evaluation of traditional rain-fed agricultural terraces for soil erosion control through UAV observation in the middle mountain of Nepal
[J].
基于TOPSIS模型的典型黑土区耕地质量评价及土壤侵蚀耦合协调分析
[J].
Coupling coordination analysis of the quality evaluation of cultivated land and soil erosion in typical black soil areas using TOPSIS method
[J].
典型黑土区坡耕地融雪、风力、降雨复合侵蚀效应
[J].
DOI:10.13287/j.1001-9332.202309.013
[本文引用: 2]

研究多营力作用的坡耕地复合土壤侵蚀过程机理,可为精确防治农田土壤侵蚀提供科学指导。本研究基于东北黑土区坡耕地每年11月到次年10月冻融、融雪、风力、降雨侵蚀营力的季节性交替,利用不同侵蚀营力叠加的模拟试验,分析了坡耕地融雪(1、2 L·min-1)、风力(12 m·s-1)、降雨(100 mm·h-1)多营力叠加的复合侵蚀过程,讨论了各营力叠加的侵蚀效应。结果表明: 仅融雪侵蚀下,坡面融雪径流量的增加对坡面侵蚀量的影响大于其对坡面径流量的影响;融雪径流量从1 L·min-1增加到2 L·min-1,径流强度增加2.7倍,而侵蚀强度增加4.0倍。融雪-风力双营力叠加侵蚀下,前期融雪侵蚀对后期坡面风蚀有抑制作用,当融雪径流量从1 L·min-1增加到2 L·min-1,融雪侵蚀对风蚀量的抑制作用增强,导致后期风蚀量减小50%以上。前期风力侵蚀和融雪-风力叠加侵蚀均加剧了后期坡面降雨侵蚀,前期风力侵蚀导致后期坡面降雨侵蚀量增加24.5%,融雪-风力叠加作用在1和2 L·min-1融雪径流量下使后期坡面降雨侵蚀量分别增加132.8%和465.4%。多营力叠加的复合侵蚀量并非相应的单营力侵蚀量之和,还存在各营力叠加的促进或抑制效应。融雪-风力叠加的侵蚀效应为抑制效应,风力-降雨双营力叠加和融雪-风力-降雨多营力叠加的侵蚀效应为促进效应。
Compound erosion effect of snowmelt,wind,and rainfall on sloping farmlands of Chinese typical mollisol region
[J].
1970—2021年典型黑土区侵蚀沟损毁耕地速度与发育阶段
[J].
Farmland damage speed and development stage of gully erosion in typical black soil region from 1970 to 2021
[J].
县域尺度风力侵蚀栅格计算结果落地研究
[J].
Study on the grid calculation results of wind erosion at county scale
[J].
东北黑土区坡耕地侵蚀沟浅层土壤酶特征及其影响因素
[J].
Characteristics of soil enzymes and its influencing factors in surface soil of eroded gullies on sloping farmland in the black soil region of Northeast China
[J].
坡耕地黑土侵蚀沟演变对土壤结构及抗蚀性的影响
[J].
Effect of black soil erosion gully evolution on soil structural features and anti-erodibility in sloping farmland
[J].
城市遥感生态指数的创建及其应用
[J].
A remote sensing urban ecological index and its application
[J].
基于GEE的库鲁斯台草原生态环境评价
[J].
Eco-environmental assessment of Kurustai grassland based on Google Earth Engine
[J].
DOI:10.13292/j.1000-4890.202311.010
Kurustai grassland is important for agriculture and animal husbandry development in the Tacheng region of Xinjiang, China. To fighting against the increasingly prominent environmental problems such as severe grassland degradation, desertification, and salinization, China has implemented a series of ecological restoration projects to improve grassland environment. Timely, objective, and quantitative evaluations of spatial and temporal variations in ecological environment quality are important for the implementation of environmental protection and restoration projects and policymaking. Using Google Earth Engine (GEE), a remote sensingbased ecological index (RSEI) was constructed based on highquality Landsat images in 2009, 2012, 2015, 2018, and 2021, to assess spatiotemporal variations and spatial clustering patterns of environment quality in Kurustai grassland. The results showed that: (1) The mean value of RSEI increased from 0.294 to 0.324 during 2009-2021, indicating a fluctuating upward trend for the overall environmental quality of the Kurustai grassland. (2) Spatially, the areas with poor and fair environment quality levels were distributed in the western, northwestern, and southwestern regions of Kurustai grassland at relatively low elevations, whereas those with good and excellent environment quality levels were primarily concentrated in the central and eastern regions with high forest cover and less human activities at high elevations. (3) From 2009 to 2021, the global Moran’s <em>I</em> values of RSEI were 0.508-0.687, indicating a positive correlation with the spatial distribution of environment. The local spatial autocorrelation clustering map of RSEI showed that high-high (H-H) clustering areas were primarily distributed in the central region with low elevation, whereas low-low (L-L) clustering areas were in the southwest and northwest parts of the region with sparse vegetation and high elevation.<br><div> <br></div>
基于RSEI的黄河中游地区生态环境质量时空演化特征及驱动因素——以延安市为例
[J].
Spatiotemporal variation of ecological environmental quality and its response to different driving factors in the section of Yellow River Basin in recent 31 years:Taking Yan’an City as an example
[J].
干旱区绿洲遥感生态指数的改进
[J].
Improvement of remote sensing ecological index in oasis in arid area
[J].
MODIS增强型植被指数EVI与NDVI初步比较
[J].
Preliminary comparison of MODIS-NDVI and MODIS-EVI in eastern Asia
[J].
A comparative analysis of multitemporal MODIS EVI and NDVI data for large-scale rice yield estimation
[J].
陕西省地形起伏度最佳计算单元研究
[J].
A study on optimal statistical unit for relief amplitude of land surface in Shaanxi Province
[J].
Application of the topographic position index to heterogeneous landscapes
[J].
新疆地势起伏度的分析研究
[J].
Analysis of the relief amplitude in Xinjiang
[J].
基于DEM的中国地形起伏度适宜计算尺度研究
[J].
Study on the optimal scale for calculating the relief amplitude in China based on DEM
[J].
我国农田防护林研究进展
[J].
Research progress in farmland shelterbelt planting in China
[J].
Spatial modeling of wind speed around windbreaks
[J].DOI:10.1016/S0341-8162(03)00018-3 URL [本文引用: 1]
应用GIS对农田防护林防风效能评价
[J].
Efficiency evaluation of wind protection of windbreaks by GIS
[J].
乌兰布和沙漠绿洲区典型农田防护林带风速流场数值模拟
[J].
Numerical simulation of wind speed field in the typical farmland shelterbelts in the oases of the Ulan Buh Desert
[J].
基于XGBoost与地理加权回归的吉林省西部土壤盐渍化反演
[J].
Inversion of soil salinization in western Jilin Province based on XGBoost and geographically weighted regression
[J].
基于AHP的湖南省耕地适宜性综合评价
[J].
Evaluation on comprehensive suitability of cultivated land in Hunan Province based on AHP
[J].
A new method for soil health assessment based on analytic hierarchy process and meta-analysis
[J].
山东省生态安全预警测度及时空格局
[J].
The ecological security early warning measures and space-time pattern of Shandong Province
[J].
基于改进灰靶模型的耕地质量评价方法与实证
[J].
Cultivated land quality evaluation method and demonstration based on improved grey target model
[J].
Land capability evaluation using NRCS agricultural land evaluation and site assessment (LESA) system in a semi-arid region of Iran
[J].DOI:10.1007/s12665-021-09468-y
