

0 引言
森林生态系统是地表最为重要的组成要素,具备调节气候保持水土、保护生物多样性等功能[1]。自20世纪70年代以来,中国实施了一系列林业法律、政策、法规和植树造林工程[2],森林覆盖率从1976年的12.7%提升到2022年的24.02%,如“退耕还林还草”工程、天然林保护工程、“三北”防护林工程等,这些工程不仅扩大了森林面积,也改善了森林的生态结构和健康状况[3]。但由于人为活动和全球变暖等因素,中国的森林资源保护也面临着来自自然灾害和人为活动的双重影响。自然灾害(如病虫害、火灾、强风、洪涝等)及人为干扰如土地覆盖变化、林业政策、林地采伐等都导致中国的森林损失面积增加[4],如1986—1998年中国发生的多起森林火灾、特大洪灾等[5]等自然灾害,如1981年的三定政策和2008年的林权改革等人为干扰。
在此背景下,南方丘陵山地带的森林生态系统保护尤为重要。南方丘陵山地带有世界同维度带上面积最大、保存最完整的中亚热带森林生态系统森林,在维护国家生态安全、推动南方高质量发展上具有不可替代的地位。然而,由于经济社会发展需求过大,森林资源的不合理利用,非法占用、损毁林地等因素,导致南方丘陵山地带森林生态系统稳定性偏低,森林碳汇、水土保持、水源涵养等生态功能不足。此外,南方丘陵山地带人均土地少、土地单产高,河流中下游为重要的工农业生产基地和经济中心,水土流失造成的经济损失和社会影响大。因此对南方丘陵山地带的森林资源进行监测对我国可持续发展具有重大意义。
传统的森林资源监测主要以现场调查为主,存在工作量大、经济时间成本高、时效性差等不足,难以满足对森林资源动态监测的需求[6]。近年来,遥感监测因其成本低、范围广、速度快以及动态监测地表信息等特点,被广泛应用于各个尺度的森林扰动监测[7]。在众多被应用于森林扰动监测的遥感数据中,Landsat由于其高分辨率(30 m)以及存档周期长(超过45 a)等优势被广泛应用于森林的长期连续监测[8]。目前,一系列基于卫星时间序列的变化检测方法已被提出,如植被变化跟踪模型(vegetation change tracker,VCT)、基于Landsat的扰动与恢复趋势检测(LandTrendr)、季节与趋势间断法(break for additive season and trend,BFAST)、连续变化检测与分类(continuous change detection and classification,CCDC)和连续监测等[9-
1 研究区概况与数据源
1.1 研究区概况
南方丘陵山地带地域辽阔,位于105°31'E~121° E,22°29'N~29°36' N之间,主要包括浙江、福建、江西、湖南、广东、广西、贵州7个省(自治区)的174个县(市、区)。地势大致北高南低,高程在-24~2 148 m之间。地貌类型以中山、中低山、低山丘为主。该地区属亚热带季风气候,多年平均气温在14~22 ℃左右,多年平均降水量在1 177~2 167 mm,适宜的温度和充足的降雨促进了该地区植被的生长。
南方丘陵山地带作为我国重要的南方生态安全屏障,分布有南岭山地森林及生物多样性保护、武夷山森林和生物多样性保护、湘桂岩溶地区石漠化综合治理、南方丘陵山地带矿山生态修复4项工程(全国重要生态系统保护和修复重大工程总体规划(2021—2035年)),这些工程在提升区域生态保护和修复水平方面取得了显著成效,但由于该地区城镇化率高,发展对资源需求大,森林资源利用不合理以及非法占用、损毁林地等因素,导致森林生态系统质量和稳定性不足。森林管护、抚育、病虫害防治、生物入侵防治等方面存在短板,进一步提高森林质量任务艰巨。
1.2 数据源
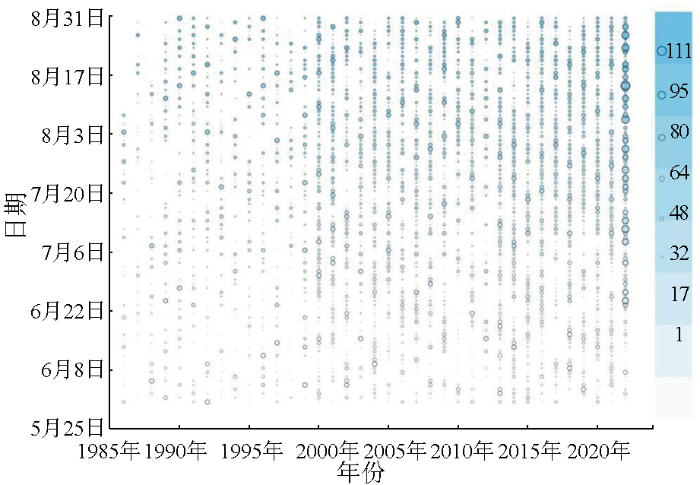
本研究利用GEE平台的Landsat5 TM,Landsat7 ETM+和Landsat8 OLI等不同传感器图像构建Landsat时间序列堆栈,共8 929景。为了减少物候变换对影像的干扰,本研究选取了每年6—9月的Landsat图像,并去除了时间序列堆栈中的水、云和阴影,最终合成年度最佳影像。使用的Landsat图像的时间和数量如图1所示。图中圆圈的大小和颜色深浅表示在不同年份的同一时相内,获得的研究区域的图像数量。
图1
2 研究方法
本研究的主要过程包括4个步骤: ①在GEE平台使用Landsat影像合成1985—2022年的年度时间序列数据集; ②选择2个土地覆盖数据集(CLCD30和GLC_FCS30)在1985年和2022年均被分类为森林的像元作为森林掩模区域; ③结合LandTrendr,J-M距离以及随机森林算法识别森林扰动; ④进行精度验证并分析森林扰动时空分布特征。
2.1 LandTrendr变化检测算法
针对南方丘陵山地带的气候特点,本研究采用了LandTrendr时间序列算法。LandTrendr算法首先要收集研究时间内覆盖研究区的所有图像。通过GEE平台提取Landsat 5,7和8号Collection 2地表反射率产品,通过应用比例因子对产品进行辐射归一化,以解决OLI和ETM+传感器规格差异带来的反射率差异。之后使用云掩模算法去除云和阴影,确保数据的连续性和质量。
在时间序列变化分析中,LandTrendr算法必须为每年确定一个单一值。为此使用Medoid方法将收集到的Landsat影像集合成每年一张的最佳年度复合图像,Medoid作为数据集或簇的代表性对象,其与簇内所有对象的平均差异性最小,类似于均值或质心,但始终是数据集的成员。在Medoid选择过程中,将每个像素的6个波段光谱值(包括TM,ETM+和OLI的等效波段)与该像素在年度内所有观测数据的6个波段光谱中值进行比较,选择与中值最接近的光谱值(通过欧氏距离)作为代表值[25],从而有效减少了云和阴影对影像合成的影响。
表1 LandTrendr算法参数设置
Tab.1
| 参数 | 描述 | 取值 |
|---|---|---|
| maxSegments | 最大分段数 | 8 |
| SpikeThreshold | 如果相邻时间点指数值差异百分比小于该值,则被认为是异常值 | 0.9 |
| vertxCountOvershoot | 在初始阶段的潜在节点回归中可以超过的节点数 | 0 |
| preventOneYearRecovery | 是否阻止一年后恢复的情况 | 是 |
| recoveryThreshold | 如果某个分割段的恢复率大于该值的倒数,那么这个分割段将会被移除 | 0.5 |
| pvalThreshold | 回归分析中F检验的p值,超过该值的话,则认为该像元没有发生变化 | 0.05 |
| bestModelProportion | 简单模型的选择规则,如果超过该值,则被选中 | 0.75 |
| minObservationsNeeded | 拟合中需要的最少观测数 | 6 |
2.2 光谱指数筛选
表2 光谱指数计算公式
Tab.2
| 指数 | 公式 |
|---|---|
| 归一化植被指数 (normalized difference vegetation index,NDVI) | |
| 增强型植被指数 (vegetation enhancement index,EVI) | |
| 归一化燃烧指数 (normalized burning index,NBR) | |
| 缨帽变换亮度指数 (TCT conversion brightness index,TCB) | |
| 缨帽变换湿度指数 (TCT conversion humidity index,TCW) | |
| 缨帽变换绿度指数 (TCT conversion greenness index,TCG) |
J-M距离在众多可分性判定方法中被认为能起到更优的效果[31]。它可以根据分离度程度确定各类别之间的差异性,取值范围为0~2,数值越大差异性越大。对于训练样本集E(i,j=1,2,…,C,i≠j)中的2个光谱指数wi和wj,其数学表达式如下所示:
J=2(1-e-B),
式中: mi和mj分别为wi和wj的特征均值; τi,τj分别为wi和wj的特征标准差。
2.3 随机森林二次分类
随机森林算法是由Breiman L[32]提出的一种集成学习方法,它允许来自多源高维数据的融合,在高维数据集上表现良好,对训练样本过拟合的适应能力强且分类时间短。它基于Bootstrap重采样方法对原始样本集中划分的子样本逐一进行决策树建模,并采用投票方式决定最终的分类结果,公式为:
式中: H(x)为组合分类模型; hi为决策树分类模型; Y为输出变量; I(°)为示性函数。
2.4 精度验证
本研究选择用混淆矩阵对算法精度进行评价。混淆矩阵能够通过比较分类结果与实际测量值之间的混淆程度来进行精度评价,包括总体精度(overall accuracy,OA)、Kappa系数、生产者精度(producer’s accuracy,PA)和用户精度(user’s accuracy,UA)。其中,总体精度和Kappa系数用于评价分类器的总体性能,生产者精度和用户精度用于评价某一类的错分、漏分指标,计算公式为:
式中: N为总样本数;K为总类别数;Nii为被分到正确类别的样本数;N+i和Ni+分别为第i类的真实样本数和预测为第i类的样本数。
3 结果与分析
3.1 指数选择
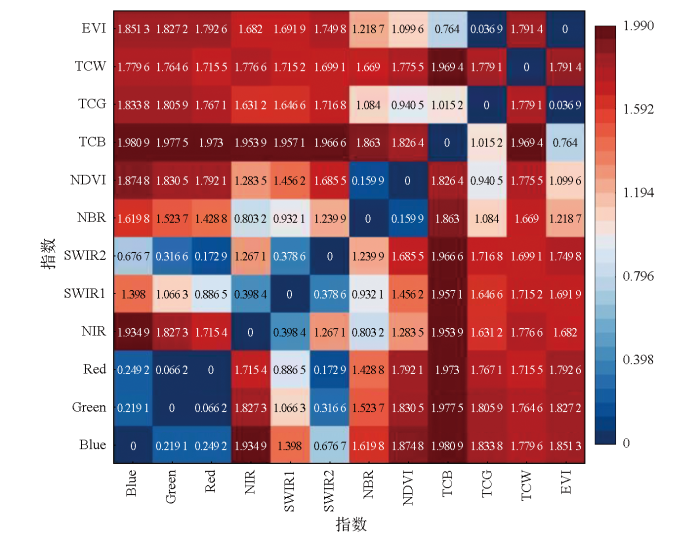
本研究根据CLCD30和GLC_FCS30数据集选择森林样本,计算了各个指数之间的J-M距离(图2)。初步筛选出NBR,NDVI,NIR,短波红外1(SWIR1),流苏帽指数亮度(TCB)、湿度(TCW)以及EVI,这些指数/波段两两组合J-M距离值较大,表明差异性较大。由于EVI与NDVI在特征表达上相似,因此去除了EVI。此外,NIR波段的信息已在NBR和NDVI中体现,因此去除了NIR,并添加了GREEN波段以提高对植被变化的敏感性。最终选取了NBR,NDVI,GREEN波段,SWIR1,TCB及TCW。这些指标中,NBR对于森林烧毁、砍伐等敏感; NDVI是最常见和广泛使用的植被指数之一; GREEN对植被的变化非常敏感; TCW和SWIR1对森林植被的水分含量较为敏感; TCB能够帮助识别地表覆盖类型的变化,在监测森林砍伐、土地利用变化以及其他人类活动引起的地表扰动方面具有显著的效果。上述指标组合有助于更准确地监测和评估森林生态系统的变化。
图2
3.2 精度评价
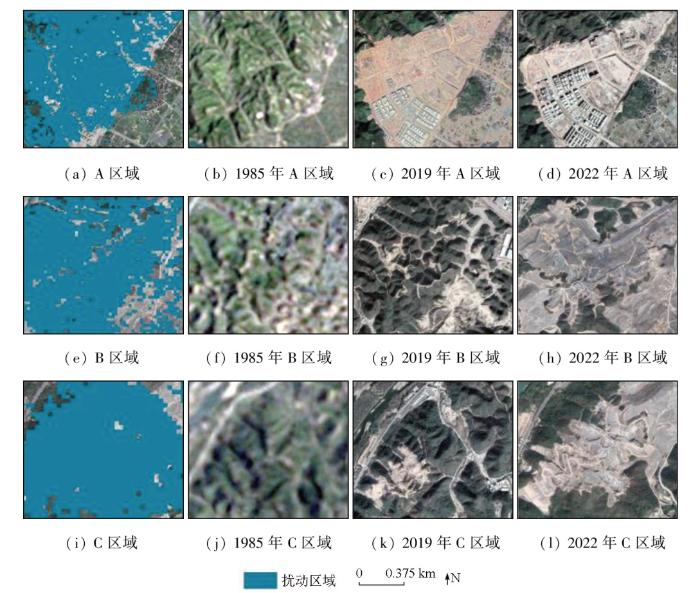
为评估森林干扰监测的准确性,本研究采用总体精度、Kappa系数等评价指标,同时使用Google高精度地图进行对比,图3展示了A,B,C区域的LandTrendr扰动结果和不同时期的遥感图像对比。蓝色部分代表LandTrendr检测到的扰动区域,其余部分为不同时期的遥感图像。选择研究时段内发生变化和未发生变化的森林像元共1 000个,对像元的变化状态进行目视解译,并结合土地覆盖数据进行辅助解译,将结果与LandTrendr算法的监测结果进行对比,构建混淆矩阵。结果显示,LandTrendr算法监测结果的总体精度为90.38%,Kappa系数为0.81,表明其在森林干扰监测方面具有良好的一致性和可靠性。此外,根据年份选择了3 800个样本点进行随机森林分类,对其分类精度进行了评估,其总体精度达到了91.80%,Kappa系数为0.90,进一步验证了监测方法的准确性和实用性。
图3
3.3 森林干扰时空分布特征
3.3.1 空间分布特征
4个生态修复工程的森林干扰空间分布如图4所示。南方丘陵山地带的4个生态修复工程区域展现出显著的森林扰动空间分布特征。南岭山地的森林扰动广泛且相对均匀,尤其在中东部地区,包括广东、江西和湖南的部分区域。2009—2018年间的扰动最为显著,面积达到2 148.9 km2。英德市以674.84 km2的扰动面积位居首位,主要集中在1985—1994年间的中南部森林区域。
图4
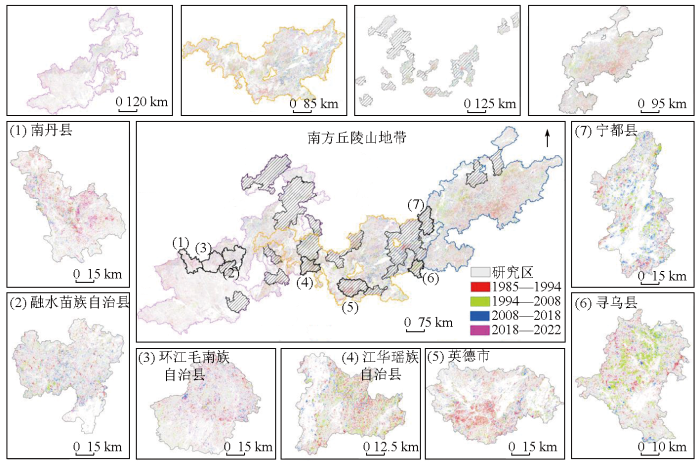
图4
1985—2022年4个生态修复工程森林扰动空间分布特征
Fig.4
Annual forest disturbance variation in four ecological restoration projects (1985—2022)
武夷山区涵盖福建、浙江和江西的部分区域,扰动面积最大,且各时段扰动频繁。扰动主要集中在福建和浙江省内,以中部为核心,呈现由中心向外减弱的趋势。建瓯市的扰动面积达到966.65 km2,1985—1994年间的扰动也集中在建瓯市周围。1995—2008年间,光泽县、遂昌县、邵武市等地的扰动较为显著。
湘桂岩溶地区的扰动主要集中在广西壮族自治区,尤其是与湖南和贵州交界的区域。融水苗族自治县的扰动面积最大(408.57 km2),其次是南丹县和环江毛南族自治县,表明这些地区可能因矿产资源开发等活动导致生态破坏。
南方丘陵山地带矿山区域包括两广、福建、浙江、湖南、江西等省份的部分区域。英德市的总扰动面积最高,其次是宁都县(512.44 km2)和江华瑶族自治县(433.55 km2),显示出这些地区的森林生态系统显著受矿山开采活动影响。
整体来看,南方丘陵山地带不同区域的森林扰动分布具有明显的地理集聚特征,扰动强度与地理位置及资源开发密切相关。这些结果表明,不同生态修复工程区域的森林扰动受人类活动影响程度各异,为未来生态保护和修复工程的区域性差异化策略提供了重要的数据支持。
3.3.2 时间分布特征
图5反映了4个生态修复工程的森林干扰面积、年干扰面积比随时间的变化特征以及各地区在1985—1999年、2000—2007年和2008—2022年这3个时间段的平均干扰面积。1985—2022年,南方丘陵山地带森林损失面积总计38 564.619 3 km2,占1985年森林总面积(239 461.236 km2)的16.1%。
图5
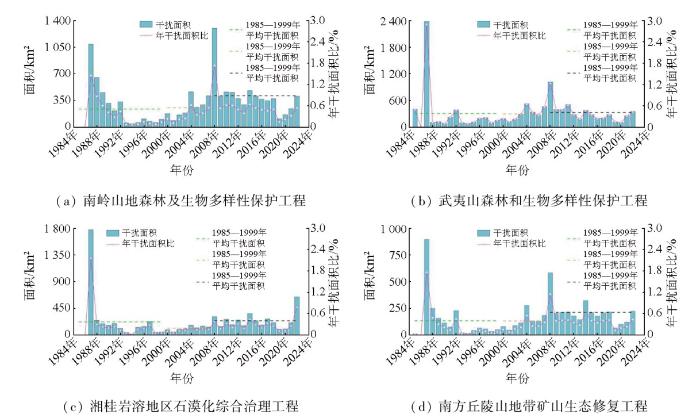
图5
1985—2022年4个生态修复工程森林扰动年际变化特征
Fig.5
Annual forest disturbance variation in 4 ecological restoration projects (1985—2022)
南岭山地的森林损失总面积为11 820.789 km2,年均损失约为311.07 km2。1987—1993年,森林干扰面积呈快速下降趋势,2000—2008年森林干扰面积呈增加趋势,在2008年达到峰值后急剧下降,并趋于平稳。总体而言,1994—2022年森林干扰面积呈增加趋势(斜率7.95 km2/a,R2=0.25,P<0.05)。森林损失面积峰值和次高值分别发生在2008年和1987年。
武夷山区的森林损失总面积为12 040.274 7 km2,年均损失为316.85 km2。1987森林干扰面积达到峰值后急剧下降,在1990年降到低点,1993—2008年森林干扰面积呈上升趋势(斜率38.08 km2/a,R2=0.55,P<0.05),2008年后呈下降趋势(斜率-30.96 km2/a,R2=0.39,P<0.05)。森林损失峰值出同样现在2008年和1987年。
湘桂岩溶地区的森林损失总面积为8 228.966 4 km2,年均损失为216.55 km2。同样在1987年达到峰值后森林干扰面积急剧下降,并在1988—2020年间保持平稳(斜率4.38 km2/a,R2=0.16,P<0.05),2020—2022年间有明显提升。
南方丘陵山地带矿山的森林损失总面积为6 474.5892 km2,年均损失为170.38 km2。1987—1992年间干扰面积从1987年的峰值开始快速下降,1993—2008年呈显著上升趋势(斜率50.24 km2/a,R2=0.51,P<0.05),2008—2018年保持平稳,2019年森林干扰面积降到2008年次高值之后的最低点,随后上升,到2022年与该区域2008—2022年间平均干扰面积相近。
4 讨论
本研究结合LandTrendr算法与随机森林算法对南方丘陵山地带森林干扰时空变化进行监测,揭示了1985—2022年间南方丘陵山地带森林干扰时空变化特征。总体来说,1985—2022年间森林干扰总面积为38 564.62 km2,其中武夷山森林(12 040.27 km2)>南岭山地森林(11 820.79 km2)>湘桂岩溶地区(8 228.97 km2)>南方丘陵山地带矿山(6 474.59 km2)。
在空间分布上,南方丘陵山地带不同区域的森林扰动分布具有明显的地理集聚特征。武夷山森林包含了福建、浙江和江西3省的部分区域,其中福建是全国6大林区的典型代表和集体林权制度的重要发源地[33-34]; 浙江树种以乔木为主,在增加森林碳汇方面有着重要作用,具有较高的开发价值,中国第一个林业碳汇交易试点平台位于浙江。此外,两省都处于东南沿海,是我国木材加工产业发展较快的区域,经济发展活跃,是外资企业进入中国设厂的首选理想区域。因此该区域扰动面积分布较为均匀且扰动面积最大。南岭山地森林区域包括了广东、湖南、广西以及江西部分区域,其中湖南和江西形成了以杉木、马尾松和湿地松为主的针叶纯林植被,两广地区典型的植被类型为亚热带常绿阔叶林和杉木等人工林[35],这些树种轮伐期较长,因此扰动相对较少。湘桂岩溶地区地处贵州高原向湘西、桂北丘陵的过渡地带,地面切割较深、山岭河谷交错、相对高差大,形成了岩溶峰丛峰林地貌。该区域包含了广西、湖南部分区域,湖南省石漠化土地位居全国第四位,主要分布在西南部。自2000年以来,广西森林扰动分布于西北和东北区域,这与研究结果中该区域的扰动分布特征相符。
在时间分布上,4个生态修复工程森林干扰面积呈现出明显的阶段性变化: 1987—1993年呈下降趋势,1993—2008年呈上升趋势,2008—2019年趋于稳定,2019—2022年再次上升。林业政策对该现象有着一定的影响(图6,图中A代表南岭山地森林及生物多样性保护工程,B代表武夷山森林和生物多样性保护工程,C代表湘桂岩溶地区石漠化综合治理工程,D代表南方丘陵山地带矿山生态修复工程)。1981年出台的《关于保护和发展森林的几个问题的决议》中提出了“三定”政策,该政策初期导致了森林损失面积的显著增加,许多之前的研究也发现这一政策使得森林损失面积增加,Liu等[35]指出,在20世纪80年代,中国南方有13.5%的森林被砍伐,并将森林损失面积的增加归因于这一政策。而1987年出台的《关于严禁乱砍滥伐、保护集体森林资源的指导方针》有效遏制了这一趋势。2002年出台的《重点地区速生丰产用材林基地建设工程规划》旨在解决我国木材和林产品供应短缺问题,同时保护天然林免遭砍伐[36]。该政策在江西、湖南、两广、浙江等18个省实施,造成了森林损失面积的增加,是2003—2022年间森林损失面积增加的主要原因之一。自2003年《中共中央国务院关于加快林业发展决定》开始第二次集体林权改革试点以来,该政策被证明是一项适合森林资源管理的政策,因此2008年的《关于全面推进集体林权制度改革的意见》开始全面实施第二次集体林权改革,这一政策在增加了农民收入、促进林业现代化的同时减少了森林的非法采伐。尽管重点地区速生丰产种植园工程和林权改革造成了森林损失面积增加,但在2008—2022年,中央出台的林业政策文件文本数量与过去相比成倍数增长,因此这一时期森林干扰趋于稳定。
图6
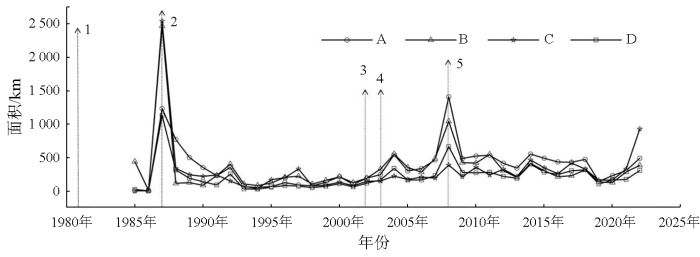
图6
主要林业政策时间线与森林损失面积的年际变化
Fig.6
Timeline of major forestry policies and annual changes in forest loss area
5 结论
1)本研究基于Landsat时间序列数据,对1985—2022年间南方丘陵山地带的森林干扰进行监测与分析。结果表明,南方丘陵山地带有16.1%的森林遭受了干扰。其中武夷山森林(12 040.27 km2)>南岭山地森林(11 820.79 km2)>湘桂岩溶地区(8 228.97 km2)>南方丘陵山地带矿山(6 474.59 km2)。南方丘陵山地带的森林干扰在空间和时间上均表现出显著的特征。
2)空间上,森林扰动具有明显的地理集聚特征,尤其在武夷山区和南岭山地等区域,受到地理位置和资源开发的影响显著。
3)时间上,1985—2022年间,森林干扰面积经历了多个阶段的变化,在一定程度上受到林业政策的影响。本研究通过提供1985—2022年间长时间的森林损失数据集,为未来的生态保护和修复工程提供了重要的数据支持,同时强调了因地制宜的区域性差异化策略的重要性。
参考文献
The exceptional value of intact forest ecosystems
[J].
Contrasting forest loss and gain patterns in subtropical China detected using an integrated LandTrendr and machine-learning method
[J].
DOI:10.3390/rs14133238
URL
[本文引用: 1]

China has implemented a series of forestry law, policies, regulations, and afforestation projects since the 1970s. However, their impacts on the spatial and temporal patterns of forests have not been fully assessed yet. The lack of an accurate, high-resolution, and long-term forest disturbance and recovery dataset has impeded this assessment. Here we improved the forest loss and gain detections by integrating the LandTrendr change detection algorithm with the Random Forest (RF) machine-learning method and applied it to assess forest loss and gain patterns in the Zhejiang, Jiangxi, and Guangxi Provinces of the subtropical vegetation in China. The accuracy evaluation indicated that our approach can adequately detect the spatial and temporal distribution patterns in forest gain and loss, with an overall accuracy of 93% and the Kappa coefficient of 0.89. The forest loss area was 8.30 × 10⁴ km2 in the Zhejiang, Jiangxi, and Guangxi Provinces during 1986–2019, accounting for 43.52% of total forest area in 1986, while the forest gain area was 20.25 × 10⁴ km2, accounting for 106.19% of total forest area in 1986. Although the interannual variation patterns were similar among three provinces, the forest loss and gain area and the magnitude of change trends were significantly different. Guangxi has the largest forest loss and gain area and increasing trends, followed by Jiangxi, and the least in Zhejiang. The variations in annual forest loss and gain area can be mostly explained by the timelines of major forestry policies and regulations. Our study would provide an applicable method and data for assessing the impacts of forest disturbance events and forestry policies and regulations on the spatial and temporal patterns of forest loss and gain in China, and further contributing to regional and national forest carbon and greenhouse gases budget estimations.
China and India lead in greening of the world through land-use management
[J].
The national forest inventory in China:History - results - international context
[J].DOI:10.1186/s40663-015-0047-2 URL [本文引用: 1]
1949年以来中国林业政策的演进特征及其规律研究——基于283个涉林规范性文件文本的量化分析
[J].
The evolution of forestry policies since 1949:An quantitative analysis based on 283 texts of forest-related normative policy documents
[J].
Continuous monitoring of forest disturbance using all available Landsat imagery
[J].
United states forest disturbance trends observed using landsat time series
[J].DOI:10.1007/s10021-013-9669-9 URL [本文引用: 1]
The global Landsat archive:Status,consolidation,and direction
[J].
An automated approach for reconstructing recent forest disturbance history using dense Landsat time series stacks
[J].DOI:10.1016/j.rse.2009.08.017 URL [本文引用: 1]
Detecting trend and seasonal changes in satellite image time series
[J].DOI:10.1016/j.rse.2009.08.014 URL
Continuous change detection and classification of land cover using all available Landsat data
[J].
Detecting trends in forest disturbance and recovery using yearly Landsat time series:1.LandTrendr—Temporal segmentation algorithms
[J].DOI:10.1016/j.rse.2010.07.008 URL [本文引用: 1]
Detecting trends in forest disturbance and recovery using yearly Landsat time series:2.TimeSync—Tools for calibration and validation
[J].DOI:10.1016/j.rse.2010.07.010 URL [本文引用: 2]
Diversity of algorithm and spectral band inputs improves landsat monitoring of forest disturbance
[J].
DOI:10.3390/rs12101673
URL
[本文引用: 2]
Disturbance monitoring is an important application of the Landsat times series, both to monitor forest dynamics and to support wise forest management at a variety of spatial and temporal scales. In the last decade, there has been an acceleration in the development of approaches designed to put the Landsat archive to use towards these causes. Forest disturbance mapping has moved from using individual change-detection algorithms, which implement a single set of decision rules that may not apply well to a range of scenarios, to compiling ensembles of such algorithms. One approach that has greatly reduced disturbance detection error has been to combine individual algorithm outputs in Random Forest (RF) ensembles trained with disturbance reference data, a process called stacking (or secondary classification). Previous research has demonstrated more robust and sensitive detection of disturbance using stacking with both multialgorithm ensembles and multispectral ensembles (which make use of a single algorithm applied to multiple spectral bands). In this paper, we examined several additional dimensions of this problem, including: (1) type of algorithm (represented by processes using one image per year vs. all historical images); (2) spectral band choice (including both the basic Landsat reflectance bands and several popular indices based on those bands); (3) number of algorithm/spectral-band combinations needed; and (4) the value of including both algorithm and spectral band diversity in the ensembles. We found that ensemble performance substantially improved per number of model inputs if those inputs were drawn from a diversity of both algorithms and spectral bands. The best models included inputs from both algorithms, using different variants of shortwave-infrared (SWIR) and near-infrared (NIR) reflectance. Further disturbance detection improvement may depend upon the development of algorithms which either interrogate SWIR and NIR in new ways or better highlight disturbance signals in the visible wavelengths.
基于特征优选随机森林算法的农耕区土地利用分类
[J].
Classification of land use in farming areas based on feature optimization random forest algorithm
[J].
Examining the effect of spatial resolution and texture window size on classification accuracy:An urban environment case
[J].DOI:10.1080/01431160310001618464 URL [本文引用: 1]
A new sparsity-based band selection method for target detection of hyperspectral image
[J].DOI:10.1109/LGRS.2014.2337957 URL [本文引用: 1]
Optimum band selection for supervised classification of multispectral data
[J/OL].
Mapping forest change using stacked generalization:An ensemble approach
[J].
A performance comparison of SRTM v.3.0,AW3D30,ASTER GDEM3,Copernicus and TanDEM-X for tectonogeomorphic analysis in the South American Andes
[J].
Mapping planted forest age using LandTrendr algorithm and Landsat5-8 on the Loess Plateau,China
[J].
Spatial and temporal patterns of forest disturbance and regrowth within the area of the Northwest Forest Plan
[J].
The response of global terrestrial ecosystems to interannual temperature variability
[J].
DOI:10.1126/science.278.5339.870
URL
[本文引用: 1]
Measurements of atmospheric carbon dioxide and satellite-derived measurements of temperature and the vegetation index were used to investigate relationships among climate, carbon dioxide, and ecosystems. At the global scale, lagged correlations between temperature and carbon dioxide growth rate were found, indicating modulation by biogeochemical feedbacks. Spatial analysis of the temperature and vegetation index data suggests that the global correlations are a composite of individualistic responses of different ecosystems. The existence of biome-specific time scales of response implies that changes in global ecosystem distributions could indirectly alter the relationships between climate and carbon storage.
Increasing global vegetation browning hidden in overall vegetation greening:Insights from time-varying trends
[J].
Monitoring desertification by remote sensing using the Tasselled Cap transform for long-term change detection
[J].DOI:10.1007/s11069-016-2342-9 URL
澜沧江流域植被覆盖变化特征及其与气候因子的关系
[J].
通过比较MODIS植被指数产品NDVI和EVI的差异, 选择利用2000年-2009年的NDVI产品来分析澜沧江流域植被覆盖变化特征。分析了澜沧江流域NDVI的时间和空间变化规律, 同时, 研究了该流域NDVI与主要气候因子(气温、降水、相对湿度、日照时间)之间的相关关系。结果显示:从2000年到2009年的10年间, 澜沧江流域的植被覆盖状况整体较好, 年均NDVI都大于0.45, 年际变化呈波动增加趋势, 生态环境有改善的趋势。但流域平均NDVI季节性变化明显, 呈典型的单峰分布, NDVI最低值在3月, 5月份开始迅速上升, 最高值在8月。NDVI在0.35至0.6之间波动。澜沧江流域月均NDVI与气温、降水量、相对湿度和日照时数关系密切, 相关系数分别为0.619, 0.691, 0.801和-0.601, 气温的升高有利于流域生态环境的改善。在空间上, 流域平均NDVI表现出明显的纬度地带性特征, 最高值出现在流域最南部, 最低值出现在最北部。10年来NDVI值变小的区域集中在上游和下游, NDVI值变大的区域主要集中在中游。
Characteristics of vegetation cover changes in lantsang basin based on MODIS vegetation index products (MOD13)
[J].
Vegetation is the important indication of regional eco-environmental characteristics. Its distribution, community structure and productivity can reflect the climate change and indicate the range of climate change. Changes of vegetation cover are mainly caused by climate change and human activities. In this paper, by comparing data characteristics of MODIS NDVI with MODIS EVI, MODIS NDVI vegetation index from 2000 to 2009 was selected to analyze characteristics of vegetation change in the Lantsang Basin. The temporal and spatial variation characteristics of NDVI and its correlation with four major climate factors (temperature, precipitation, relative humidity and sunshine duration) were analyzed. The results show that the annual average NDVI of the basin is greater than 0.45, showing a fluctuately increasing trend during 2000 and 2009; the ecological environment of the basin shows a trend of improving. Within the year, seasonal change of the average NDVI of the basin is obvious, presenting a typical unimodal distribution. The NDVI reaches the minimum value in March, begins to rise rapidly in May and reaches the maximum value in August, ranging from 0.35 to 0.60. Therefore, we know that the situation of vegetation cover also shows a trend of unimodal change in the Lantsang Basin. From June to August, the situation of vegetation cover is the best, while from February to April it is the worst. Besides, it has typical seasonal distribution characteristics, which is consistent with vegetation growth rule. The linear correlation coefficients between NDVI and the four major climate factors are 0.619, 0.691, 0.801 and -0.601 respectively. In the space, the average NDVI in the basin shows a latitudinal zonal characteristic, with the maximum value appearing in the southmost basin and the minimum value appearing in the northmost basin. During the past 10 years, the average NDVI decreased in the headstream and downstream, which mainly include Apline meadow and Typical and subtropical broad-leaved forest and increased in the Middlestream, which mainly includes shrubland. To sum up, the vegetation cover is becoming increasingly better in the Lanstang Basin, which is consistent with the conclusion obtained from the time variation perspective.
Classification of hyperspectral imagery with a 3D convolutional neural network and J-M distance
[J].DOI:10.1016/j.asr.2019.05.005 URL [本文引用: 1]
A spatial and temporal analysis of forest dynamics using Landsat time-series
[J].
福建省县域森林损失时空演变特征及其影响因素分析
[J].
Characterization of spatial and temporal evolution of forest loss in counties in Fujian Province and analysis of its influencing factors
[J].
基于地统计学的广东省和广西省森林生物量和NPP空间格局分析
[J].区域尺度森林生物量和森林净初级生产力(NPP)的估测是目前生态学领域重要的科学问题之一。使用不同的方法获得的区域尺度森林生物量和NPP估算值存在较大差异。本文以广东和广西为例,通过搜集文献中两广地区的167个样地实测数据,运用林龄与生物量及NPP之间的关系方程,计算2010年的样地生物量和NPP;应用ArcGIS地统计分析和插值方法,研究区域森林生物量和NPP分布格局,并探讨两者及森林各组成部分生物量的空间分异特征。不同森林类型的生物量和NPP水平有较大差异,森林生物量格局表现为北高南低,NPP分布是中部较低,最高值在热带雨林分布的西部和南部。本研究为区域尺度森林生物量和NPP的研究提供了一种新的方法和途径。
Spatial pattern analysis of forest biomass and NPP in Guangdong and Guangxi provinces of South China based on geostatistics
[J].At present, the estimation of forest biomass and net primary productivity (NPP) on regional scale is one of the important issues in ecology. The estimates on forest biomass and NPP on regional scale by using different methods vary greatly. Based on the investigation data of 167 forest typical sampling plots in Guangdong and Guangxi provinces of South China collected from publications, and by using the equations of the relationships between the stand age and the biomass and NPP, the forest biomass and NPP under natural growth in the two Provinces were estimated in 2010. The spatial patterns of the forest biomass and NPP were derived by the spatial interpolation and geostatistics analysis of ArcGIS, with the spatial patterns of the two and of the forest biomass components explored. There existed great differences in the biomass and NPP among different forest types. The spatial pattern of forest biomass decreased from north to south. The NPP was lower in the central area, and the highest in the west and south, where tropical rainforests distributed. Our results would provide a new way to study the forest biomass and NPP on regional scale.
Why did the 1980s’ reform of collective forestland tenure in Southern China fail?
[J].
