Forest disturbances in the South China hilly and mountainous belt based on long time-series Landsat data
PEI Du1(), YUAN Wubin2, LI Hengkai1()
1. Jiangxi University of Science and Technology, School of Civil and Surveying & Mapping Engineering, Ganzhou 341000, China 2. Jiangxi Provincial Natural Resources Development Center, Nanchang 330025, China
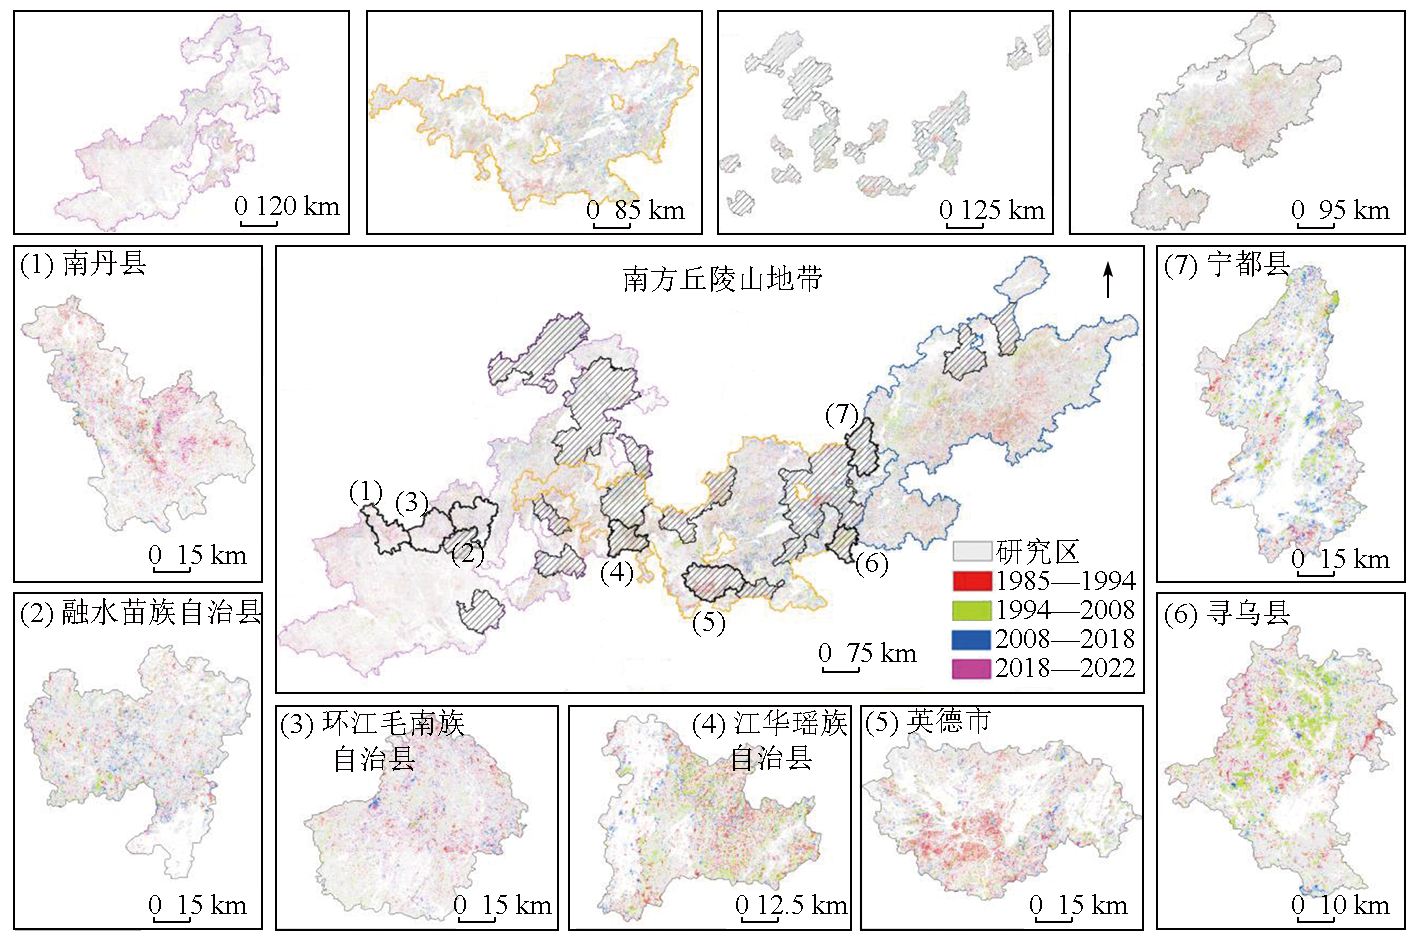
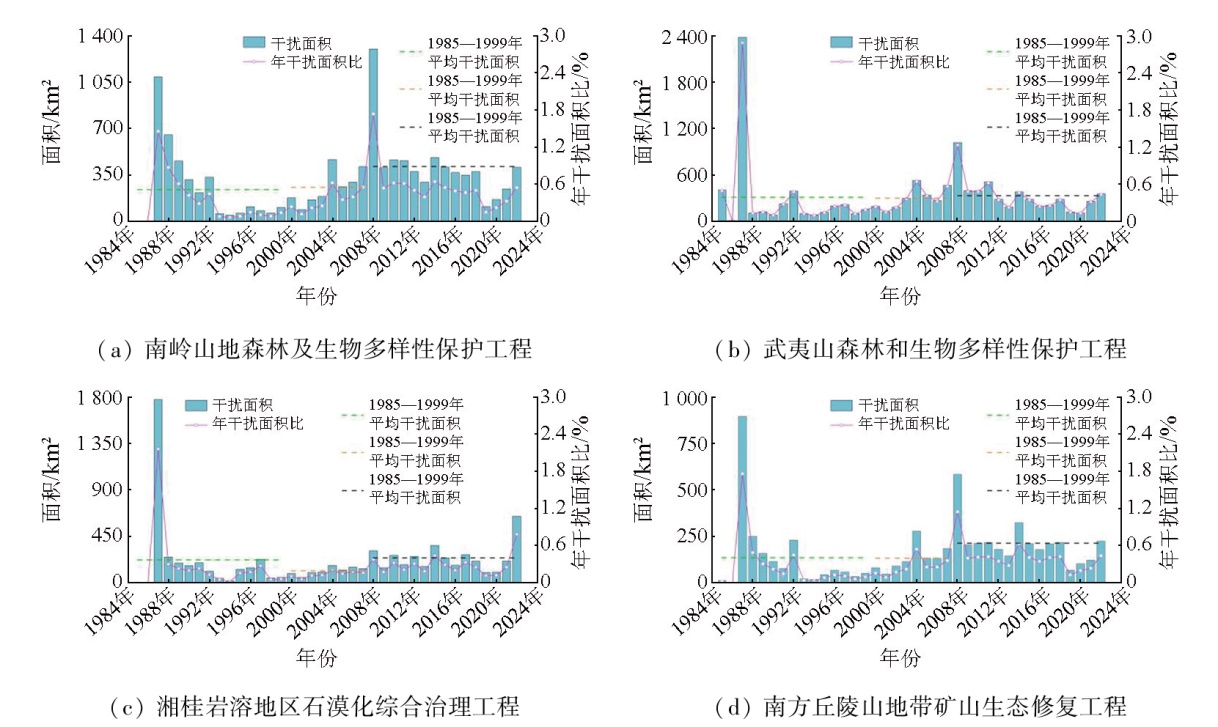
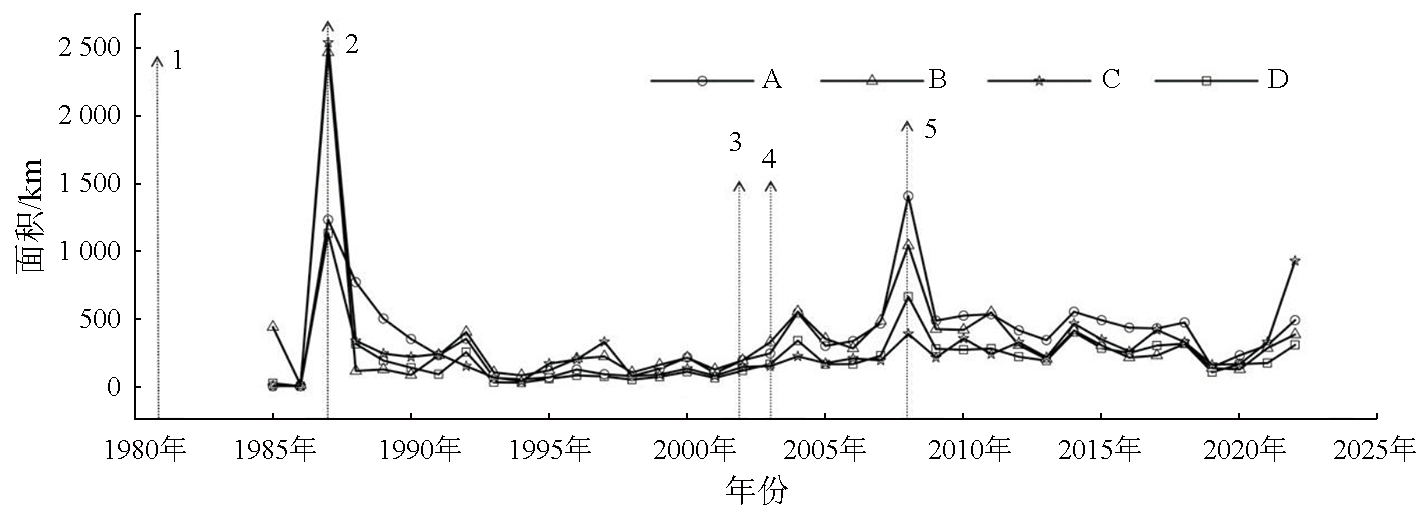
The South China hilly and mountainous belt is one of the “three regions and four belts” involved in China's major ecosystem conservation and restoration program. This belt hosts the largest and most well-preserved middle subtropical forest ecosystem at the same latitudes globally, playing a crucial role in ensuring the ecological security in South and Southwest China. Based on the Google Earth Engine (GEE) platform, this study conducted preliminary monitoring of disturbances in this belt using the LandTrendr algorithm and the Jeffries-Matusita (JM) distance. It further applied the random forest algorithm to relevant disturbance outputs, enabling the monitoring and analysis of forest disturbances in this belt from 1985 to 2022. The results indicate that the total forest disturbance area in this belt reached 38 564.62 km2 during the study period. Specifically, the disturbance areas of four ecological restoration projects decreased in the following order: Wuyi Mountains forests (12 040.27 km2), Nanling Mountains forests (11 820.79 km2), Hunan and Guangxi karst areas (8 228.97 km2), and mining areas (6 474.59 km2). Based on the 38-year forest loss dataset, this study analyzed the spatiotemporal variations in forest disturbances within this belt, revealing significant spatiotemporal forest disturbances. Spatially, forest disturbances were characterized by distinct geographic clustering. Temporally, the forest loss areas under four ecological restoration projects experienced several stages of change. Despite similar critical transition points and interannual variation patterns, differences in forest resources, climate, and economic conditions led to variations in the areas and trends of forest loss. Besides, the implementation of forestry policies somewhat influenced the forest loss trend. Overall, this study provides a scientific basis and decision-making reference for the management of forest ecosystems within this belt.
裴度, 袁武彬, 李恒凯. 基于长时序Landsat的南方丘陵山地带森林扰动分析[J]. 自然资源遥感, 2025, 37(6): 241-250.
PEI Du, YUAN Wubin, LI Hengkai. Forest disturbances in the South China hilly and mountainous belt based on long time-series Landsat data. Remote Sensing for Natural Resources, 2025, 37(6): 241-250.
Watson J E M, Evans T, Venter O, et al. The exceptional value of intact forest ecosystems[J]. Nature Ecology & Evolution, 2018, 2(4):599-610.
[2]
Shen J, Chen G, Hua J, et al. Contrasting forest loss and gain patterns in subtropical China detected using an integrated LandTrendr and machine-learning method[J]. Remote Sensing, 2022, 14(13):3238.
doi: 10.3390/rs14133238
[3]
Chen C, Park T, Wang X, et al. China and India lead in greening of the world through land-use management[J]. Nature Sustainability, 2019,2:122-129.
[4]
Zeng W, Tomppo E, Healey S P, et al. The national forest inventory in China:History - results - international context[J]. Forest Ecosystems, 2015, 2(1):23.
doi: 10.1186/s40663-015-0047-2
Pan D, Chen H, Kong F B. The evolution of forestry policies since 1949:An quantitative analysis based on 283 texts of forest-related normative policy documents[J]. Chinese Rural Economy, 2019(7):89-108.
[6]
Zhu Z, Woodcock C E, Olofsson P. Continuous monitoring of forest disturbance using all available Landsat imagery[J]. Remote Sensing of Environment, 2012,122:75-91.
[7]
Masek J G, Goward S N, Kennedy R E, et al. United states forest disturbance trends observed using landsat time series[J]. Ecosystems, 2013, 16(6):1087-1104.
doi: 10.1007/s10021-013-9669-9
[8]
Wulder M A, White J C, Loveland T R, et al. The global Landsat archive:Status,consolidation,and direction[J]. Remote Sensing of Environment, 2016,185:271-283.
[9]
Huang C, Goward S N, Masek J G, et al. An automated approach for reconstructing recent forest disturbance history using dense Landsat time series stacks[J]. Remote Sensing of Environment, 2010, 114(1):183-198.
doi: 10.1016/j.rse.2009.08.017
[10]
Verbesselt J, Hyndman R, Newnham G, et al. Detecting trend and seasonal changes in satellite image time series[J]. Remote Sensing of Environment, 2010, 114(1):106-115.
doi: 10.1016/j.rse.2009.08.014
[11]
Zhu Z, Woodcock C E. Continuous change detection and classification of land cover using all available Landsat data[J]. Remote Sensing of Environment, 2014,144:152-171.
[12]
Kennedy R E, Yang Z, Cohen W B. Detecting trends in forest disturbance and recovery using yearly Landsat time series:1.LandTrendr—Temporal segmentation algorithms[J]. Remote Sensing of Environment, 2010, 114(12):2897-2910.
doi: 10.1016/j.rse.2010.07.008
[13]
Cohen W B, Yang Z, Kennedy R. Detecting trends in forest disturbance and recovery using yearly Landsat time series:2.TimeSync—Tools for calibration and validation[J]. Remote Sensing of Environment, 2010, 114(12):2911-2924.
doi: 10.1016/j.rse.2010.07.010
[14]
Cohen W B, Healey S P, Yang Z, et al. Diversity of algorithm and spectral band inputs improves landsat monitoring of forest disturbance[J]. Remote Sensing, 2020, 12(10):1673.
doi: 10.3390/rs12101673
Wang L J, Kong Y R, Yang X D, et al. Classification of land use in farming areas based on feature optimization random forest algorithm[J]. Transactions of the Chinese Society of Agricultural Engineering, 2020, 36(4):244-250.
[16]
Chen D, Stow D A, Gong P. Examining the effect of spatial resolution and texture window size on classification accuracy:An urban environment case[J]. International Journal of Remote Sensing, 2004, 25(11):2177-2192.
doi: 10.1080/01431160310001618464
[17]
Sun K, Geng X, Ji L. A new sparsity-based band selection method for target detection of hyperspectral image[J]. IEEE Geoscience and Remote Sensing Letters, 2015, 12(2):329-333.
doi: 10.1109/LGRS.2014.2337957
[18]
MAUSEL P W. Optimum band selection for supervised classification of multispectral data[J/OL]. Photogrammetric Engineering & Remote Sensing, 1990, 56(1):55-60.
[19]
Healey S P, Cohen W B, Yang Z, et al. Mapping forest change using stacked generalization:An ensemble approach[J]. Remote Sensing of Environment, 2018,204:717-728.
Fu B J, Wang X F, Feng X M. Ecosystem assessment of national ecological barrier area[M]. Beijing: Science Press, 2017.
[21]
Yang J, Huang X. The 30 m annual land cover datasets and its dynamics in China from 1985 to 2022[DS/OL]//Zenodo (CERN European Organization for Nuclear Research).(2023-08-01).
[22]
Liu L, Zhang X, Zhao T. GLC_FCS30D:The first global 30-m land-cover dynamic monitoring product with fine classification system from 1985 to 2022[DS/OL]//Zenodo (CERN European Organization for Nuclear Research).(2023-08-11).
[23]
el Rosario González-Moradas M, Viveen W, Andrés Vidal-Villalobos R, et al. A performance comparison of SRTM v.3.0,AW3D30,ASTER GDEM3,Copernicus and TanDEM-X for tectonogeomorphic analysis in the South American Andes[J]. Catena, 2023,228:107160.
[24]
Li P, Li H, Si B, et al. Mapping planted forest age using LandTrendr algorithm and Landsat5-8 on the Loess Plateau,China[J]. Agricultural and Forest Meteorology, 2024,344:109795.
[25]
Kennedy R E, Yang Z, Cohen W B, et al. Spatial and temporal patterns of forest disturbance and regrowth within the area of the Northwest Forest Plan[J]. Remote Sensing of Environment, 2012,122:117-133.
[26]
Braswell B H, Schimel D S, Linder E, et al. The response of global terrestrial ecosystems to interannual temperature variability[J]. Science, 1997, 278(5339):870-873.
doi: 10.1126/science.278.5339.870
[27]
Pan N, Feng X, Fu B, et al. Increasing global vegetation browning hidden in overall vegetation greening:Insights from time-varying trends[J]. Remote Sensing of Environment, 2018,214:59-72.
[28]
Zanchetta A, Bitelli G, Karnieli A. Monitoring desertification by remote sensing using the Tasselled Cap transform for long-term change detection[J]. Natural Hazards, 2016, 83(1):223-237.
doi: 10.1007/s11069-016-2342-9
Li Y F, Liu G H. Characteristics of vegetation cover changes in lantsang basin based on MODIS vegetation index products (MOD13)[J]. Resources Science, 2012, 34(7):1214-1221.
[30]
Wang C, Ma N, Ming Y, et al. Classification of hyperspectral imagery with a 3D convolutional neural network and J-M distance[J]. Advances in Space Research, 2019, 64(4):886-899.
doi: 10.1016/j.asr.2019.05.005
[31]
Nguyen T H, Jones S D, Soto-Berelov M, et al. A spatial and temporal analysis of forest dynamics using Landsat time-series[J]. Remote Sensing of Environment, 2018,217:461-475.
[32]
Breiman L. Random forests[J]. Machine Learning, 2017,45:5-32.
Zhu W H, Lin J H, Yang S Q, et al. Characterization of spatial and temporal evolution of forest loss in counties in Fujian Province and analysis of its influencing factors[J]. Journal of Ecology and Rural Environment, 2024, 40(4):499-512.
Liu S, Ruan H H. Spatial pattern analysis of forest biomass and NPP in Guangdong and Guangxi provinces of South China based on geostatistics[J]. Chinese Journal of Ecology, 2013, 32(9):2502-2509.
[35]
Liu C, Wang S, Liu H, et al. Why did the 1980s’ reform of collective forestland tenure in Southern China fail?[J]. Forest Policy and Economics, 2017,83:131-141.
[36]
韦西勤. 我国速生产林现状与存在的问题[J]. 林业调查规划, 2010(5):115-118.
Wei X Q. Current situation and problems of fast-growing and high-yielding plantation in China High-yielding plantation in China[J]. Forest Inventory and Planning, 2010(5):115-118.
 2025, Vol. 37
  ), 袁武彬2, 李恒凯1(