

0 引言
随着青藏高原地区湖泊多年水位持续上升,高原水患类型从以往的以小型冰川湖溃决为主,逐渐转为兼有中-大型构造湖漫溢溃决与淹没灾害并发的态势。冰川湖是冰川侵蚀作用造成冰碛坝堆积,在冰川融化退缩后,积水被坝体阻隔形成的湖泊,多在高海拔地区分布,面积相对较小; 构造湖是由地壳运动作用形成的构造凹陷蓄水型湖泊,通常面积较大[14]。冰川湖溃决灾害是青藏高原地区常见的水患类型,据统计,1960年以来各类溃决事件达27次,给周围居民生产生活及生命财产安全带来严重威胁[15]。频繁发生的冰湖溃决使该类型灾害成为青藏高原地区的热点研究内容,冰川湖的溃决的诱因、崩溃机制及冰川潜在溃决威胁预测风险评估等已经取得了长足的研究进展[16-
色林错是青藏高原目前扩张最为显著的构造湖之一,其周边人类活动频繁,牧场、牧民房屋、牲口围栏及交通干线众多,存在较高的水患风险。本文基于多源、长时序光学卫星及测高卫星数据,系统重建1995—2023年间来色林错湖泊面积、水位与水量变化的时间序列,利用趋势分析方法研究不同阶段的水域变化特点和淹没特征,并对后续淹没风险及其影响进行初步判断。
1 研究区概况及数据源
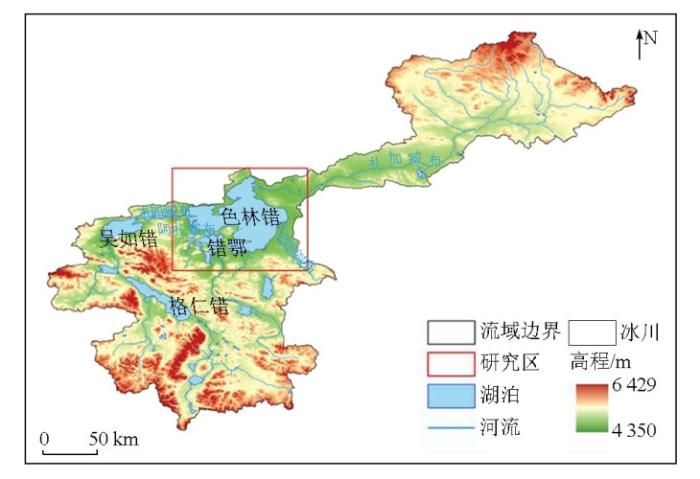
1.1 研究区概况
图1
1.2 数据来源
1.2.1 卫星光学影像
本文选取陆地卫星(Landsat TM/ETM+)和高分一号卫星(GF-1)提取色林错的水域边界范围。陆地卫星数据通过美国地质调查局的官网(
表1 光学遥感卫星详情
Tab.1
| 数据年份 | 传感器类型 | 空间分辨率/m | 数据格式 |
|---|---|---|---|
| 1995—2012年 | Landsat TM/ETM+ | 30 | GeoTIFF |
| 2013—2023年 | GF-1 WFV | 16 | GeoTIFF |
综合考虑数据结果年内变化的准确性与年际变化的一致性,结合可获取光学卫星影像实际,选取Landsat TM/ETM+传感器影像提取1995—2012年的色林错水域边界,选取GF-1 WFV传感器获取影像提取2013—2023年的边界信息。从数据覆盖的时间完整性角度而言,由于GF-1卫星发射于2013年,Landsat可较好地对之前的数据进行补充; 从空间分辨率上看,GF-1 WFV数据精度较Landsat数据提高近1倍,可以对水体边界进行更加精确的识别。上述卫星广泛的覆盖范围及足量的存档数据,使其成为了非常适合提取目标湖泊水体信息的数据源。
本文以Landsat TM/ETM+影像及GF-1 WFV影像为主要数据源,对色林错1995—2023年汛期后的光学影像进行预处理、几何纠正、图像增强、镶嵌匀色等数据处理流程,各个步骤均基于ENVI 5.3平台完成。在此基础上通过B4(R),B2(G),B1(B)假彩色合成以突出显示水体,并基于ArcGIS 10.8平台对水域边界进行人机交互解译,以掌握色林错1995—2023年间的面积变化特征。
1.2.2 卫星测高数据
为准确测量色林错湖面水位的时序变化特征,本文选取ERS-2,ICESat,CryoSat-2和ICESat-2等多源卫星数据获取高程信息。
ERS-1和ERS-2卫星由欧洲空间局(European Space Agency, ESA)研制,分别于1991年7月17日和1995年4月21日发射,搭载有雷达高度计(Radar altimeter, RA)。据以往研究,ERS-1数据在发射初期数据质量较差,在多数陆地水位研究中未予采纳[23
ICESat卫星由美国国家航空航天局(National Aeronautics and Space Administration, NASA)于2003年1月13日发射,其搭载的地球科学激光高度计系统(geoscience laser altimeter system, GLAS)具有之前传感器所未有的精度。本文选择ICESat的GLAS提供L2 GLAH14数据完成2003—2009年的色林错水位测量。
表2 卫星基本参数
Tab.2
| 测高卫星 | 传感器 | 工作年份 | 周期/d | 足迹间距/m | 精度/cm |
|---|---|---|---|---|---|
| ERS-2 | RA | 1995—2011年 | 35 | 约300 | 约10 |
| ICESat | GLAS | 2003—2009年 | 91 | 约170 | 约10 |
| CryoSat-2 | SIRAL | 2010年至今 | 369 | 约300 | 1~3 |
| ICESat-2 | ATLAS | 2018年至今 | 91 | 约0.7 | 约3 |
1.2.3 误差校正数据
由于实测湖泊水位数据稀少且很少对外发布,为消除各测高卫星之间的误差,本文选取已有大量验证和应用的Hydroweb数据集作为误差校正数据。该数据集包括427个湖泊和水库的时间序列水位与面积观测结果。以往研究表明,Hydroweb数据在大型湖泊中的精度优于10 cm,在中型湖泊中的精度优于分米级[27]。本文将其中色林错1995—2023年的数据作为误差校正数据,用于水域面积结果检验、水位数据偏差纠正及评估各测高卫星的水位监测结果。
2 研究方法
2.1 测高数据处理方法
2.1.1 湖泊水位计算
由于本文选取ERS-2,ICESat,CryoSat-2和ICESat-2等测高卫星数据的来源、传感器及年代各不相同,不同卫星的原始数据处理存在一定差异。因此,原始数据的筛选及解算的方法选取合理与否,将直接决定最终得到结果的准确性。
原始数据筛选主要是剔除异常数据并尽可能地保留可用测点,一般而言包括3个步骤: ①综合考虑卫星地面足迹尺寸与湖岸线周边地形特征,合理建立数据筛选区,以实现对水域边界高程特征的准确表达; ②对每个测点足迹进行目视检查,对显著的离群异常值进行剔除; ③使用归一化中值绝对误差,进一步剔除显著偏离中误差值的测点后,最终得到均匀分布的测高点足迹,将此结果的均值作为水位高程。
在数据解算阶段,根据卫星传感器及其可提供的原始数据集特征,选取对应方法开展处理工作,以获取湖泊水位高度。
ERS-2卫星与CryoSat-2卫星均由ESA发射升空,原始数据包含多个卫星测距参数及多项地球物理误差改正参数,二者的数据处理原理相同。色林错属内陆湖,相对海洋来说湖泊面积较小,因此在处理过程中无需考虑海潮、潮压、逆气压、热膨胀等地球物理参数影响[23]。一般解算处理公式为:
式中: h为湖面基于EGM2008大地水准面的正高; Halt为卫星基于WGS84参考椭球体的椭球高; Hrange为卫星高度计测得的卫星到星下点的距离; Rcorr为测高卫星的各项误差改正值; M为EGM2008大地水准面高度; Hdry为干对流层改正; Hwet为湿对流层改正; Hiono为电离层改正; Hset为固体潮改正; Hpol为极潮改正。上述变量单位均为m。
ICESat卫星的参考椭球高度均已包含各项误差改正值,因此无需使用式(1)和式(2)进行计算,可直接代入以下公式:
h=Htp-M-0.7,
式中Htp为Topex/Poseidon参考椭球体下湖泊的高程,m。
ICESat-2卫星原始数据集中已经包含了代表正高的参数,可以直接作为湖面的水位高度进行使用。
2.1.2 数据误差校正
通过测高数据处理得到的基于同一大地水准面(EGM2008)的正高,因传感器间差异可能导致系统误差,因此还需进行偏差校正处理。
本文选取精度较高的ICESat-2卫星数据作为校正基线,对ERS-2,CryoSat-2和ICESat等卫星数据进行误差校正。对与ICESat-2卫星有重合时段的待校正数据,可通过月度数据匹配法获取系统误差,公式为:
式中: Biascov为重合时间段的待校正测高数据与ICESat-2间的偏差; N为重合时间的匹配月份数; Hcov和HI分别为重合时间段的待校正测高数据和ICESat-2的月度水位。
对于与ICESat-2卫星无重合时间段的待校正测高数据,可利用Hydroweb数据进行月度数据匹配,以获得系统误差,公式为:
式中: Biasnonc为无重合时间段的待校正测高数据和ICESat-2间的平均偏差; N1为无重合时间段的待校正测高数据与Hydroweb数据的匹配月份数; N2为ICESat-2数据与 Hydroweb数据的匹配月份数; Hnonc为无重合时间段的待校正测高数据的月度水位; HV为Hydroweb的月度水位。
2.2 水量计算
一般地,湖泊水量变化主要依据不同时期的水域高程及对应面积来计算,公式为:
式中:
3 结果及验证
3.1 水域面积提取
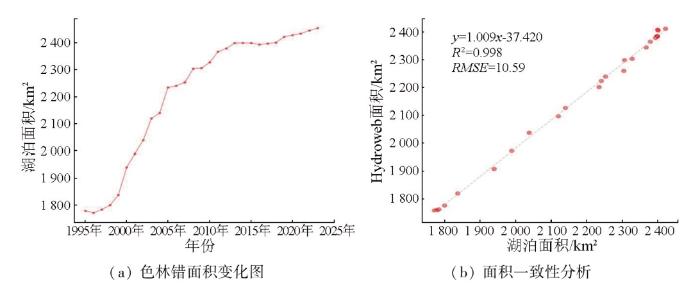
基于卫星光学影像1995—2023年间色林错水域面积提取结果,详见图2。提取得到的面积与Hydroweb数据的面积的相关系数为0.998,均方根误差为10.59 km2,具有较好的一致性。
图2
3.2 湖泊水位计算
3.2.1 测点筛选
按前文所述方法,选取对应时段光学影像提取水域边界,由于湖泊边界地形的影响,测高卫星高度计容易采集到非湖泊内数据,因此,本文以湖泊边界向内建立1 km缓冲区,剔除缓冲区内的测高点,通过目视检查及偏离中误差值的异常筛查,得到均匀分布的测高点足迹,以其平均值作为当前时段对应水位,筛选后的足迹数据分布如图3所示。
图3
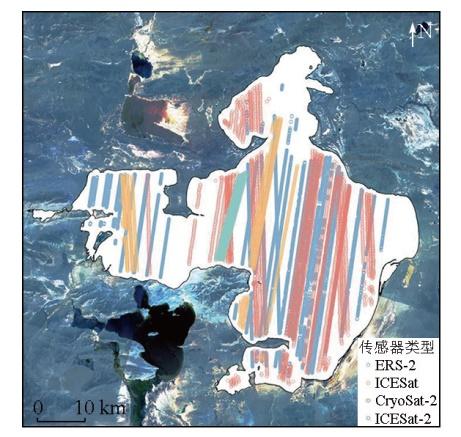
图3
色林错水位测点足迹数据分布示意图
Fig.3
Satellite track of water level monitoring of Siling Co
3.2.2 水位解算
依照式(1)—(3),依次解算ERS-2,ICESat,CryoSat-2和ICESat-2等卫星经筛选后的测高数据,得出1995—2023年基于不同传感器的湖面汛期月度水位变化。但是因轨道变化,大气校正模型之间的差异以及传感器相关的误差使得得到的正高可能存在系统误差,因此需要对多个卫星传感器的湖泊水位序列进行偏差校正。
本文将ICESat-2作为基线,以消除其他3个卫星传感器的系统误差,在色林错边界范围内,由于CryoSat-2与ICESat-2数据有重合部分,本文选择ICESat-2与CryoSat-2重合时间段2018年10月—2020年12月内观测的16对数据进行匹配,通过式(4)计算得出CryoSat-2的平均偏差为2.03 m。对于与ICESat-2数据没有重合的ERS-2和ICESat数据,本文以2018年10月—2020年12月的ICESat-2与Hydroweb数据的平均差作为相对误差基准,之后取14对ICESat数据和13对ERS-2数据与Hydroweb数据的平均差进行误差校正,通过式(5)计算得出ICESat的平均偏差为-0.48 m,ERS-2的平均偏差为-1.78 m。最后,将ERS-2,ICESat,CryoSat-2的月度数据减去平均偏差即可得到消除星间系统误差的湖泊水位。误差校正前后对比如图4所示,水位变化如表3所示。
图4
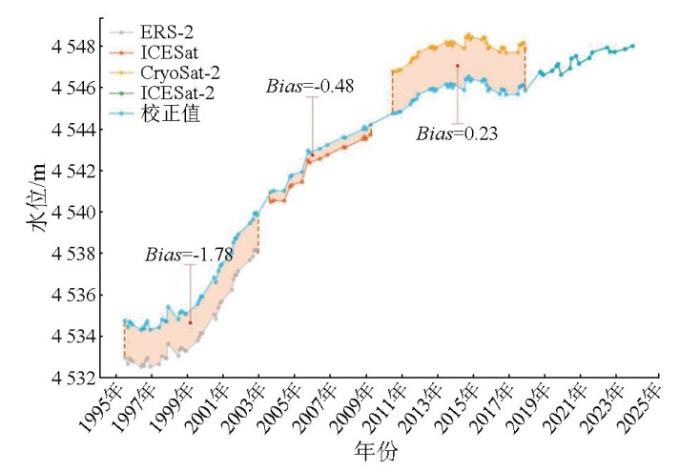
表3 色林错1995—2023年平均水位变化
Tab.3
| 年份 | 传感器类型 | 统计月数/月 | 平均水位/m |
|---|---|---|---|
| 1995年 | ERS-2 | 5 | 4 534.63 |
| 1996年 | 6 | 4 534.46 | |
| 1997年 | 5 | 4 534.83 | |
| 1998年 | 5 | 4 535.08 | |
| 1999年 | 4 | 4 535.80 | |
| 2000年 | 5 | 4 537.11 | |
| 2001年 | 5 | 4 538.60 | |
| 2002年 | 5 | 4 539.77 | |
| 2003年 | ICESat | 2 | 4 541.01 |
| 2004年 | 3 | 4 541.51 | |
| 2005年 | 3 | 4 542.60 | |
| 2006年 | 2 | 4 543.15 | |
| 2007年 | 2 | 4 543.61 | |
| 2008年 | 2 | 4 544.06 | |
| 2009年 | 2 | 4 544.11 | |
| 2010年 | CryoSat-2 | 4 | 4 544.81 |
| 2011年 | 5 | 4 545.43 | |
| 2012年 | 5 | 4 545.92 | |
| 2013年 | 6 | 4 546.13 | |
| 2014年 | 6 | 4 546.34 | |
| 2015年 | 6 | 4 546.18 | |
| 2016年 | 5 | 4 545.82 | |
| 2017年 | 6 | 4 545.99 | |
| 2018年 | ICESat-2 | 3 | 4 546.70 |
| 2019年 | 4 | 4 546.82 | |
| 2020年 | 4 | 4 547.27 | |
| 2021年 | 2 | 4 547.58 | |
| 2022年 | 3 | 4 547.81 | |
| 2023年 | 2 | 4 547.95 |
3.2.3 精度验证
通过计算多源卫星测高数据和Hydroweb数据的月平均水位,将每个卫星的数据按照月份与Hydroweb数据配对建立时间序列。如图5所示,图中卫星测高水位数据与Hydroweb数据之间有着明显的偏移,这是因为本文计算水位的参考基准为EGM2008,而Hydroweb数据的参考基准是GGMO2C全球重力场模型。基于上述原因,本文在计算并消除时间序列上卫星测高水位数据与Hydroweb数据间的平均偏差后,计算相关系数及均方根误差来估计卫星测高水位数据与Hydroweb数据的相关性。计算结果显示,配对数据间的平均偏差为0.85 m,相关系数为0.998 5,均方根误差为0.15 m,由此可见,ERS-2,ICESat/ICESat-2,CryoSat-2计算的水位与Hydroweb数据之间的数据吻合度高,误差小,呈密切相关。
图5
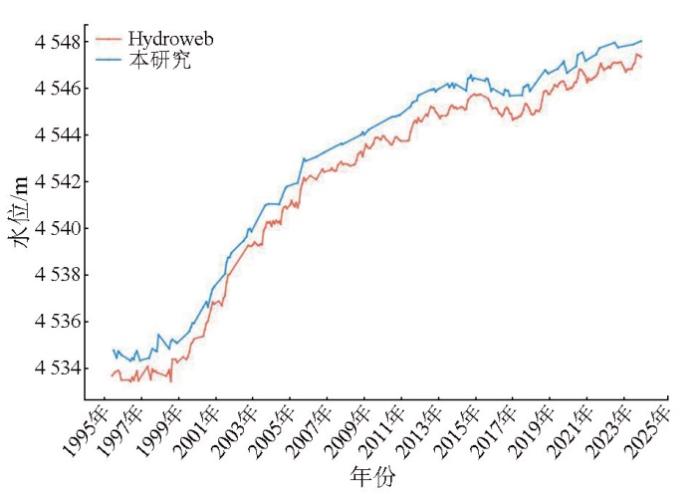
图5
1995—2023年色林错卫星测高数据与Hydroweb数据水位比较
Fig.5
Comparison of lake water levels derived from satellite altimetry data and Hydroweb data, during 1995—2023
3.3 湖泊水量计算
通过结合湖泊面积变化和水位变化,使用式(6)来估计湖泊的水量变化,湖泊水量变化首先计算相邻2 a间的变化,即1995—1996年、1996—1997年,直至2022—2023年。1995—2023年湖泊水量变化是相邻年份变化的累计总和,详情如表4所示。
表4 色林错1995—2023年间水量变化
Tab.4
| 年份 | 水量/Gt | 年份 | 水量/Gt | 年份 | 水量/Gt |
|---|---|---|---|---|---|
| 1995—1996年 | -0.30 | 2005—2006年 | 1.23 | 2015—2016年 | -0.86 |
| 1996—1997年 | 0.66 | 2006—2007年 | 1.03 | 2016—2017年 | 0.41 |
| 1997—1998年 | 0.45 | 2007—2008年 | 1.03 | 2017—2018年 | 1.70 |
| 1998—1999年 | 1.31 | 2008—2009年 | 0.12 | 2018—2019年 | 0.31 |
| 1999—2000年 | 2.47 | 2009—2010年 | 1.62 | 2019—2020年 | 1.07 |
| 2000—2001年 | 2.95 | 2010—2011年 | 1.46 | 2020—2021年 | 0.75 |
| 2001—2002年 | 2.36 | 2011—2012年 | 1.16 | 2021—2022年 | 0.56 |
| 2002—2003年 | 2.58 | 2012—2013年 | 0.50 | 2022—2023年 | 0.32 |
| 2003—2004年 | 1.06 | 2013—2014年 | 0.50 | 1995—2023年 | 28.45 |
| 2004—2005年 | 2.38 | 2014—2015年 | -0.38 |
4 水域变化特征及淹没趋势
4.1 水域变化情况
色林错1995—2023年间整体呈现扩张趋势,面积增加了676.75 km2,扩张幅度为38.05 %,年平均增长速率为24.17 km2/a; 水位上升约13.32 m,上升幅度为0.29 %,平均上升速率为0.48 m/a; 总体水量增加了28.45 Gt,年均增长速率为1.02 Gt/a,总体变化情况如图6所示。
图6
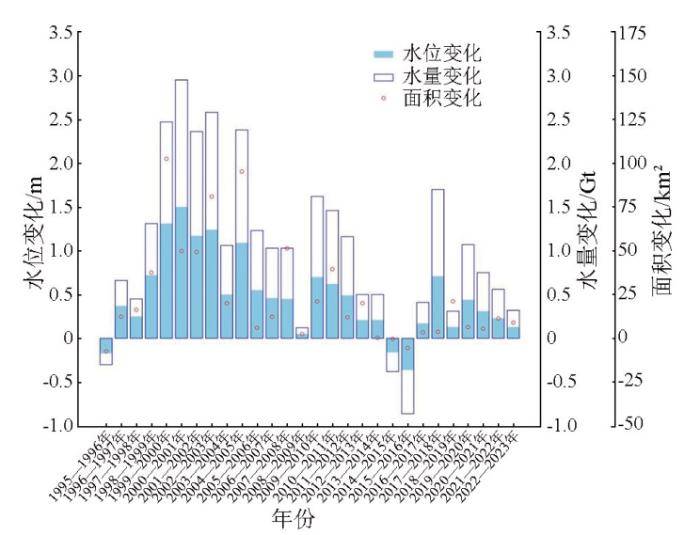
图6
色林错面积、水位和水量变化趋势
Fig.6
Variation trend of Siling Co area, water level and volume
色林错的面积变化趋势与水位整体变化趋势有很好的一致性,二者的相关系数为0.994 8,呈现显著的相关性。1995—1996年水位下降约0.17 m,面积萎缩约7.41 km2,水量减少约0.3 Gt; 1996—2014年水位逐年增加,呈持续扩张态势,面积扩张约629.2 km2,平均扩张速率为34.96 km2/a; 水位上升约11.89 m,平均上升速率为0.66 m/a; 水量增加约24.87 Gt,平均增长速率为1.38 Gt/a。2014年之后具有一定地波动特征,2014—2016年稍有萎缩,面积萎缩约5.78 km2,水位下降约0.52 m,水量减少约1.24 Gt。2016—2023年继续扩张,面积扩张约60.74 km2,平均扩张速率为8.68 km2/a; 水位上升约2.12 m,平均上升速率为0.3 m/a; 水量增加约5.12 Gt,平均增长速率为0.73 Gt/a。
图7
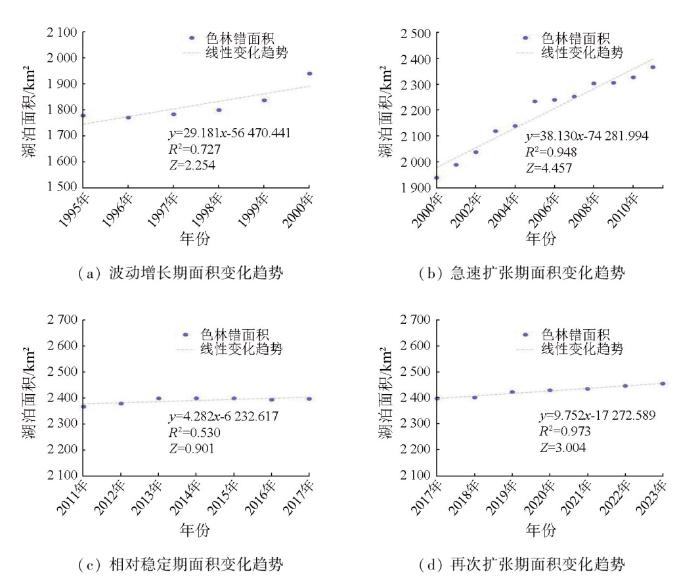
表5 各阶段色林错Mann-Kendall趋势检验
Tab.5
| 年份 | 时期 | R2 | Z | P |
|---|---|---|---|---|
| 1995—2000年 | 波动增长期 | 0.73 | 2.254 | 0.01 < P <0.05 |
| 2000—2011年 | 急速扩张期 | 0.95 | 4.457 | P < 0.001 |
| 2011—2017年 | 相对稳定期 | 0.53 | 0.901 | P > 0.05 |
| 2017—2023年 | 再次扩张期 | 0.97 | 3.004 | P < 0.01 |
第一阶段1995—2000年为波动增长期。水域面积由1 778.38 km2扩张到1 939.68 km2,总体增长161.29 km2,平均增长速率为32.26 km2/a。在此期间,1995—1996年面积萎缩了7.4 km2,之后的1996—2000年面积逐年增加(Z=2.254,0.01<P<0.05)。
第二阶段2000—2011年为急速扩张期,2011年的水域面积为2 367.67 km2,相较于2000年总体增长了427.99 km2,平均增长速率为38.91 km2/a。此阶段是色林错整个时间序列中水域面积增长速率最快的时期,呈非常显著的增长趋势(Z=4.457,P<0.001)。
第三阶段2011—2017年为相对稳定期,2014年水域面积为2 400.18 km2,是该时期水域面积最大值,面积较2011年仅增长了32.51 km2。该阶段的色林错与之前的阶段相比,面积增长速度明显放缓,趋势检验判断该阶段无显著趋势(Z=0.901, P >0.05),但湖泊面积仍有小幅度增长。
第四阶段2017—2023年为再次扩张期,2023年的水域面积为2 455.13 km2,面积相较于较2017年增长了57.31 km2,平均增长速率为9.55 km2/a。该阶段相对于第三阶段,湖泊的增长速率有了明显的提升,呈显著的增长趋势(Z=3.004, P<0.01),色林错脱离相对稳定期开始继续扩张。
与色林错面积变化4个阶段相对应,波动增长期湖泊水位上升约2.48 m,平均上升速率为0.5 m/a,水量增加4.59 Gt,平均每年增长速率为0.92 Gt/a; 急速扩张期湖泊水位上升约8.33 m,平均上升速率为0.76 m/a,水量增加了17.82 Gt,平均每年的增长速率为1.62 Gt/a,在该阶段出现了1.5 m的最大幅度水位上升和2.95 Gt的最大幅度水量上升; 相对稳定期水位上升约0.56 m,平均水位上升速率为0.09 m/a,水量增加了1.33 Gt,平均每年的增长速率为0.22 Gt/a,相对其他阶段较为平稳; 再次扩张期水位上升约1.95 m,平均上升速率为0.33 m/a,水量增加4.71 Gt,平均每年的增长速率为0.79 Gt/a。
4.2 淹没趋势及特征
由于地形陡缓不一,色林错在涨水的过程中淹没范围及外扩距离也有所差异,例如受新生代构造控制作用影响,在南北方向的地势相对平缓,同一涨水条件下外扩淹没范围会更广。图8为以色林错4个变化阶段的节点年份做出的湖泊范围变化图,由图可见,湖泊南北方向的淹没范围扩张要显著大于湖泊东西方向,其中波动增长期和急速扩张期尤为显著。
图8
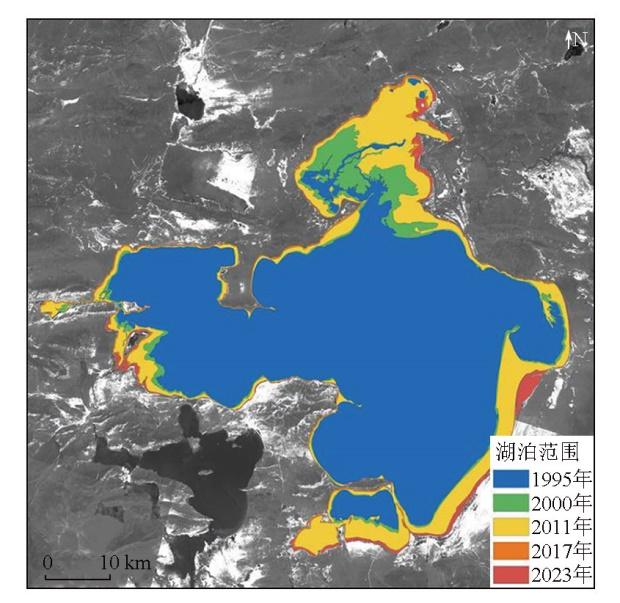
图8
色林错1995—2023年淹没范围变化
Fig.8
Inundated area changes of Siling Co from 1995 to 2023
色林错年际水量变化特征是面积与水位综合作用的结果。本文基于ArcGIS10.8平台,将水域扩张区的年际水量变化值为输入点要素,通过核密度分析工具进行插值计算,以得到各阶段的显著淹没趋势区域,如图9所示。结果显示,在色林错变化的4个阶段中,波动增长期和急速扩张期的淹没趋势较为显著,相对平稳期淹没区域不明显,再次扩张期淹没区于湖泊东部最为显著。
图9
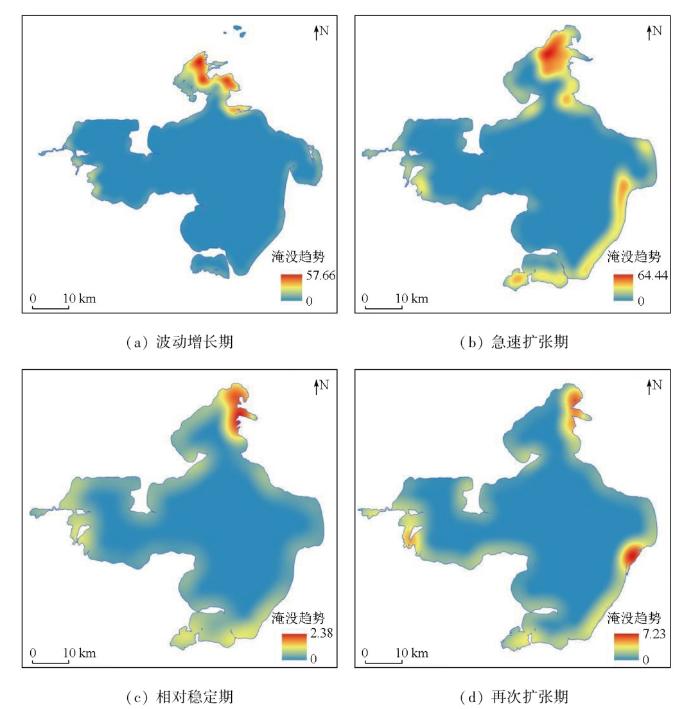
其中,波动增长期淹没区主要集中在水域北方,淹没趋势最高可达57.66,淹没区具有很高的集中性; 急速扩张期淹没区主要分布在水域南方和北方,水域北方的淹没趋势更加严峻,淹没趋势最高可达64.44,该阶段是4个阶段中淹没范围最广,局部淹没趋势最高的时期; 相对稳定期水域整体较稳定,最高淹没趋势仅2.38,水域北部和西部淹没区略有扩张; 再次扩张期水域东部的淹没趋势相对较高,最高淹没趋势为7.23,这说明色林错的稳定期正在结束,目前湖泊已经到了新的阶段,具有较高的淹没风险。
图10
4.3 潜在淹没风险初判
为进一步评估色林错后续淹没隐患风险,笔者将最大古湖岸线圈定范围作为潜在淹没区,利用高分辨率光学遥感影像对其内的牧民自建房屋、牧栏、草场以及公路等承灾体进行识别,并以各个承灾体为输入点要素,以其所处的距离当前水域边界范围的区间(100 m,500 m,1 000 m)为权重参数,利用核密度工具(Spatial Analyst)进行拟合分析,形成色林错周边潜在淹没威胁区(图11)。
图11
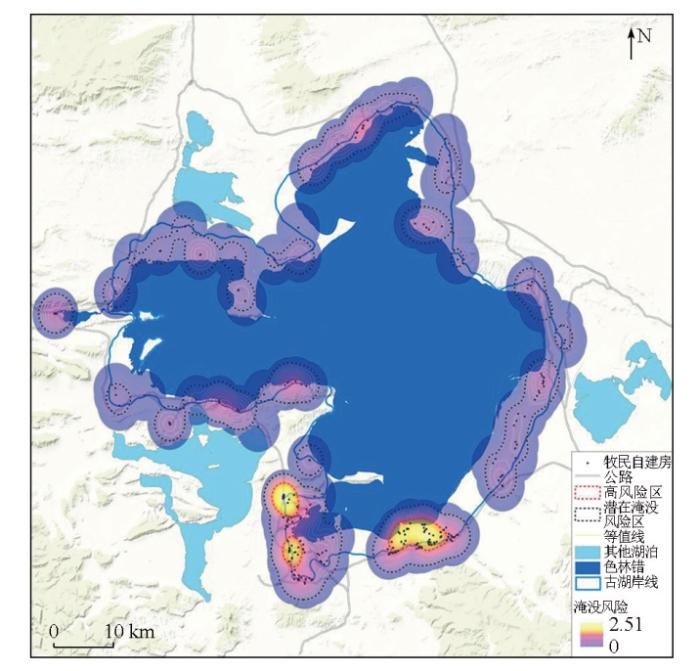
如图11所示,色林错最大古湖岸线范围内分布有348处牧民自建房屋、1条国道及1条省道。其中,属潜在淹没区范围的牧民自建房342处,受威胁道路包括G317,S208及其辅路。湖岸南侧存在3处高风险区,主要位于雄村、崀梅塘村等地,对133处牧民自建房构成较高的淹没威胁。
据政府间气候变化专门委员会(Intergovernmental Panel on Climate Change, IPCC)第六次评估报告显示,在其模拟的5种气候变化情景模型中,即使在最乐观的情况下,短期内全球温度上升仍可能达到1.5 ℃,全球平均海平面或上升0.15~0.23 m[32]。在此背景下,色林错未来的淹没风险较高,整体形势不容乐观。特别是色林错南岸因地势平缓,近年来淹没趋势显著,若水位继续上升,将严重影响当地居民的生产生活,造成经济损失。
因此,建议未来加强对色林错周边、特别是湖泊南岸区域的淹没灾害防范工作,开展持续遥感监测及定期实地巡查,对已受淹没影响的牧民房屋、牧栏及草场等进行及时救助,对可能影响的公路干线实施必要的工程治理措施,以有效提升当地水患灾害防御能力。
5 结论
本文基于多源遥感卫星,对青藏高原色林错1995—2023年湖泊面积、水位和水量的变化趋势进行了系统分析并且对湖泊当前淹没状况和未来的淹没风险进行了评估,得出如下结论:
1)色林错1995—2023年间整体呈现扩张趋势,面积增加676.75 km2,年均增长速率为24.17 km2/a; 水位上升约13.32 m,平均上升速率为0.48 m/a; 总体水量增加28.45 Gt,平均年增长速率为1.02 Gt/a。湖泊面积、水位的变化趋势有很好的一致性,相关系数为0.99。
2)色林错在1995—2023年间来的变化共经历4个阶段,包括1995—2000年的波动增长期、2000—2011年的急速扩张期、2011—2017年的相对稳定期及2017—2023年的再次扩张期。
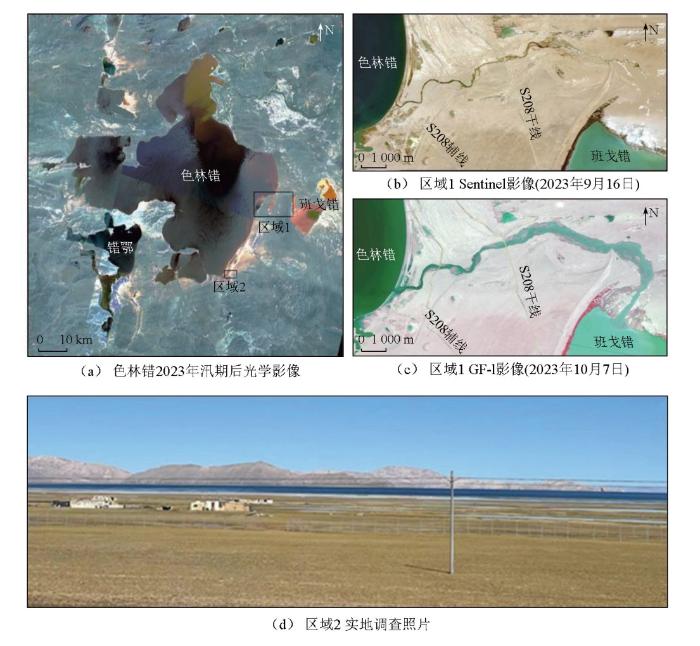
3)在色林错变化的4个阶段中,波动增长期和急速扩张期的淹没区域主要集中在湖泊南北方向,相对平稳期淹没区无明显扩张,再次扩张期淹没区分布于湖泊东部,近年来受湖泊扩张及淹没趋势影响,湖泊东部和南部已经出现了道路、草场淹没,牧民驻地周边湿地化等淹没灾害事件。
4)在色林错水域持续扩张的趋势下,湖泊南岸区域有3处淹没高风险区,覆盖133处牧民自建房、G317和S208干线等多条道路,建议当地政府予以重点关注。
本文对色林错的潜在淹没风险判断以定性分析为主,拟合结果及威胁区的范围仅具指示意义。下一步,可结合气候变化数据构建“水量-气象”耦合分析模型,对未来的水域变化情况进行定量预测,进而对淹没风险区域进行精准划分,从而更加深入了解湖泊变化趋势与淹没灾害间的关系,为后续研究同类型淹没灾害提供依据。
参考文献
1979—2017年青藏高原色林错流域气候变化分析
[J].
Analysis of climate change in the Selin Co basin,Tibetan Plateau,from 1979 to 2017
[J].
青藏高原湖泊变化遥感监测及其对气候变化的响应研究进展
[J].
DOI:10.18306/dlkxjz.2018.02.004
[本文引用: 1]

青藏高原位于中国西南部、亚洲中部,平均海拔高程大于4000 m,面积约300万km2,是“世界屋脊”,与周边地区一起常被称为地球的“第三极”。青藏高原分布着约1200个面积大于1 km2的湖泊,占中国湖泊数量与面积的一半;同时也是黄河、长江、恒河、印度河等大河的源头,被称为“亚洲水塔”。近几十年来,在全球变暖的背景下,青藏高原升温更加突出,其能量与水循环发生了显著变化,气候趋于暖湿化,冰川加速消融,湖面水位上升。湖泊是气候变化的重要指标,青藏高原湖泊分布密集、人为活动影响较小,多源遥感数据的广泛应用,为监测高原湖泊变化提供了难得的契机。本文依托国家自然科学基金青年项目“基于多源遥感的青藏高原内流区湖泊水量变化及水体相态转换研究(2000-2009年)”,主要研究进展为:初步查明了西藏高原的湖泊数量、面积及水位变化与时空格局,以及湖泊水量变化与水量平衡;探讨了湖泊变化对气候变化的响应。目前对青藏高原湖泊的变化及驱动因素虽有一些认识,但其定量的水量平衡及驱动机制还有待于进一步研究。这对了解世界第三极、一带一路国家和地区水资源状况与变化、生态文明和生态安全屏障建设具有重要的意义,同时也可为第三极国家公园的建立提供重要的科学基础。
Changes in lakes on the Tibetan Plateau observed from satellite data and their responses to climate variations
[J].
DOI:10.18306/dlkxjz.2018.02.004
[本文引用: 1]
The Tibetan Plateau (TP) is located in the southwest of China and central Asia, with a mean elevation higher than 4000 m and area of 3×10⁶ km2. It is named "the roof of the world". The TP and surrounding areas together is also called "the Third Pole". The TP has 1200 lakes greater than 1 km2 in area, which accounts for approximately 50% of the total number and area of lakes in China. It is the sources of the Yellow River, the Yangtze River, the Indus, Ganges, Brahmaputra, Irrawaddy, Salween, and the Mekong, and therefor known as "Asia's water tower". In the past several decades, the TP experienced a faster warming than other regions in the world. The climate of the TP is also getting wetting. Lakes are indicators of climate change. The TP has the dense distribution of lakes with little disturbance of human activities. The utilization of multi-sensors’ data has provided a useful tool to monitor lake change in the remote TP. Several studies of lake changes have been conducted focusing on the following scientific questions: (1) how many lakes are on the TP and what are the spatial and temporal changes of the number, area, and abundance of these lakes? (2) the increased mass over the TP from glaciers or lakes? (3) under anthropogenic warming, how did the water and cryosphere cycles change on the two adjacent largest Plateaus in the world, the Tibetan and the Mongolian Plateaus, over the last four decades? and (4) how did the lake water storage and water balance change? These studies are of great significance to the understanding of the third pole of the world, the state of regional water resources and changes, and ecological civilization and ecological security construction. They also provide an important scientific basis for the planning of the third polar national park. The quantitative understanding of lake water balance and mechanisms and driving factors of lake change needs further work in the future.
Accelerated lake expansion on the Tibetan Plateau in the 2000s:Induced by glacial melting or other processes?
[J].DOI:10.1002/wrcr.v50.4 URL [本文引用: 1]
青藏高原湖泊面积、水位与水量变化遥感监测研究进展
[J].
Progress in remote sensing monitoring of lake area,water level,and volume changes on the Tibetan Plateau
[J].DOI:10.11834/jrs.20221171 URL [本文引用: 1]
青藏高原气候系统变化及其对东亚区域的影响与机制研究进展
[J].
DOI:1001-8166(2014)02-0207-09
[本文引用: 1]
青藏高原地区特殊的大气圈、水圈、冰冻圈、生物圈等多圈层相互作用过程及其变化,不仅对青藏高原及其周边地区的气候格局和变化有重要影响,而且对东亚、北半球乃至全球的环流形势和异常产生深远影响。为此,全球变化研究重大科学研究计划于2010年9月启动了#cod#x0201c;青藏高原气候系统变化及其对东亚区域的影响与机制研究#cod#x0201d;项目,旨在开展青藏高原环境、地表过程、生态系统对全球变化的响应及其对周边地区人类生存环境影响的综合交叉研究,以揭示青藏高原气候系统变化及其对东亚区域的影响机制,提出前瞻性的应对气候变化与异常的策略,减少其导致的区域自然灾害的损失。项目实施近3年来,开展了青藏高原首次#cod#x0201c;星#cod#x02014;机#cod#x02014;地#cod#x0201d;综合立体协同观测试验和大规模地气相互作用综合观测试验。在遥感结合地面观测估算青藏高原地表特征参数和能量通量方法,高原地区上对流层和下平流层结构,高原季风与东亚季风和南亚季风之间的内在联系,中国及青藏高原地区太阳辐射和风速的年代际变化趋势,青藏高原春季感热源减弱及其对亚洲夏季风和中国东部降水的影响,以及极高海拔地区土地覆被格局等方面取得了一些突出进展。
Study progresses of the Tibet Plateau climate system change and mechanism of its impact on East Asia
[J].
DOI:1001-8166(2014)02-0207-09
[本文引用: 1]
The interaction between atmosphere, hydrosphere, cryosphere and biosphere of the Tibetan Plateau (TP) significantly affects not only climate pattern and climate change in local and surrounding area, but also the Asian monsoon process and the global atmospheric circulation. The study of the #cod#x0201c;Tibet Plateau climate system change and mechanism of its impact on East Asia#cod#x0201d;, a project of the National Key Scientific Research Program of China for Global Change Study, was initiated in September of 2010. It aimed at performing integrated research on the Tibetan Plateau climate system responding to global change and its impact on surrounding areas, collaborating on major scientific issues to achieve breakthrough in scientific research on the Tibet Plateau climate system change and mechanism of its impact on East Asia, proposing prospective strategy coping with abnormal climate change to reduce regional natural disaster losses. A simultaneous and coordinated experiment of airborne remote sensing and groundbased observation was carried out in TP for the first time. And a series of research results have been achieved in the past three years of project implementation. The results include determination of regional distributions and seasonal variations of land surface heat fluxes in whole TP region, behavior of the tropopause folding events over the west TP, definition of plateau monsoon and its association with general circulation anomalies, decrements of solar radiation and wind speed across China and TP area in recent decades and their possible causes, weaken trend of sensible heat source in the spring over TP and its impact on the Asian summer monsoon, and classification of land cover in high altitude region of Mount Qomolangma, etc.
Response of Tibetan Plateau lakes to climate change:Trends,patterns,and mechanisms
[J].
Monitoring lake changes of Qinghai-Tibetan Plateau over the past 30 years using satellite remote sensing data
[J].DOI:10.1007/s11434-014-0128-6 URL [本文引用: 1]
High-altitude salt lake elevation changes and glacial ablation in Central Tibet,2000—2010
[J].DOI:10.1007/s11434-011-4849-5 URL
Changes in inland lakes on the Tibetan Plateau over the past 40 years
[J].Inland lakes and alpine glaciers are important water resources on the Tibetan Plateau. Understanding their variation is crucial for accurate evaluation and prediction of changes in water supply and for retrieval and analysis of climatic information. Data from previous research on 35 alpine lakes on the Tibetan Plateau were used to investigate changes in lake water level and area. In terms of temporal changes, the area of the 35 alpine lakes could be divided into five groups: rising, falling-rising, rising-falling, fluctuating, and falling. In terms of spatial changes, the area of alpine lakes in the Himalayan Mountains, the Karakoram Mountains, and the Qaidam Basin tended to decrease; the area of lakes in the Naqu region and the Kunlun Mountains increased; and the area of lakes in the Hoh Xil region and Qilian Mountains fluctuated. Changes in lake water level and area were correlated with regional changes in climate. Reasons for changes in these lakes on the Tibetan Plateau were analyzed, including precipitation and evaporation from meteorological data, glacier meltwater from the Chinese glacier inventories. Several key problems, e.g. challenges of monitoring water balance, limitations to glacial area detection, uncertainties in detecting lake water-level variations and variable region boundaries of lake change types on the Tibetan Plateau were discussed. This research has most indicative significance to regional climate change.
Patterns and potential drivers of drama-tic changes in Tibetan lakes,1972—2010
[J].
Area,lake-level and volume variations of typical lakes on the Tibetan Plateau and their response to climate change,1972—2019
[J].
DOI:10.1080/10095020.2021.1940318
[本文引用: 1]
Most lakes have undergone significant changes on the Tibetan Plateau in recent decades, affecting water resources on the Tibetan Plateau and its surrounding areas. In this paper, we investigated the variations of 25 lakes in five sub-regions on the Tibetan Plateau from 1972 to 2019 based on SRTM DEM data and Landsat imagery. We used a method to derive lake-levels based on DEM and lake boundaries delineated from Landsat imagery, and then calculated the changes in lake area, level, and volume in 1972 to 2019. We also analyzed the potential impacts of temperature, precipitation, glacial and permafrost melting in lake changes during this period. The results show that the lakes tended to shrink until 2010 in southern and western plateau, after which they began to expand gradually but the overall trend is still shrinking. Limited meltwater from glaciers and permafrost and low precipitation are the main reasons for their shrinkage. The lakes in the central plateau, northwest plateau and northeast plateau tend to expand overall. The reason for the expansion of the lakes is not only precipitation but also the melting of glaciers and permafrost. Overall, the lake changes have gone through 3 phases, namely a slight decrease during 1972-2000, a rapid increase during 2000-2010, and a slowdown in the last decade (2010-2019). Multiple factors such as temperature, precipitation, the state of glaciers and permafrost have contributed to the changes in the lake.
近30年色林错湖面变化特征及其对气候变化的响应
[J].
Variation of Selin Co lake area during 1988—2020 and its response to climate change
[J].
1961—2012年西藏色林错流域极端气温事件变化趋势
[J].
Extreme air temperature changes in Selin Co basin,Tibet(1961—2012)
[J].
Hydrochemistry differences and causes of tectonic lakes and glacial lakes in Tibetan Plateau
[J].
DOI:10.3390/w12113165
URL
[本文引用: 1]
The Tibetan Plateau has the largest lake cluster in China and in the world. In order to clarify the differences of lake hydrochemistry of Tibetan Plateau, water samples were collected from 32 lakes, including 22 tectonic lakes and 11 glacial lakes, along the Tibetan Plateau road, from September to October 2016. We detected and analyzed the major ion concentrations and characteristics of samples, and discuss the hydrochemistry type, controlling factors, and major ion sources of lake water. The results showed that, firstly, tectonic lake samples on the Tibetan Plateau have much higher physicochemical parameters and ion contents than glacial lakes, and Total Dissolved Solids (TDS) contents fluctuate from high to low latitudes. The variations of ion concentrations in the northern part of the Qiagui Co were more fluctuating and have two obvious peaks, while the variations in the southern part were moderate. The TDS of glacial lakes were low and leveling off in the upper and middle reaches of the basin, while higher and more variable in the lower reaches. Secondly, the tectonic lakes were mainly chloride saline lakes, with Na+ as the major cation, and SO42−, Cl− as the major anions. Glacial lakes were mainly carbonate and sulfate type lakes, Ca2+ and Mg2+ were the major cations, HCO3− was the major anion, and SO42− was the second. Thirdly, the hydrochemistry processes of the tectonic lakes were mainly controlled by evaporation-crystallization, and the ions mainly came from the evaporites of basin. Glacial lake water samples were mainly influenced by the weathering of basin rocks, with ion sources strongly influenced by the weathering of basin carbonates than evaporites, with calcite and dolomite being important sources of Ca2+, Mg2+, and HCO3−.
我国西藏地区冰湖溃决灾害综述
[J].
DOI:10.7522/j.issn.1000-0240.2019.0073
[本文引用: 1]
冰湖溃决是我国西藏地区典型的地质灾害类型之一,具有突发性强、规模大、破坏力强和危害范围广等特点,往往造成下游地区遭受惨重的生命财产损失。冰湖溃决成因特征是形成机制、早期识别和危险性评价等冰湖溃决研究的基础,受客观条件限制,我国西藏冰湖溃决的基础调查工作存在资料分散甚至缺失的局限性。为解决这个难题,通过资料收集、遥感解译和野外调查等技术手段,重新梳理了我国西藏地区的冰湖溃决事件及基本特征,共调查出33个冰湖37次溃决事件,其中2个为冰川阻塞湖(简称冰川湖),划定了冰湖溃决高发地带的地理分布位置,分析出冰崩/冰滑坡、埋藏冰融化、冰川融水、强降水、泥石流和上游冰湖溃决洪水6种诱发原因,为我国西藏冰湖溃决研究提供基础调查成果和参考依据。
An overview of glacial lake outburst flood in Tibet,China
[J].
西藏冰湖溃决灾害事件极端气候特征
[J].
The extreme climate background for glacial lakes outburst flood events in Tibet
[J].
Potentially dangerous glacial lakes across the Tibetan Plateau revealed using a large-scale automated assessment approach
[J].
DOI:10.1016/j.scib.2019.03.011
PMID:36659793
Glacial lake outburst floods (GLOFs) are a major concern in the Himalaya and on the Tibetan Plateau (TP), where several disasters occurring over the past century have caused significant loss of life and damage to infrastructure. This study responds directly to the needs of local authorities to provide guidance on the most dangerous glacial lakes across TP where local monitoring and other risk reduction strategies can subsequently be targeted. Specifically, the study aims to establish a first comprehensive prioritisation ranking of lake danger for TP, considering both the likelihood and possible magnitude of any outburst event (hazard), and the exposure of downstream communities. A composite inventory of 1,291 glacial lakes (>0.1 km) was derived from recent remote sensing studies, and a fully automated and object assessment scheme was implemented using customised GIS tools. Based on four core determinates of GLOF hazard (lake size, watershed area, topographic potential for ice/rock avalanching, and dam steepness), the scheme accurately distinguishes the high to very high hazard level of 19 out of 20 lakes that have previously generated GLOFs. Notably, 16% of all glacial lakes threaten human settlements, with a hotspot of GLOF danger identified in the central Himalayan counties of Jilong, Nyalam, and Dingri, where the potential trans-boundary threat to communities located downstream in Nepal is also recognised. The results provide an important and object scientific basis for decision-making, and the methodological approach is ideally suited for replication across other mountainous regions where such first-order studies are lacking.Copyright © 2019 Science China Press. Published by Elsevier B.V. All rights reserved.
Modelling outburst floods from moraine-dammed glacial lakes
[J].
Dynamic changes in lakes in the Hoh Xil region before and after the 2011 outburst of Zonag Lake
[J].DOI:10.1007/s11629-018-5085-0 [本文引用: 1]
近40年西藏色林错流域湖泊面积变化及影响因素分析
[J].
Lake area variation of Selin Tso in 1975—2016 and its influential factors
[J].
近20 a色林错湖冰物候变化特征及其影响因素
[J].
Lake ice phenology variations and influencing factors of Selin Co from 2000 to 2020
[J].DOI:10.18307/2022.0127 URL [本文引用: 1]
Simulation of the water storage capacity of Siling co lake on the Tibetan Plateau and its hydrological response to climate change
[J].
DOI:10.3390/w14193175
URL
[本文引用: 1]
Due to their special geographical locations and environments, plateau lakes play a key role in maintaining regional water balance, but lake water storage changes are upsetting this balance. Based on data from lakes on the Tibetan Plateau (TP), this study used the Spatial Processes in Hydrology (SPHY) model to simulate the runoff process in the Siling Co basin from 2000 to 2016 and estimated the changes in water storage of Siling Co and the contribution of each component of runoff into the lake. The results showed that the water storage capacity of Siling Co has increased by 1.2 billion m3/yr, and the lake area continues to expand; declines in precipitation have significantly reduced baseflow (BF), rainfall runoff (RR), and snow runoff (SR), while temperature increases have raised glacier runoff (GR). The simulated average runoff showed that BF, GF, RR, and SR contribute 24%, 22%, 16%, and 38%, respectively, of the flow into Siling Co. Based on hypothetical climate change scenarios and two Shared Socioeconomic Pathways (SSP1-2.6 and SSP3-7.0) from the MRI-ESM2-0 GCMs, this study estimated that a 10% increase in precipitation could lead to a 28% increase in total runoff, while a 1 °C increase in temperature could lead to a 10% decrease in runoff. The average runoff depth of the basin is expected to increase by 30–39 mm, since the temperature and precipitation may increase significantly from 2020 to 2050. The intensification of glacial melting caused by the increase in temperature continues, posing a greater challenge to many water resources management problems caused by the expansion of lakes.
基于多源卫星测高数据的青海湖水位变化研究
[J].
Water level variation of Qinghai Hu based on multi-source satellite altimetry data
[J].
黄土高原重要水库水位变化的ICESat/GLA14监测
[J].
Water level changes monitoring of important reservoirs in Loess Plateau based on ICESat/GLA14
[J].
Global inland water monitoring from multi-mission altimetry
[J].
Water levels in the Amazon basin derived from the ERS 2 and ENVISAT radar altimetry missions
[J].DOI:10.1016/j.rse.2010.04.020 URL [本文引用: 1]
Synthesis of the ICESat/ICESat-2 and CryoSat-2 observations to reconstruct time series of lake level
[J].DOI:10.1080/17538947.2023.2166134 URL [本文引用: 2]
Validation of CryoSat-2 SAR mode based lake levels
[J].
Performance assessment of ICESat-2 laser altimeter data for water-level measurement over lakes and reservoirs in China
[J].
DOI:10.3390/rs12050770
URL
[本文引用: 1]
Although the Advanced Topographic Laser Altimeter System (ATLAS) onboard the Ice, Cloud, and Land Elevation Satellite-2 (ICESat-2) was primarily designed for glacier and sea-ice measurement, it can also be applied to monitor lake surface height (LSH). However, its performance in monitoring lakes/reservoirs has rarely been assessed. Here, we report an accuracy evaluation of the ICESat-2 laser altimetry data over 30 reservoirs in China using gauge data. To show its characteristics in large-scale lake monitoring, we also applied an advanced radar altimeter SARAL (Satellite for ARgos and ALtika) and the first laser altimeter ICESat (Ice, Cloud and land Elevation Satellite) to investigate all lakes and reservoirs (>10 km2) in China. We found that the ICESat-2 has a greatly improved altimetric capability, and the relative altimetric error was 0.06 m, while the relative altimetric error was 0.25 m for SARAL. Compared with SARAL and ICESat data, ICESat-2 data had the lowest measurement uncertainty (the standard deviation of along-track heights; 0.02 m vs. 0.17 m and 0.07 m), the greatest temporal frequency (3.43 vs. 1.35 and 1.48 times per year), and the second greatest lake coverage (636 vs. 814 and 311 lakes). The precise LSH profiles derived from the ICESat-2 data showed that most lakes (90% of 636 lakes) had a quasi-horizontal LSH profile (measurement uncertainty <0.05 m), and special methods are needed for mountainous lakes or shallow lakes to extract precise LSHs.
Rapid and punctuated late Holocene recession of Siling Co,central Tibet
[J].
青藏高原中部色林错区域古湖滨线地貌特征、空间分布及高原湖泊演化
[C]//
Geomorphic characteristics,spatial distribution of paleoshorelines around the Siling Co area,central Tibetan Plateau,and the lake evolution within the plateau
[C]//
Climate change 2023:Synthesis report,summary for policymakers
[EB/OL].
