

0 引言
21世纪以来,我国城市化、工业化全面快速发展,城市居民人口快速增加。高速的城市化发展产生2方面的影响,一方面引起城市地表覆盖形态发生巨大变化,大量自然地表类型转变为城市建筑覆盖类型,导致城市地区地表反射率、热特性发生显著变化[1-2]; 另一方面城市人口骤增,预计到2050年,66%的世界人口将居住在城市,城市人口的大量聚集导致大量人为热的产生[3]。这些都导致城市局部热环境和小气候发生了不同程度的改变,进而导致地表城市热岛(surface urban heat island,SUHI)效应[4-5]。SUHI对城市的气候和环境有着重要的影响,这些影响降低了城市整体的生态宜居性,损害了城市人口的健康[6-7]。
在全球极端高温事件频发,SUHI效应更容易受到影响的背景下,城市热环境问题引起了科学家、城市规划人员和公众的广泛关注。自SUHI提出以来,相关研究大多集中于SUHI的形成机理和SUHI强度的空间分布特征[8-9]。这些研究大多以“城乡二分法”为基础,能初步表征城乡热环境差异。但随着城市扩张,城市与郊区之间的界限变得模糊,且由于城市局部形态不同,该方法无法有效地分析城市形态及其变化对城市内部微气候的影响,限制了对于城市内部微气候异质性的研究。为克服这些局限性,Stewart等[10]综合城市三维空间信息,提出了局地气候区(local climate zone,LCZ)分类方法,该方法依据城市结构、土地覆盖和人类活动,将城市下垫面分为10种建成景观类型和7种自然景观类型。自LCZ提出以来,受到相关研究人员的广泛关注。Richard等[11]研究表明,LCZ分类在全球范围内能有效适应城市和农村气候特征; Li等[12]和Collins等[13]研究揭示了绿地覆盖率与地表温度(land surface temperature,LST)之间的显著负相关性,强调优化绿地配置的重要性; Migliari等[14]的研究发现,不同LCZ类型对夏季气温的影响差异明显; Žgela等[15]强调了不同地理位置下LCZ对LST的影响,揭示了植被在缓解SUHI中的作用; Baqa等[16]利用SDGSAT-1数据结合Crichton模型进行热暴露风险分析,表明中低层建筑区域为主要的热暴露区域; Bechtel等[17]针对全球50个城市的SUHI进行研究,研究结果表明不同LCZ类型之间的SUHI强度存在显著差异,紧凑型建筑相比于开阔型具有更强的SUHI强度。大量的研究表明LCZ适用于研究城市形态对于SUHI的影响。
城市热环境的观测通常采用定点观测或基于卫星的LST反演,定点观测通常具有较高的时间分辨率和广泛的时间覆盖范围[18]。然而由于观测仪器和站点数量的限制,对城市内部空间变化的分析存在局限。遥感技术反演LST能够较好地解决站点覆盖不足的问题[19],其中Landsat因其较高的空间分辨率被广泛用于城市热环境分析,但其成像时间固定,无法实现日内变化监测; 地球静止卫星可提供每小时观测数据,但其空间分辨率较低[20],无法实现精细化监测。生态系统星载试验热辐射计(Ecosystem Spaceborne Thermal Radiometer Experiment on Space Station,ECOSTRESS)凭借其独特的轨道设计,能够在昼夜不同时间获取LST信息,为LST的高精度时空动态监测及精细化研究提供了重要数据支撑。已有研究利用ECOSTRESS数据,结合增强型植被指数(enhanced vegetation index,EVI)数据,深入探讨其在植物生态学中的作用[21-22]。与此同时,其他学者通过结合社会人口数据开展了人口热暴露日动态风险评估[23
综上,本文利用ECOSTRESS不同昼夜时段的LST数据和LCZ数据,讨论天津市中心城区SUHI效应的日内变化、空间聚类特征,分析不同LCZ类型对于SUHI贡献和梯度效应。
1 研究区概况及数据源
1.1 研究区概况
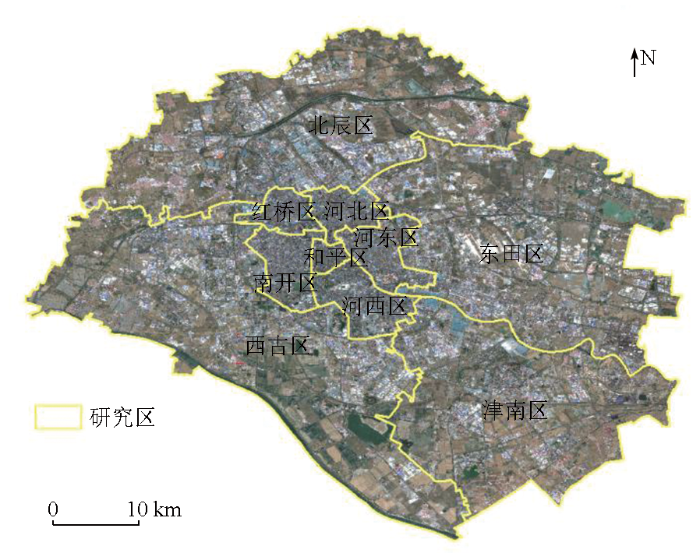
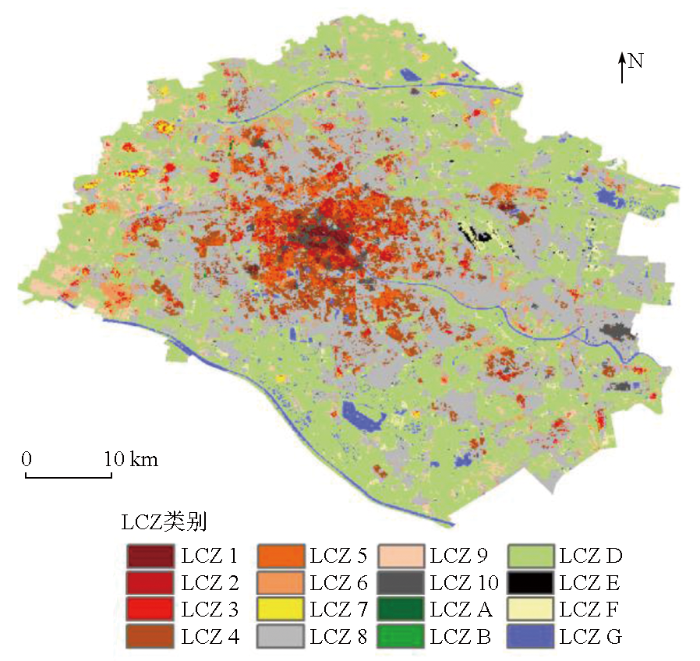
天津市位于华北平原东北部,东临渤海,北依燕山,西靠河北省,地势平坦,属温带季风气候,四季分明,年平均气温为12 ℃左右,平均年降水量为550~700 mm。作为直辖市之一,天津市是我国重要的工业城市和港口城市,常住人口为1 373.2万人(截至2022年)。近年来,随着人口和经济的快速增长,天津市城市建设用地面积不断扩张,城市内部形态发生显著变化,SUHI效应也日益显现。本文的研究区域为天津市中心10个城区,如图1所示。作为天津市的核心区域,建设用地密集,人口聚集,自然景观如植被和水体面积较少。
图1
1.2 数据源及其预处理
1.2.1 局地气候区数据
本文采用的LCZ数据是由Demuzere等[32]制作的全球局地气候区分类图。空间分辨率为100 m。该数据通过标记大量训练区域和地球观测图像,并将它们输入到一个轻量级随机森林模型中生成,总体分类精度为79.5%,满足后续研究的需要。为保证与ECOSTRESS数据的空间一致性,同时考虑到LCZ的空间连续性,采用最近邻插值法将其重采样至70 m。
1.2.2 LST数据
LST数据选择ECOSTRESS的大气校正LST和发射率产品(ECOL2STE),空间分辨率为70 m,重访周期为3~5 d,可昼夜成像。该产品采用基于物理和温度的发射率分离算法,从5个热红外波段中反演得到的LST和发射率。算法理论基础文件中提供的模拟和验证结果显示,ECOSTRESS LST 产品在所有地表类型的1 K级别上具有一致的精度[33],该产品在所有全球验证站点的均方根误差(root mean square error,RMSE)为1.07 K,平均绝对误差(mean absolute error,MAE)为0.40 K,相关系数(R2)>0.988[34]。LST验证数据选择在欧洲中期预报中心发布的第五代全球气候再分析资料集(the fifth generation of European Centre for Medium-Range Weather Forecasts atmospheric reanalysis data,ERA5)的基础上,进一步修正的ERA5陆面数据(ERA5—LAND),该数据集空间分辨率为9 km,具有逐小时的地表LST数据,能够较好地反映LST的时间变化。为更好地反映城市热环境特征,ECOSTRESS影像选取时间为夏季(5月1日—10月1日),影像具体成像时间见表1, ERA5-LAND选择2022年5月1日当日温度数据。
表1 ECOSTRESS数据获取时间
Tab.1
| 北京 时刻 | 北京日期 | ECOSTRESS 影像时刻 (UTC) | ECOSTRESS 影像日期 (UTC) | 昼夜 |
|---|---|---|---|---|
| 00:54 | 2022年05月22日 | 16:54 | 2022年05月21日 | 夜间 |
| 04:11 | 2020年07月15日 | 20:11 | 2020年07月14日 | 夜间 |
| 08:00 | 2023年06月15日 | 00:00 | 2023年06月15日 | 日间 |
| 09:30 | 2019年09月02日 | 01:30 | 2019年09月02日 | 日间 |
| 10:14 | 2022年08月10日 | 02:14 | 2022年08月10日 | 日间 |
| 18:19 | 2023年07月19日 | 10:19 | 2023年07月19日 | 日间 |
| 21:43 | 2022年05月29日 | 13:43 | 2022年05月29日 | 夜间 |
2 研究方法
2.1 局地气候区定义
表2 局地气候区定义
Tab.2
| 建成景观 | 描述 | 自然景观 | 描述 |
|---|---|---|---|
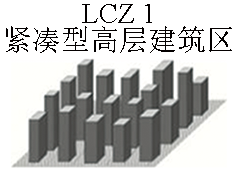 | 高密度的高层建筑(>10层),少或无绿地。 | 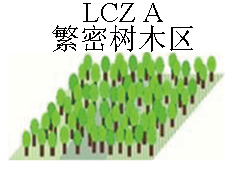 | 高密度树木,土地覆盖多为低矮植物。 |
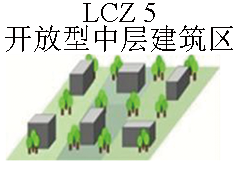
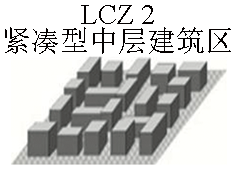 | 高密度的中层建筑(3~9层),少或无绿地。 | 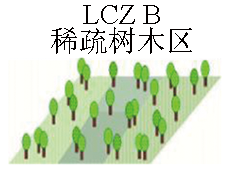 | 低密度林地,地表覆盖多为低矮植被。 |
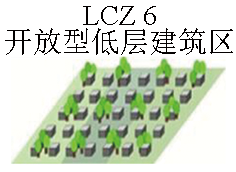
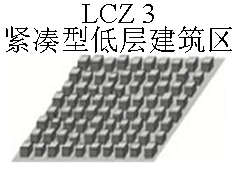 | 高密度的低层建筑(1~3层),少或无绿地。 | 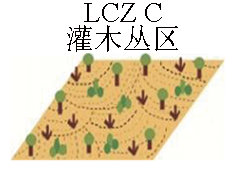 | 灌木和矮小树木开放排列。土地覆盖多为裸露土壤或沙子。 |
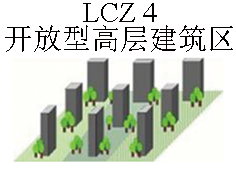 | 低密度的高层建筑(>10层),丰富的树木和植被。 |  | 草或草本植物、农作物的无特征景观,很少或没有树木。 |
 | 低密度的中层建筑(3~9层),丰富的树木和植被。 | 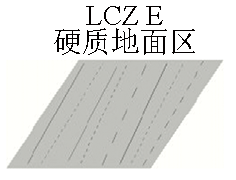 | 岩石或铺砌覆盖物的无特色景观。很少或没有植被。 |
 | 低密度的低层建筑(1~3层),丰富的树木和植被。 |  | 土壤或沙子覆盖的无特征景观。很少或没有树木或植物。 |
 | 高密度单层建筑(1~2层),少树木,地表覆盖多为硬土。 | 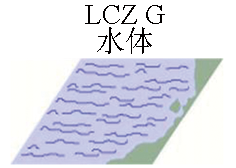 | 大型、开放的水体区域,如海洋、湖泊、河流、水库等。 |
 | 低密度的大型低层建筑(1~3层),几乎没有树木,地表覆盖多为硬化地面。 | ||
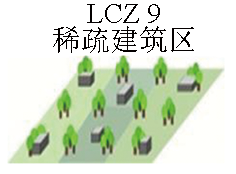 | 低密度的中小型建筑,丰富的植被。 | ||
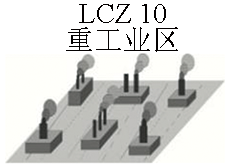 | 中低层重工业建筑(塔、罐、烟囱),少树木,地表覆盖多为硬化地面。 |
图2
2.2 SUHI强度计算
式中: SUHIx为像元x的SUHI强度; LSTx为像元x的LST;
表3 SUHI等级划分标准
Tab.3
| 等级 | 划分标准 | 等级 | 划分标准 |
|---|---|---|---|
| 强冷岛 | SUHI<-5 | 弱热岛 | |
| 较强冷岛 | 较强热岛 | ||
| 弱冷岛 | 强热岛 | ||
| 中温区 |
2.3 基于LCZ的热岛强度贡献
不同时刻各LCZ类型对于SUHI的贡献存在差异,为更好地刻画比较不同时刻、不同LCZ类型对于SUHI的贡献,采用热差异指数[40](thermal difference index,TDI)衡量不同时刻各LCZ类型对于城市热岛的贡献,其公式如下:
式中:
2.4 空间自相关分析
式中: I为莫兰指数;
2.5 梯度分析
为进一步探讨城市化程度对于SUHI分布的影响[44],以天津市中心(天津西站)为原点,每2 km为间隔划分多环缓冲区,总距离为20 km。统计昼夜影像中主要建成景观LCZ类型在各缓冲区内平均SUHI,结合全局I,分析昼夜建成景观SUHI的梯度差异。
3 结果与分析
3.1 地表热岛时空分布
3.1.1 地表热岛的空间分布
图3和表4分别展示了天津市中心城区在不同时刻观测影像中各等级SUHI的空间分布及占比。整体来看,天津市中心城区的SUHI以中温区为主,不同等级的SUHI分布表现出显著的时空差异。日间随着太阳辐射强度的增加,LST显著上升,弱热岛和中温区逐渐演变为较强热岛和强热岛,SUHI强度逐步增强,并在10:14达到观测峰值2.17,强热岛占比为19.14%。此时,建成景观为主要热岛,北部和南部的植被区域为主要冷岛,呈现出东西高、南北低的空间分布格局。夜间,随着太阳辐射的逐渐减弱,LST降低,强热岛逐渐转变为中温区和弱冷岛,SUHI持续减弱,并在4:11达到观测谷值0.29,弱冷岛占比为21.82%。此时,建筑密集区为主要热岛,水体为零散热岛,低矮植被为主要冷岛。
图3
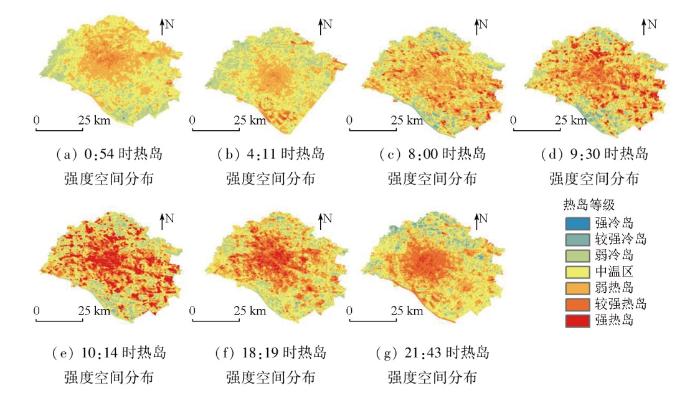
图3
不同时刻热岛强度空间分布
Fig.3
Spatial distribution of urban heat island intensity at different times
表4 不同时刻各等级热岛占比
Tab.4
| 时间 | 强冷岛 | 较强 冷岛 | 弱冷岛 | 中温区 | 弱热岛 | 较强 热岛 | 强热岛 |
|---|---|---|---|---|---|---|---|
| 0:54 | 0.06 | 0.47 | 16.20 | 44.76 | 35.37 | 3.10 | 0.04 |
| 4:11 | 0.01 | 0.47 | 21.82 | 45.60 | 27.86 | 4.17 | 0.08 |
| 8:00 | 0.01 | 2.37 | 13.76 | 32.50 | 38.20 | 10.70 | 2.46 |
| 9:30 | 0.01 | 2.66 | 14.42 | 28.78 | 30.76 | 16.52 | 6.85 |
| 10:14 | 0.00 | 0.67 | 16.87 | 26.48 | 22.03 | 14.79 | 19.14 |
| 18:19 | 0.01 | 0.86 | 13.42 | 32.26 | 26.95 | 20.60 | 5.90 |
| 21:43 | 0.29 | 3.44 | 14.50 | 34.31 | 28.79 | 17.61 | 1.06 |
分析天津市中心城区的SUHI占比可以发现,中温区、弱热岛和弱冷岛占据了较大比例,表明研究区的LST变化主要表现为广泛的升温和降温,整体SUHI效应较为普遍但强度相对较低。然而,部分时刻仍然表现出显著的极端SUHI现象。例如,在10:14时,强热岛的占比达19.14%,主要分布在LCZ 1—6,LCZ 8及LCZ 10等区域。这些区域由于绿地覆盖率较低、散热效率较差,LST显著高于其他地区。针对这些高温热点区域,亟须采取针对性的SUHI缓解措施,降低其对城市环境的负面影响。
3.1.2 SUHI的时间分布
为进一步探讨日尺度内SUHI的动态变化,采用三次样条插值方法对不同时段的SUHI进行预测,生成完整的日周期变化曲线。利用ERA5—LAND逐小时温度数据进行验证(图4),插值得到的SUHI变化趋势与ERA5—LAND逐小时温度数据的变化趋势高度一致,二者的Spearman R2为0.94,表现出较强的相关性。这表明三次样条插值能够有效捕捉SUHI的日动态变化特征。夜间,由于太阳辐射减弱,地表逐渐释放白天积累的热量,LST持续下降,SUHI也随之减弱,并于凌晨3:00达到日周期的预测谷值0.14。此时,SUHI效应主要集中在密集建筑区和水体。白天,随着太阳辐射的逐渐增强,SUHI逐步升高,并在9:00至12:00之间迅速上升,于13:00达到预测峰值3.56。此时,SUHI效应尤为显著,集中于建成景观。
图4
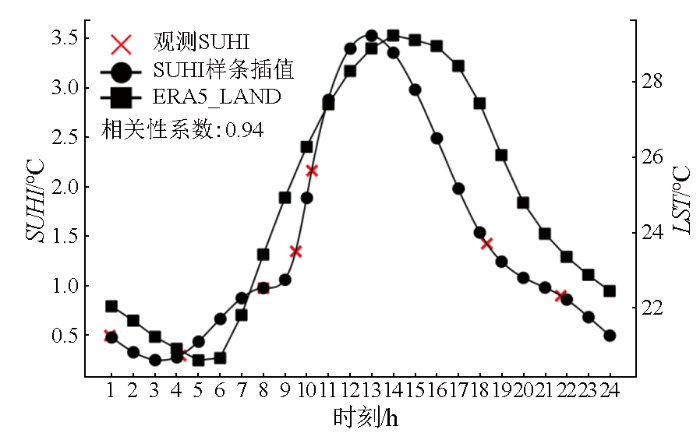
图4
ERA5-LAND温度变化与日内SUHI温度插值比较
Fig.4
The comparison of ERA5-LAND temperature variation and diurnal SUHI temperature interpolation
3.2 不同LCZ类型热岛强度贡献的类间差异及时间变化
3.2.1 类间差异
图5显示在04:11和10:14时刻,以及整个日尺度下各LCZ对SUHI的贡献程度。日尺度上,不同LCZ类型之间存在较大的差异。在建成景观中,除LCZ 7和LCZ 9以外,其余类型TDI均大于1,对整个城市具有升温作用,其中紧凑型中高层建筑(LCZ 1和2)的TDI分别为2.10和2.13,是主要的热源。在自然景观中,除LCZ B和LCZ E外,自然景观TDI均小于1,对整个城市具有降温作用,其中LCZ A和LCZ G的TDI为0.89和0.85,是主要的冷源,对城市的降温作用最为显著。在10:14,建成景观总体TDI大于1,表现为热源。不同建筑密度和高度也会对SUHI的空间分布产生影响,在相同建筑高度下,紧凑型建筑(LCZ 1—3)的TDI大于开放型建筑(LCZ 4—6),较高的建筑密度影响了内部空气流动,形成了热量的积蓄[45]; 在相同建筑密度下,中层建筑(LCZ 2和5)的TDI大于高层建筑(LCZ 1和4),这是由于当建筑高度达到一定阈值时形成阴影,能有效遮挡太阳辐射[46]。LCZ 9由于其建筑密度较小,内部植被覆盖较多,其TDI小于1,表现为冷源。对于自然景观,LCZ E表现为热源,其他自然景观都表现为冷源。在04:11,部分LCZ类型发生冷热源的角色转换,对于建成景观,中高层建筑(LCZ 1,2,4,5)以及LCZ 10对于城市的升温作用更加明显,低层建筑(LCZ 3,6,7,8)拥有较大的天空可视角,散热效率较强[47],升温作用减小或变为冷源。对于自然景观,LCZE转变为冷源,其余自然景观类型都从冷源转换为热源,对城市具有升温作用。
图5
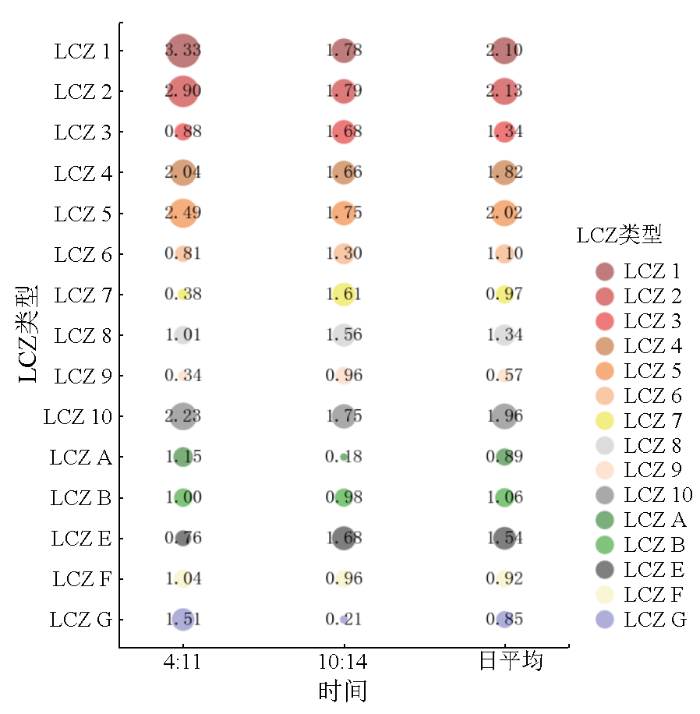
图5
基于LCZ的类间热岛强度贡献
Fig.5
Contribution of inter-class heat island intensity based on LCZ
3.2.2 时间变化
图6为不同时刻各LCZ类型的TDI变化,可以看到各LCZ类型内部在不同时刻对城市热岛的贡献存在显著差异,且昼夜之间的变化尤为明显。中高层建筑(LCZ 1,2,4,5)TDI大于1,对于整个城市具有较为明显的升温作用,为热源。其中紧凑型建筑(LCZ 1和2)在04:11时达到日尺度TDI峰值。这是由于日间建筑物吸收大量太阳辐射,内部大量积热,夜间较高的建筑密度阻碍了内部空气流动,导致散热缓慢。相较之下,开放型中高层建筑(LCZ 3和4)在较早的时刻0:54达到TDI峰值,相比于紧凑型建筑,开放型建筑之间拥有较大的开放空间,空气流动较为自由,热量在夜间能够相对较快的散发[45]。紧凑型、开放型、轻质低层建筑类型(LCZ 3,6,7)因其较大的天空可视角[47],日间快速升温,TDI大于1,为热源; 夜间快速降温,TDI小于1,为冷源。大型低层建筑(LCZ 8)和重工业区(LCZ 10)在不同时刻的TDI值均高于1,始终为热源,这与其内部大量人为热的产生以及低植被覆盖密切相关,导致TDI在所有时间段内都处于较高水平。稀疏建筑(LCZ 9)内部植被覆盖较多,TDI小于1,为冷源。LCZ E的TDI在大多数时刻高于1,表现为热源。LCZ B与LCZ F的TDI接近1,整体对于城市热环境的影响较弱。LCZ A和LCZ G则表现出显著的时空差异。LCZ A夜间TDI大于1,表现为热源,这是由于夜间树木光合作用减弱,蒸腾作用减少,密集的树冠阻挡了地表热量的散发,形成了热量的积蓄。日间TDI小于1,表现为冷源,树木通过蒸腾作用和遮阳降低了SUHI效应,对整个城市进行降温。LCZ G夜间TDI值大于1,由于水比热容高,热量在水中蓄积,夜间成为相对热源。在日间,水体由于其较高的比热容,升温较慢,TDI值小于1,表现为冷源,缓解了SUHI效应。
图6
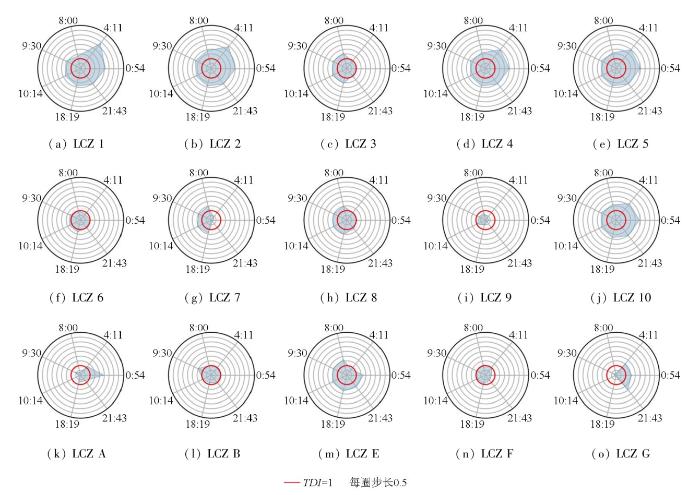
图6
基于LCZ的类内热岛强度贡献
Fig.6
Contribution of intra-class heat island intensity based on LCZ
3.3 LST的空间聚类分析
利用不同时刻的SUHI数据进行莫兰分析,通过全局Ⅰ,可以有效评估研究区昼夜不同时刻SUHI的空间聚集性。本研究通过Z检验与P值对空间自相关结果进行统计推断。Z值表征观测值与理论期望值的标准差偏离度,P值反映随机因素产生该差异的概率。采用双尾检验,当|Z|>2.58(对应α=0.01置信水平)且P<0.01时,拒绝“空间分布无相关性”的零假设,认为空间数据聚集具有统计显著性。此时,全局I值越大,空间聚集性越强。
表5为天津市中心城区温度自相关指数,由表5可知,天津市中心城区不同时刻的SUHI具有显著的空间聚集性,I值均大于0.6,且P均小于0.01。表明研究区SUHI的空间分布受周围区域的热量分布模式影响,存在显著的自相关性,并呈现出较强的空间聚集特征。夜间的I均值为0.84,显著高于日间0.70,表明夜间SUHI的空间聚集效应显著更强。这一差异主要可以归因于夜间与日间的热源差异。日间,由于太阳辐射为城市提供了大量热量,城市LST分布较为均匀,因此空间聚集效应相对较弱。夜间,太阳辐射停止,城市区域的热量主要来自人为热源,尤其是建筑密集区的热释放。这些区域由于建筑物密集,热量积聚和释放的速度较慢,从而导致热量的持续积累和空间上的强烈聚集,进一步增强了SUHI的夜间空间聚集性。
表5 天津市中心城区温度空间自相关指数
Tab.5
| 时刻 | I值 | Z值 | P值 |
|---|---|---|---|
| 00:54 | 0.96 | 464.24 | <0.01 |
| 04:11 | 0.66 | 345.88 | <0.01 |
| 08:00 | 0.73 | 442.06 | <0.01 |
| 09:30 | 0.76 | 583.45 | <0.01 |
| 10:14 | 0.69 | 792.32 | <0.01 |
| 18:19 | 0.64 | 458.76 | <0.01 |
| 21:43 | 0.90 | 548.91 | <0.01 |
3.4 热岛强度的梯度分析
为定量描述SUHI与城市化规模的关系,分别求解日间和夜间主要建成景观LCZ类型的SUHI温度的梯度变化,并结合全局I指数,分析昼夜建成景观SUHI温度的梯度差异。由图7可知,SUHI的空间分布存在明显的梯度效应,天津市SUHI强度与中心点距离呈负相关。距离越远,SUHI越低。此外,昼夜梯度效应存在较大的差异,SUHI逐梯度变化率分别为-0.08和-0.19,日间梯度效应弱于夜间梯度效应,这种昼夜差异的形成机制可以归因于不同时间段热源的作用。日间,太阳辐射为城市提供了强烈的热量输入,使得城市表面温度较为均匀分布,从而减弱了距离梯度对SUHI温度的影响。由于太阳辐射使得热量在城市区域内快速而广泛地扩散,导致中心区域和边缘区域的SUHI温度差异相对较小。然而,夜间的热源主要来自建筑物和人为活动所释放的热量。此时,由于缺乏太阳辐射,城市中心为主要的热量释放区域,导致夜间的SUHI温度梯度更加明显,距离中心区域越远,建筑散热越快,温度逐渐下降,从而形成更强的负梯度效应。
图7
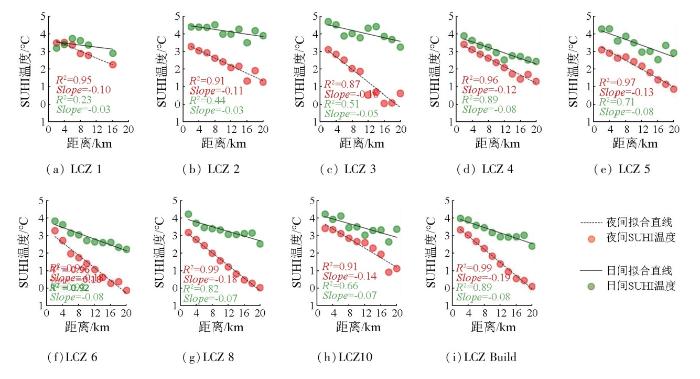
此外,在天津市的城市结构中,城市中心区域主要由中高层密集建筑组成,而外围则以低层开阔建筑为主。这种建筑类型和布局差异在散热效率上产生了显著的影响。相同建筑高度下,梯度效应与建筑密度负相关; 相同建筑密度下,梯度效应与建筑高度负相关。这与建筑之间的散热效率有关,建筑密度越小,建筑高度越低,散热效率越高,因此中心区域的建筑散热慢,SUHI温度较高,远离中心区域的建筑散热越快,SUHI温度越低,梯度效应越明显。
4 讨论与结论
本研究基于2019—2023年ECOSTRESS数据,结合标准LCZ分类体系,系统分析了天津市中心城区SUHI的时空分异特征及其与城市景观结构的昼夜响应机制。通过融合空间聚类、样条插值与梯度分析方法,探讨了SUHI的日变化规律及其LCZ驱动机制,得到以下结论:
1)天津市SUHI呈现出明显的昼夜差异,日间SUHI温度平均为2.19,夜间SUHI平均温度为0.60。日间SUHI温度快速上升,并于午后13:00达到最大值3.56。夜间SUHI温度于凌晨3:00达到最小值0.14。
2)SUHI效应因不同LCZ类型的地表覆盖、建筑密度和材料差异而表现出显著的LCZ类间差异。LCZ 1—6,8,10,B,E在日尺度上为热源,其中LCZ 1和LCZ 2对于城市热环境的升温作用最大,日均TDI为2.10和2.13; LCZ 7,9,A,F,G表现为冷源,其中LCZ A和LCZ G对于城市热环境的降温作用最大,日均TDI为0.89和0.85。在城市规划时,应逐步增加城市绿地和水体的占比缓解SUHI效应。此外,不同LCZ类型对城市热岛的贡献也存在明显的类内差异,LCZ A和LCZ G日间表现为冷源,夜间表现为热源。LCZ 7在日间表现为热源,夜间表现为冷源。中高层建筑的热贡献强度在夜间进一步增强。这说明即使在同一LCZ类型内部,昼夜的温度变化和热量交换模式都会导致显著的热岛效应差异。
3)天津市的SUHI效应与城市化进程密切相关,SUHI强度与城市化水平呈现显著的空间梯度变化。SUHI与市中心的距离呈负相关,离市中心越远,热岛强度越低。昼夜梯度效应也存在差异,SUHI逐梯度变化斜率分别为-0.08和-0.19。日间梯度效应弱于夜间。夜间SUHI温度的I为0.84,日间SUHI温度的I为0.70,夜间SUHI的空间聚集效应强于日间SUHI。日间SUHI温度I较小,分布较为均匀,距离对SUHI效应的影响相对较小,梯度变化不明显。夜间SUHI分布较为集中,随着距离的增加,梯度效应更加明显。此外,建筑密度和高度也是影响SUHI效应空间梯度的重要因素,两者都与梯度效应负相关。
相较于传统热红外数据,ECOSTRESS的昼夜观测能力有效捕捉了午后热岛峰值与凌晨热岛谷值的关键时间,为优化城市热环境提供了参考。在城市规划中,避免城市中心区过度密集的中高层建筑,减少SUHI的空间聚集。在考虑昼夜SUHI差异的前提下,合理增加低层建筑、绿地、水体等LCZ类型的比例,提升散热效率,缓解SUHI效应。但本文研究仍存在一定局限性,数据获取来源于不同日期,尽管已选取晴朗无云时刻的影像,但仍可能存在一定的不确定性与数据误差。在进行日尺度的SUHI样条插值时,由于上午不同时刻影像相距较长时间,下午ECOSTRESS数据较少,插值结果可能存在较大的差异。未来可进一步结合辅助数据进行处理; 同时本研究仅考虑天津市中心城区夏季热岛,季节尺度上的日内变化是下一步研究的重点。
参考文献
Remotely sensing the cooling effects of city scale efforts to reduce urban heat island
[J].
Remote sensing of impervious surfaces in the urban areas:Requirements,methods,and trends
[J].
Global change and the ecology of cities
[J].
DOI:10.1126/science.1150195
PMID:18258902
[本文引用: 1]

Urban areas are hot spots that drive environmental change at multiple scales. Material demands of production and human consumption alter land use and cover, biodiversity, and hydrosystems locally to regionally, and urban waste discharge affects local to global biogeochemical cycles and climate. For urbanites, however, global environmental changes are swamped by dramatic changes in the local environment. Urban ecology integrates natural and social sciences to study these radically altered local environments and their regional and global effects. Cities themselves present both the problems and solutions to sustainability challenges of an increasingly urbanized world.
Urban heat islands in Hong Kong:Statistical modeling and trend detection
[J].
Estimation of land surface temperature-vegetation abundance relationship for urban heat island studies
[J].DOI:10.1016/j.rse.2003.11.005 URL [本文引用: 1]
Long-term and fine-scale satellite monitoring of the urban heat island effect by the fusion of multi-temporal and multi-sensor remote sensed data:A 26-year case study of the city of Wuhan in China
[J].
城市空间形态对城市热岛效应的多尺度影响研究进展
[J].
DOI:10.13249/j.cnki.sgs.2021.10.015
[本文引用: 1]
随着全球城市化的快速发展和气候变暖及极端高温事件的加剧,城市热岛效应已成为了21世纪影响人类生存发展的重要环境问题。因此,阐明城市热岛强度时空变化特征,揭示多空间尺度下的形成机制是人文地理学和气候学研究的热点和前沿交叉科学问题。从街道峡谷微观尺度、城市街区局部尺度和城市宏观尺度全面总结和系统梳理了城市空间形态对城市热岛效应的多尺度影响和耦合机制,提出了未来通过定量表征城市热岛强度、城市空间形态的空间格局、时间演化特征及规律,构建空间关系分析模型,进而揭示城市空间形态在不同时空尺度对城市热岛强度的作用机制,为城市规划、宜居城市建设以及气候变化的响应与适应研究提供理论指导。
Effects of urban spatial morphology on urban heat island effect from multi-spatial scales perspectives
[J].
DOI:10.13249/j.cnki.sgs.2021.10.015
[本文引用: 1]
With the rapid development of global urbanization, the further increased global warming and extreme high temperature events, urban heat island effect has also become an important environmental problem affecting human survival and development in the 21st century. Therefore, it is a hot and frontier cross-scientific issue in the study of human geography and climatology to clarify the spatio-temporal variations of urban heat island intensity and reveal the driving mechanism at multi-spatial scales. Urban geometry is regarded as a key factor affecting urban-rural and intra-urban air temperature variations, and the urban form manipulation provides an opportunity to mitigate the adverse effects on urban climate. Therefore, it is critical to understand the relationship between urban form and the UHI effect to guide future planning practice. This paper systematically reviews and summarizes the multi-scale affecting and coupling mechanism of urban spatial morphology on urban heat island intensity from three different spatial scale perspectives including street canyons microscale, urban block local scale, and urban macroscale. Based on the understanding of the spatial distribution and temporal evolution characteristics of urban spatial morphology on urban heat island intensity, we will characterize the specific effects of urban spatial morphology on urban heat island intensity and construct the spatial relationship analysis model to reveal the affecting mechanism of urban spatial morphology on urban heat island intensity at different temporal and spatial scales. Our knowledge and insights will provide theoretical guidance for urban planning, livable city construction and climate change response and adaptation study.
A review on the generation,determination and mitigation of Urban Heat Island
[J].
DOI:10.1016/s1001-0742(08)60019-4
PMID:18572534
[本文引用: 1]
Urban Heat Island (UHI) is considered as one of the major problems in the 21st century posed to human beings as a result of urbanization and industrialization of human civilization. The large amount of heat generated from urban structures, as they consume and re-radiate solar radiations, and from the anthropogenic heat sources are the main causes of UHI. The two heat sources increase the temperatures of an urban area as compared to its surroundings, which is known as Urban Heat Island Intensity (UHII). The problem is even worse in cities or metropolises with large population and extensive economic activities. The estimated three billion people living in the urban areas in the world are directly exposed to the problem, which will be increased significantly in the near future. Due to the severity of the problem, vast research effort has been dedicated and a wide range of literature is available for the subject. The literature available in this area includes the latest research approaches, concepts, methodologies, latest investigation tools and mitigation measures. This study was carried out to review and summarize this research area through an investigation of the most important feature of UHI. It was concluded that the heat re-radiated by the urban structures plays the most important role which should be investigated in details to study urban heating especially the UHI. It was also concluded that the future research should be focused on design and planning parameters for reducing the effects of urban heat island and ultimately living in a better environment.
Local climate zones for urban temperature studies
[J].
DOI:10.1175/BAMS-D-11-00019.1
URL
[本文引用: 3]
The effect of urban development on local thermal climate is widely documented in scientific literature. Observations of urban–rural air temperature differences—or urban heat islands (UHIs)—have been reported for cities and regions worldwide, often with local field sites that are extremely diverse in their physical and climatological characteristics. These sites are usually described only as “urban” or “rural,” leaving much uncertainty about the actual exposure and land cover of the sites. To address the inadequacies of urban–rural description, the “local climate zone” (LCZ) classification system has been developed. The LCZ system comprises 17 zone types at the local scale (102 to 104 m). Each type is unique in its combination of surface structure, cover, and human activity. Classification of sites into appropriate LCZs requires basic metadata and surface characterization. The zone definitions provide a standard framework for reporting and comparing field sites and their temperature observations. The LCZ system is designed primarily for urban heat island researchers, but it has derivative uses for city planners, landscape ecologists, and global climate change investigators.
How relevant are local climate zones and urban climate zones for urban climate research? Dijon (France) as a case study
[J].
Relationship between land surface temperature and spatial pattern of greenspace:What are the effects of spatial resolution?
[J].
Urban landscape change analysis using local climate zones and object-based classification in the salt lake metro region,Utah,USA
[J].
DOI:10.3390/rs11131615
URL
[本文引用: 1]
Urban areas globally are vulnerable to warming climate trends exacerbated by their growing populations and heat island effects. The Local Climate Zone (LCZ) typology has become a popular framework for characterizing urban microclimates in different regions using various classification methods, including a widely adopted pixel-based protocol by the World Urban Database and Access Portal Tools (WUDAPT) Project. However, few studies to date have explored the potential of object-based image analysis (OBIA) to facilitate classification of LCZs given their inherent complexity, and few studies have further used the LCZ framework to analyze land cover changes in urban areas over time. This study classified LCZs in the Salt Lake Metro Region, Utah, USA for 1993 and 2017 using a supervised object-based analysis of Landsat satellite imagery and assessed their change during this time frame. The overall accuracy, measured for the most recent classification period (2017), was equal to 64% across 12 LCZs, with most of the error resulting from similarities among highly developed LCZs and non-developed classes with sparse or low-stature vegetation. The observed 1993–2017 changes in LCZs indicated a regional tendency towards primarily suburban, open low-rise development, and large low-rise and paved classes. However, despite the potential for local cooling with landscape transitions likely to increase vegetation cover and irrigation compared to pre-development conditions, summer averages of Landsat-derived top-of-atmosphere brightness temperatures showed a pronounced warming between 1992–1994 and 2016–2018 across the study region, with a 0.1–2.9 °C increase among individual LCZs. Our results indicate that future applications of LCZs towards urban change analyses should develop a stronger understanding of LCZ microclimate sensitivity to changes in size and configuration of urban neighborhoods and regions. Furthermore, while OBIA is promising for capturing the heterogeneous and multi-scale nature of LCZs, its applications could be strengthened by adopting more generalizable approaches for LCZ-relevant segmentation and validation, and by incorporating active remote sensing data to account for the 3D complexity of urban areas.
A cross-analysis matrix comparing multi-site Local Climate Zone trends:Application to identify sustainable built morphologies improving summer daytime urban microclimate
[J].
Linking land surface temperature and local climate zones in nine Croatian cities
[J].
Investigating heat-related health risks related to local climate zones using SDGSAT-1 high-resolution thermal infrared imagery in an arid megacity
[J].
SUHI analysis using local climate zones—A comparison of 50 cities
[J].
Assessing the thermal behavior of different local climate zones in the Nanjing metropolis,China
[J].
Thermal infrared remote sensing for urban climate and environmental studies:Methods,applications,and trends
[J].DOI:10.1016/j.isprsjprs.2009.03.007 URL [本文引用: 1]
Exploring diurnal cycles of surface urban heat island intensity in Boston with land surface temperature data derived from GOES-R geostationary satellites
[J].
ECOSTRESS estimates gross primary production with fine spatial resolution for different times of day from the International Space Station
[J].
Emerging satellite observations for diurnal cycling of ecosystem processes
[J].
DOI:10.1038/s41477-021-00952-8
PMID:34211130
[本文引用: 1]
Diurnal cycling of plant carbon uptake and water use, and their responses to water and heat stresses, provide direct insight into assessing ecosystem productivity, agricultural production and management practices, carbon and water cycles, and feedbacks to the climate. Temperature, light, atmospheric water demand, soil moisture and leaf water potential vary over the course of the day, leading to diurnal variations in stomatal conductance, photosynthesis and transpiration. Earth observations from polar-orbiting satellites are incapable of studying these diurnal variations. Here, we review the emerging satellite observations that have the potential for studying how plant functioning and ecosystem processes vary over the course of the diurnal cycle. The recently launched ECOsystem Spaceborne Thermal Radiometer Experiment on Space Station (ECOSTRESS) and Orbiting Carbon Observatory-3 (OCO-3) provide land surface temperature, evapotranspiration (ET), gross primary production (GPP) and solar-induced chlorophyll fluorescence data at different times of day. New generation operational geostationary satellites such as Himawari-8 and the GOES-R series can provide continuous, high-frequency data of land surface temperature, solar radiation, GPP and ET. Future satellite missions such as GeoCarb, TEMPO and Sentinel-4 are also planned to have diurnal sampling capability of solar-induced chlorophyll fluorescence. We explore the unprecedented opportunities for characterizing and understanding how GPP, ET and water use efficiency vary over the course of the day in response to temperature and water stresses, and management practices. We also envision that these emerging observations will revolutionize studies of plant functioning and ecosystem processes in the context of climate change and that these observations and findings can inform agricultural and forest management and lead to improvements in Earth system models and climate projections.
New ECOSTRESS and MODIS land surface temperature data reveal fine-scale heat vulnerability in cities:A case study for Los Angeles County,California
[J].
DOI:10.3390/rs11182136
URL
[本文引用: 1]
Rapid 21st century urbanization combined with anthropogenic climate warming are significantly increasing heat-related health threats in cities worldwide. In Los Angeles (LA), increasing trends in extreme heat are expected to intensify and exacerbate the urban heat island effect, leading to greater health risks for vulnerable populations. Partnerships between city policymakers and scientists are becoming more important as the need to provide data-driven recommendations for sustainability and mitigation efforts becomes critical. Here we present a model to produce heat vulnerability index (HVI) maps driven by surface temperature data from National Aeronautics and Space Administration’s (NASA) new Ecosystem Spaceborne Thermal Radiometer Experiment on Space Station (ECOSTRESS) thermal infrared sensor. ECOSTRESS was launched in June 2018 with the capability to image fine-scale urban temperatures at a 70 m resolution throughout different times of the day and night. The HVI model further includes information on socio-demographic data, green vegetation abundance, and historical heatwave temperatures from the Moderate Resolution Imaging Spectroradiometer (MODIS) sensor onboard the Aqua spacecraft since 2002. During a period of high heat in July 2018, we identified the five most vulnerable communities at a sub-city block scale in the LA region. The persistence of high HVI throughout the day and night in these areas indicates a clear and urgent need for implementing cooling technologies and green infrastructure to curb future warming.
Diurnal dynamics of heat exposure in Xi’an:A perspective from local climate zone
[J].
基于ECOSTRESS地表温度和手机信令数据的城市人口热环境暴露风险评价——以西安市为例
[J].
DOI:10.18306/dlkxjz.2022.11.006
[本文引用: 1]
全球气候变暖和城市热岛效应的双重影响使人类社会面临的极端高温风险日益加剧,给城市人口健康和社会经济可持续发展带来严峻挑战,科学评估城市热环境下人口暴露风险已成为当前学术界关注的热点领域。论文基于ECOSTRESS地表温度数据和手机信令数据,以西安市为例,在城市地表温度和人口时空变化分析基础上,构建城市人口暴露风险评价模型,揭示精细化时空尺度上的人口暴露风险时空格局及其动态演变特征。结果表明:① 西安市夏季一天内的地表温度呈现出明显的波动特征,昼夜地表温度差异较大,白天平均温度为35.5 ℃,夜间平均温度为21.5 ℃,白天地表温度空间分布相比夜间具有更明显的空间异质性,且日内所有时刻均存在不同强度的城市热岛效应,热岛分布的变化表现出从聚集状态向离散状态再过渡至聚集状态的特征。② 西安市人口分布呈单中心结构,73.6%的人口都分布在三环以内,且沿中轴线集中的现象显著,昼夜人口形成了“白天向心、夜间离心”的分布特征。③ 人口暴露的中、高与极高风险区主要呈散点式分布在城市中心区域,且86.6%的极高风险区位于三环以内,而无风险和低风险区主要集中连片分布在城市外围。④ 导致昼夜人口暴露风险差异的不同主导类型面积占比依次为温度主导型(37.9%)>共同主导型(31.5%)>人口主导型(30.6%)。研究可为城市人口暴露风险区域的识别及制定针对性的适应性策略提供参考。
Population exposure risk to urban extreme heat environment based on ECOSTRESS land surface temperature and mobile phone signaling data:A case study of Xi’an City
[J].
Diurnal evolution of urban tree temperature at a city scale
[J].
DOI:10.1038/s41598-021-89972-0
PMID:34006981
[本文引用: 1]
Despite the importance of urban trees' surface temperature in assessing micro-climate interactions between trees and the surrounding environment, their diurnal evolution has been largely understudied at a city-wide scale due to a lack of effective thermal observations. By downscaling ECOSTRESS land surface temperature imaginary over New York City, we provide the first diurnal analysis of city-scale canopy temperature. Research reveals a remarkable spatial variation of the canopy temperature during daytime up to 5.6 K (standard deviation, STD), while the nighttime STD remains low at 1.7 K. Further, our analysis shows that the greenspace coverage and distance to bluespaces play an important role in cooling the local canopy during daytime, explaining 25.0-41.1% of daytime spatial variation of canopy temperatures while surrounding buildings modulate canopy temperature asymmetrically diurnally: reduced daytime warming and reduced nocturnal cooling. Built on space-borne observations and a flexible yet robust statistical method, our research design can be easily transferable to explore urban trees' response to local climate across cities, highlighting the potentials of advancing the science and technologies for urban forest management.
Exploring diurnal thermal variations in urban local climate zones with ECOSTRESS land surface temperature data
[J].
Exploring the diurnal variations of the driving factors affecting block-based LST in a “Furnace city” using ECOSTRESS thermal imaging
[J].
Exploring the impact of urban features on the spatial variation of land surface temperature within the diurnal cycle
[J].
基于ECOSTRESS的城市热环境昼夜空间特征分析
[J].
DOI:10.13474/j.cnki.11-2246.2024.0626
[本文引用: 1]
地表温度是表征城市热环境变化的重要指标,其分布信息对监测城市热环境具有重要意义。本文首先基于2018—2023年6—8月ECOSTRESS数据,通过地表温度修正得到沈阳市四环内的昼夜地表温度;然后利用均值-标准差法和空间自相关分析法对地表温度昼夜空间特征进行提取;最后结合土地利用数据,分析不同地类对地表温度空间分布的贡献度。结果表明,沈阳市四环内地表温度呈北高南低、西高东低的形式,日间和夜间地表温度差异较大。高温区主要集中在皇姑区、大东区、沈河区西部和铁西区东部,低温区和次中温区主要集中在四环边缘;人工地表类别的地表温度大多高于自然地表类别的地表温度,建筑用地类别高温区占比最多,这是地表升温的主要因素,自然地表类别是降温的主要因素;沈阳市四环内的地表温度呈空间正相关,夜间地表温度聚集程度高于日间,且具有显著性的冷热点,地表温度昼夜变化与地表温度聚集性分布特征一致。
Spatial characteristics analysis of urban thermal diurnal environment based on ECOSTRESS
[J].
DOI:10.13474/j.cnki.11-2246.2024.0626
[本文引用: 1]
Land surface temperature (LST) is an important index to characterize the change of urban thermal environment, and its distribution information is of great significance for monitoring urban thermal environment. Based on ECOSTRESS data from June to August from 2018 to 2023, diurnal LST in the fourth ring road of Shenyang is obtained through the correction of LST. Mean-standard deviation method and spatial autocorrelation analysis are used to extract diurnal spatial characteristics of LST, and combined with land use data, the contribution degree of different land types to the spatial distribution of land surface temperature is analyzed. As indicated by the results, the LST in the fourth ring road of Shenyang is high in the north and low in the south, and high in the west and low in the east. There is a large difference in LST between day and night. The high temperature area is mainly concentrated in Huanggu district, Dadong district, western Shenhe district and eastern Tiexi district, while the low temperature area and the middle temperature area are mainly concentrated at the edge of the fourth ring road, the artificial LST is mostly higher than the natural LST, and the high temperature area of building land category accounted for the largest proportion, which is the main factor for the warming of LST, while the natural LST is the main factor for the cooling of LST. There are significant clustering and hot spots in the fourth ring road of Shenyang, and the diurnal variation of LST is consistent with the aggregation distribution characteristics of LST.
A global map of local climate zones to support earth system modelling and urban-scale environmental science
[J].
DOI:10.5194/essd-14-3835-2022
URL
[本文引用: 1]
. There is a scientific consensus on the need for spatially detailed information on urban landscapes at a global scale. These data can support a range of environmental services, since cities are places of intense resource consumption and waste generation and of concentrated infrastructure and human settlement exposed to multiple hazards of natural and anthropogenic origin. In the face of climate change, urban data are also required to explore future urbanization pathways and urban design strategies in order to lock in long-term resilience and sustainability, protecting cities from future decisions that could undermine their adaptability and mitigation role. To serve this purpose, we present a 100 m-resolution global map of local climate zones (LCZs), a universal urban typology that can distinguish urban areas on a holistic basis, accounting for the typical combination of micro-scale land covers and associated physical properties. The global LCZ map, composed of 10 built and 7 natural land cover types, is generated by feeding an unprecedented number of labelled training areas and earth observation images into lightweight random forest models. Its quality is assessed using a bootstrap cross-validation alongside a thematic benchmark for 150 selected functional urban areas using independent global and open-source data on surface cover, surface imperviousness, building height, and anthropogenic heat. As each LCZ type is associated with generic numerical descriptions of key urban canopy parameters that regulate atmospheric responses to urbanization, the availability of this globally consistent and climate-relevant urban description is an important prerequisite for supporting model development and creating evidence-based climate-sensitive urban planning policies. This dataset can be downloaded from https://doi.org/10.5281/zenodo.6364594 (Demuzere et al., 2022a).
ECOsystem Spaceborne Thermal Radiometer Experiment on Space Station (ECOSTRESS) Mission-Level 2 Product User Guide
[J/OL].USGS,2019(
Validation and quality assessment of the ECOSTRESS level-2 land surface temperature and emissivity product
[J].
Urban thermal environment dynamics and associated landscape pattern factors:A case study in the Beijing metropolitan region
[J].
山地新城市化进程的热岛效应时空演变特性研究
[J].
Spatio-temporal characteristics of heat island effect during new urbanization in mountainous areas
[J].
Investigation the robustness of standard classification methods for defining urban heat islands
[J].
基于Moran’s I的多变量空间自相关研究与应用
[J].
Research and application of multivariate spatial autocorrelation based on Moran’s I
[J].
Investigating spatiotemporal patterns of surface urban heat islands in the Hangzhou metropolitan area,China,2000—2015
[J].
DOI:10.3390/rs11131553
URL
[本文引用: 1]
Rapid urbanization has resulted in a serious urban heat island effect in the Hangzhou Metropolitan Area of China during the past decades, negatively impacting the area’s sustainable development. Using Landsat images from 2000 to 2015, this paper analysed the spatial-temporal patterns in a surface urban heat island (SUHI) and investigated its relationship with urbanization. The derived land surface temperature (LST) and surface urban heat island intensity (SUHII) were used to quantify the SUHI effect. Spatial analysis was employed to illustrate the spatial distribution and evolution of a SUHI. The geographically weighted regression (GWR) model was implemented to identify statistically significant factors that influenced the change of SUHII. The results show that hot and very hot spot areas increased from 387 km2 in 2000 to 615 km2 in 2015, and the spatial distribution changed from a monocentric to a polycentric pattern. The results also indicate that high-LST clusters moved towards the east, which was consistent with urban expansion throughout the study period. These changes mirrored the intensive development of three satellite towns. The statistical analysis suggests that both population density (e.g., changes in population density, CPOPD) and green space (e.g., changes in green space fraction, CGSF) strongly affected the changes in SUHII at different stages of the urbanization process. Increasing in population density has a lastingly effect on elevating the SUHII, whereas increasing green space has a constantly significant effect in mitigating the SUHII. These findings suggest that urban planners and policymakers should protect the cultivated lands in suburbs and exurbs, and make efforts to improve the utilization efficiency of construction land by encouraging the migrating population to live within the existing built-up regions.
Spatial distribution and pollution assessment of heavy metals in urban soils from southwest China
[J].To identify the concentrations and sources of heavy metals, and to assess soil environmental quality, 63 soil samples were collected in Yibin City, Sichuan Province, China. Mean concentrations of As, Pb, Zn, and Cu were 10.55, 61.23, 138.88 and 56.35 mg/kg, respectively. As concentrations were comparable to background values, while Pb, Zn, and Cu concentrations were higher than their corresponding background values. Industrial areas exhibited the highest concentrations of As, Pb, Zn, and Cu, while the lowest concentrations occurred in parks. Statistical analysis was performed and two cluster groups of metals were identified with Pb, Zn, and Cu in one group and As in the other. Spatial distribution maps indicated that Pb, Zn, and Cu were mainly controlled by anthropogenic activities, whereas As could be mainly accounted for by soil parent materials. Pollution index values of As, Pb, Zn, and Cu varied in the range of 0.24-1.93, 0.66-7.24, 0.42-4.19, and 0.62-5.25, with mean values of 0.86, 1.98, 1.61, and 1.78, respectively. The integrated pollution index (IPI) values of these metals varied from 0.82 to 3.54, with a mean of 1.6 and more than 90% of soil samples were moderately or highly contaminated with heavy metals. The spatial distribution of IPI showed that newer urban areas displayed relatively lower heavy metal contamination in comparison with older urban areas.
基于多源数据的城市通风廊道构建及效能评估研究——以合肥市主城区为例
[J].
DOI:10.18306/dlkxjz.2024.08.010
[本文引用: 2]
城市通风廊道对于热岛效应、空气污染的缓解以及低碳城市建设具有重要作用。论文以合肥主城区为例,基于气象数据、基础地理信息数据、卫星遥感数据等多源数据测算城市通风指标,根据指标类型和组合设置4种情景评价体系,包括通风潜力系数(VPC)、通风潜力系数+高温(VPC+LST)、通风潜力系数+雾霾(VPC+PM2.5)、通风潜力系数+高温+雾霾(VPC+LST+PM2.5),在此基础上利用最低成本路径模型构建通风廊道,并采取Pearson关联性模型对各情景下通风效能展开评估。结果显示:① 提出新的通风廊道构建范式“基于通风潜力系数(VPC)与气候环境指标(LST/PM2.5/LST+PM2.5)组成的复合指标评价体系构建通风廊道”并验证其具有合理性,其中通风潜力系数由天空开阔度与粗糙度长度确定,气候环境指标的选择以城市面临具体的气候环境问题为依据。② 合肥市主城区夏季与冬季主导风向分别为东南与东北风向;天空开阔度与粗糙度长度指标高值区分别分布在二环线外围与二环线内老城区;地表温度指标高值区分布在经开区与包河区;PM2.5浓度指标高值区分布在老城区、包河区、新站区与瑶海区。③ 研究构建范式下的通风廊道能够产生较高效能。其中,基于“VPC+LST+PM2.5”构建范式下的通风廊道中风速等级与地表温度、PM2.5浓度的相关系数分别为-0.75、-0.85,其绝对值高于传统基于建筑形态指标构建的通风廊道的相关系数-0.68、-0.82的绝对值。④ 合肥市主城区可划分为“1+7”的两级通风廊道管控体系,在一级和二级通风廊道管控区可采取差异化的管控方式。研究旨在从建成环境层面为城市气候适应性的提高提供策略指引。
Construction and efficiency assessment of urban ventilation corridors based on multi-source data:A case study of the main urban area of Hefei City
[J].
Strong contributions of local background climate to urban heat islands
[J].DOI:10.1038/nature13462 [本文引用: 1]
Investigating the effects of 3D urban morphology on the surface urban heat island effect in urban functional zones by using high-resolution remote sensing data:A case study of Wuhan,Central China
[J].
