Please wait a minute...
 
国土资源遥感  2019, Vol. 31 Issue (3): 43-50    DOI: 10.6046/gtzyyg.2019.03.06
  技术方法 本期目录 | 过刊浏览 | 高级检索 |
基于Logistic回归分析的塑料大棚遥感指数构建
陈俊1, 沈润平1(), 李博伦1, 遆超普2, 颜晓元2, 周旻悦1, 王绍武1
1. 南京信息工程大学地理科学学院,南京 210044
2. 中国科学院南京土壤研究所土壤与农业可持续发展国家重点实验室,南京 210008
The development of plastic greenhouse index based on Logistic regression analysis
Jun CHEN1, Runping SHEN1(), Bolun LI1, Chaopu TI2, Xiaoyuan YAN2, Minyue ZHOU1, Shaowu WANG1
1. School of Geographical Sciences, Nanjing University of Information Science and Technology, Nanjing 210044,China
2. State Key Laboratory of Sustainable Soil and Agriculture, Nanjing Institute of Soil Science, Chinese Academy of Sciences, Nanjing 210008, China
全文: PDF(5641 KB)   HTML  
输出: BibTeX | EndNote (RIS)      
摘要 

为了准确提取较大范围的塑料大棚分布信息,以地处太湖流域的常州市为例,利用Landsat8影像,基于塑料大棚光谱特征分析和可分离性分析,选取Landsat8影像7个OLI多光谱波段、1个TIR热红外波段以及归一化植被指数、归一化裸土指数、改进的归一化水体指数等3个常用遥感指数,运用Logistic回归分析法,构建新塑料大棚指数(new plastic greenhouse index, NewPGI)。精度验证结果表明,在样本区域,基于高空间分辨率影像制作的塑料大棚参考图,NewPGI的总体分类精度为94.9%,Kappa系数为0.74; 在整个常州市,基于Google Earth影像选取的验证样本点,NewPGI的总体分类精度为91.28%,Kappa系数为0.78; 且相比于现有塑料大棚指数,NewPGI在复杂地表覆盖情况下塑料大棚的提取效果更好。

服务
把本文推荐给朋友
加入引用管理器
E-mail Alert
RSS
作者相关文章
陈俊
沈润平
李博伦
遆超普
颜晓元
周旻悦
王绍武
关键词 塑料大棚遥感指数Logistic回归分析    
Abstract

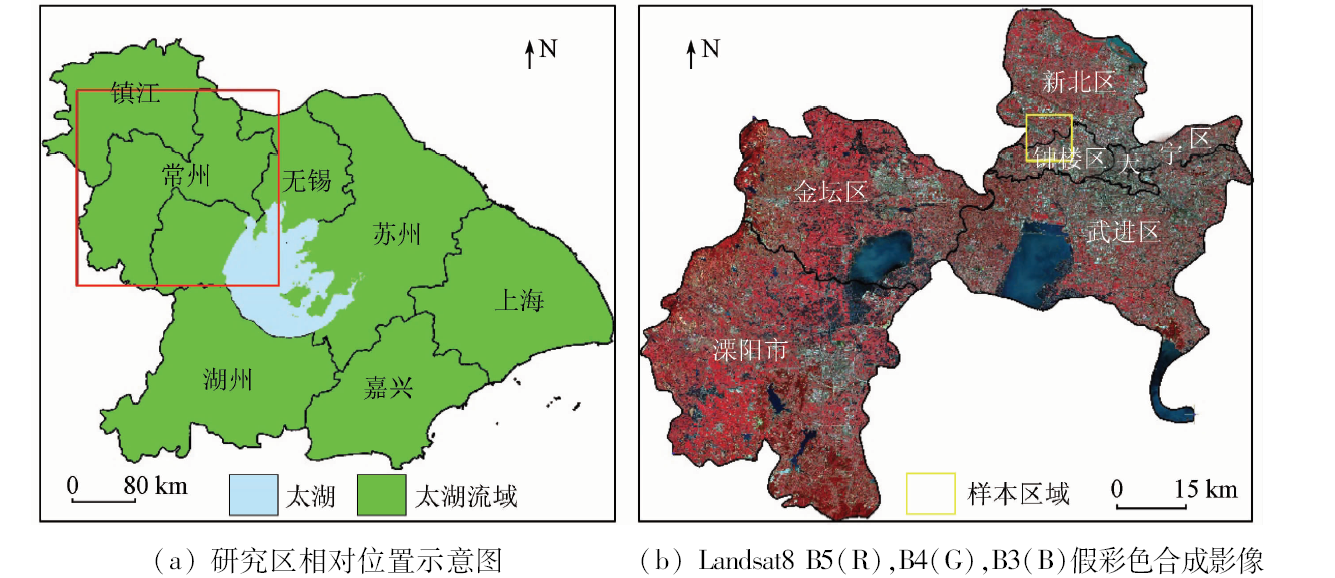
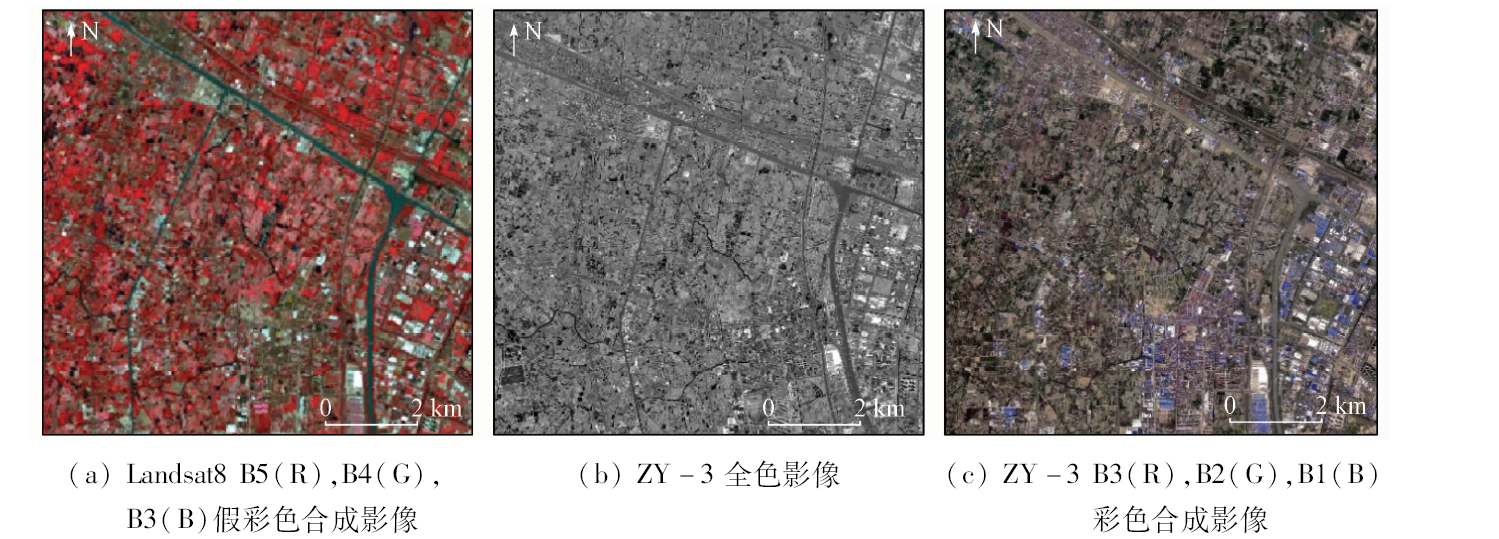
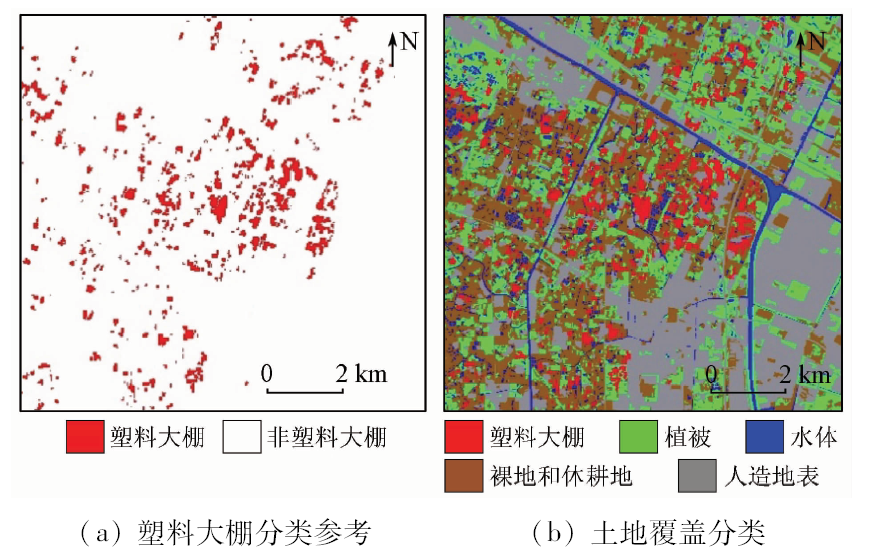
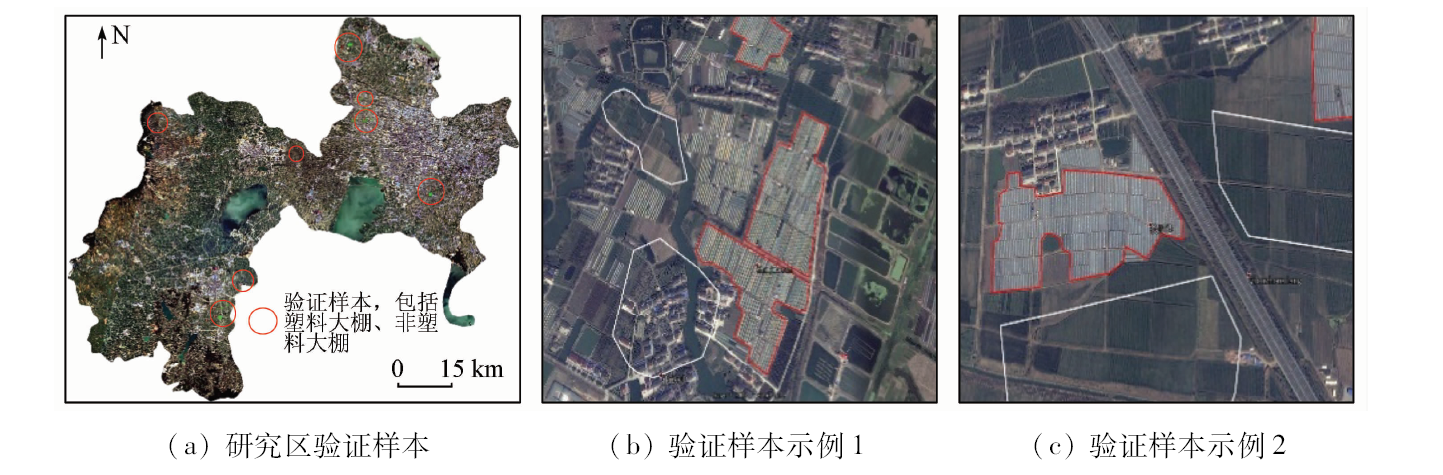
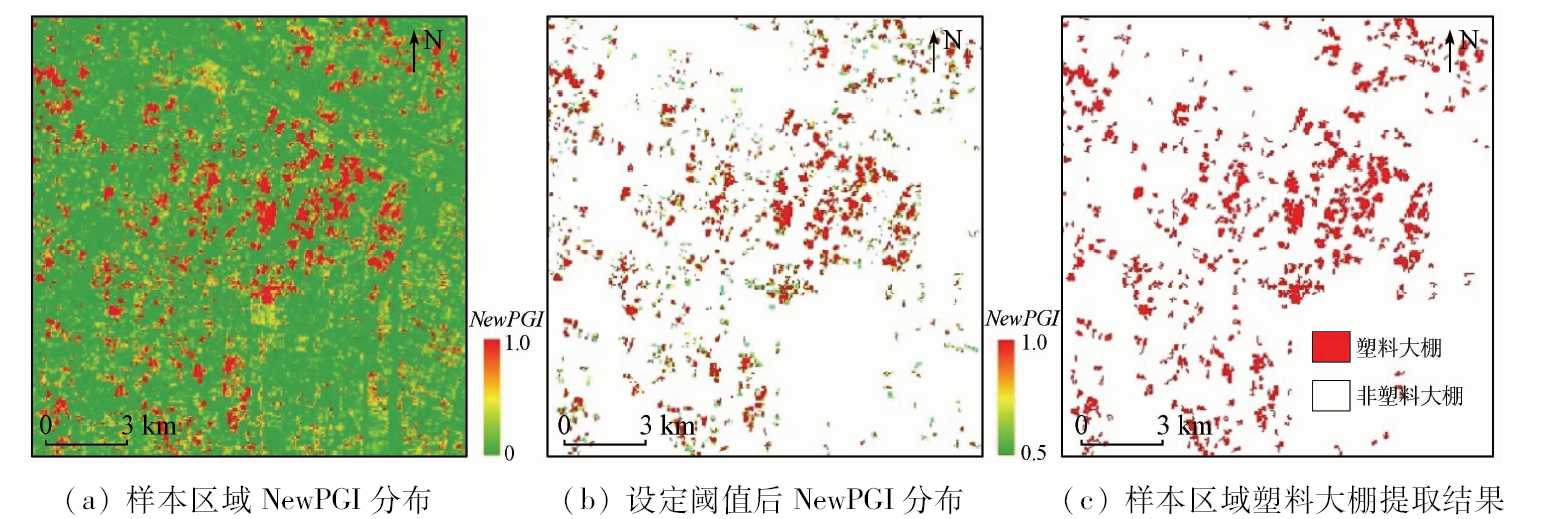
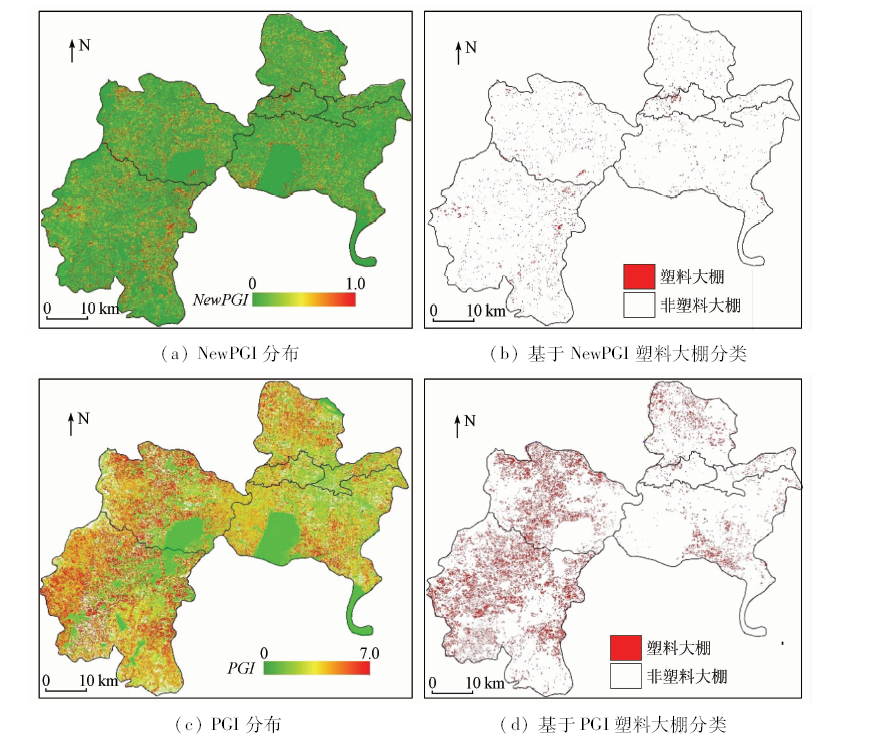
In order to accurately extract a large range of plastic greenhouse distribution information, the authors took Changzhou City, which is located in the Taihu Lake basin, as the study area, used Landsat8 imagery, employed plastic greenhouses spectral analysis and spectral separability analysis, selected seven multi-spectral data and one thermal infrared datum of Landsat8 image and three remote sensing indexes(NDVI, NDBaI and MNDWI)and, based on Logistic regression analysis, constructed a new plastic greenhouse index (NewPGI). Accuracy verification results show that, in the sample area, the high-resolution image of the plastic greenhouse reference map shows that NewPGI’s overall classification accuracy is 94.9%, and Kappa coefficient is 0.74. Throughout Changzhou, the verification sample points were selected based on the Google Earth image. The overall accuracy of NewPGI is 91.28%, and the Kappa coefficient is 0.78. Compared with the existing plastic greenhouse index, NewPGI can better extract plastic greenhouses under complex surface coverage.

Key wordsplastic greenhouse    remote sensing index    Logistic regression analysis
收稿日期: 2018-07-16      出版日期: 2019-08-30
:  S127TP79  
基金资助:国家自然科学重点基金项目“青藏高原陆面再分析关键技术及数据集”(91437220);中国科学院重点部署项目“农业污染排放、入河调查监测与评估”(KZZD-EW-10-04-2);南京信息工程大学人才启动项目“基于遥感的中国稻田生态系统甲烷排放模拟研究”(2016r036);国家重点研发计划项目“主要农田土壤氨挥发特征与控制原理”共同资助(2017YFD0200101)
通讯作者: 沈润平
作者简介: 陈 俊(1993-),男,硕士研究生,主要从事农业土地资源遥感研究。Email: 20161223327@nuist.edu.cn.。
引用本文:   
陈俊, 沈润平, 李博伦, 遆超普, 颜晓元, 周旻悦, 王绍武. 基于Logistic回归分析的塑料大棚遥感指数构建[J]. 国土资源遥感, 2019, 31(3): 43-50.
Jun CHEN, Runping SHEN, Bolun LI, Chaopu TI, Xiaoyuan YAN, Minyue ZHOU, Shaowu WANG. The development of plastic greenhouse index based on Logistic regression analysis. Remote Sensing for Land & Resources, 2019, 31(3): 43-50.
链接本文:  
https://www.gtzyyg.com/CN/10.6046/gtzyyg.2019.03.06      或      https://www.gtzyyg.com/CN/Y2019/V31/I3/43
Fig.1  研究区位置及遥感影像
Fig.2  样本区域遥感影像数据
Fig.3  样本区域分类参考
Fig.4  研究区验证样本
Landsat8波段信息 研究数据 数据或算法介绍 参考资料
http: //landsat.usgs.gov/
B1: Coastal(深蓝) 海岸带环境监测
B2: Blue (蓝光) 可见光波段,合成模拟真彩色影像用于地物识别等
B3: Green(绿光)
B4: Red(红光)
B5: NIR(近红外) 植被信息提取
B6: SWIR1(短波红外) 植被旱情监测、强火监测和部分矿物信息提取
B7: SWIR2(短波红外)
B10: TIRS1(热红外) 地表温度反演、火灾监测、土壤湿度评价和夜间成像等
遥感指数 NDVI (B5-B4)/(B5+B4) 许剑辉等[10]
NDBI (B6-B5)/(B6+B5) As-syakur等[11]
NDBaI (B6-B10)/(B6+B10)
MNDWI (B3-B7)/(B3+B7) Xu等[12]
Tab.1  基于Landsat8影像的光谱数据及多种遥感指数
Fig.5  不同土地覆盖类型光谱曲线(平均值)
波段及遥
感指数
大棚 / 人
造地表
大棚 / 裸地
和休耕地
大棚 /
植被
大棚 /
水体
B1 0.924 7 1.136 5 2.214 8 1.351 5
B2 0.931 0 1.034 8 2.211 9 1.275 6
B3 1.023 0 0.691 6 1.906 9 1.019 9
B4 0.767 8 0.352 4 2.035 1 1.034 2
B5 1.444 5 0.823 5 0.392 5 1.680 3
B6 0.876 6 0.232 1 0.956 7 2.025 0
B7 0.403 5 0.056 7 1.359 9 1.886 4
B10 0.608 4 0.148 4 0.5071 1.363 5
NDVI 0.482 9 0.191 5 2.042 4 1.045 8
NDBI 0.740 1 0.636 1 0.902 2 0.487 8
NDBaI 0.949 3 0.230 5 0.913 0 1.951 2
MNDWI 0.348 3 0.726 6 1.809 1 1.396 8
Tab.2  塑料大棚与典型土地覆盖类型可分离性指标M
Fig.6  Sigmoid函数图像
Xk ak Sig. Xk ak Sig.
B1 76.943 0.019 B7 -43.667 0.024
B2 -91.195 0.012 B10 155.886 0
B3 -146.302 0 NDVI 32.461 0.001
B4 60.4 0.04 NDBaI 138.95 0
B5 -34.773 0.011 MNDWI 83.31 0
B6 -63.933 0.018 常量 24.98 0.089
Tab.3  NewPGI中的参数
X2 波段数 Sig. Cox&Snell Nagelkerke
247.03 11 0.000 0.414 0.697
Tab.4  Logistic回归模型系数的综合检验及拟合度检验
Fig.7  样本区域塑料大棚信息提取
分类 非塑料大棚 塑料大棚 总计 用户精度/%
非塑料大棚 38 795 1 348 40 143 96.64
塑料大棚 947 3 910 4 857 80.50
总计 39 742 5 258 45 000
制图精度/% 97.62 74.36
总体精度 94.9% Kappa系数 0.74
Tab.5  样本区域塑料大棚/非塑料大棚混淆矩阵
Fig.8  常州市塑料大棚信息提取
遥感指数 非塑料大棚 塑料大棚 总计 用户精度/%
NewPGI 非塑料大棚 1 657 123 1 780 93.09
塑料大棚 92 594 686 86.59
总计 1 749 717 2 466
制图精度/% 94.74 82.85
总体精度 91.28% Kappa系数 0.78
PGI 非塑料大棚 1 603 318 1 921 73.21
塑料大棚 146 399 545 83.45
总计 1 749 717 2 466
制图精度/% 91.65 55.65
总体精度 81.18% Kappa系数 0.51
Tab.6  研究区域塑料大棚/非塑料大棚混淆矩阵
[1] 国家统计局国务院第三次全国农业普查领导小组. 第三次全国农业普查主要数据公报[R]. 北京:国家统计局, 2017.
The Third National Agricultural Census Leading Group of the State Council, the National Bureau of Statistics. The Main Data Bulletin of the Third National Agricultural Census[R]. Beijing:National Bureau of Statistics, 2017.
[2] Navulur K. Multispectral Image Analysis Using the Object-Oriented Paradigm[M]. Boca Raton: CRC Press, 2006.
[3] Agüera F, Aguilar M A, Aguilar F J , et al. Detecting greenhouse changes from QuickBird imagery on the Mediterranean coast[J]. International Journal of Remote Sensing, 2006,27(21):4751-4767.
[4] Aguilar M A, Bianconi F, Aguilar F J , et al. Object-based greenhouse classification from GeoEye-1 and WorldView-2 stereo imagery[J]. International Journal of Remote Sensing, 2014,6(5):3554-3582.
[5] Aguilar M A, Nemmaoui A, Novelli A , et al. Object-based greenhouse mapping using very high resolution satellite data and Landsat-8 time series[J]. International Journal of Remote Sensing, 2016,8(6):513.
[6] Zhao G X, Li J, Li T , et al. Utilizing Landsat TM imagery to map greenhouses in Qingzhou,Shandong Province,China[J]. Pedosphere, 2004,14(3):363-369.
[7] Novelli A, Aguilar M A, Nemmaoui A , et al. Performance evaluation of object based greenhouse detection from Sentinel-2 MSI and Landsat 8 OLI data:A case study from Almería (Spain)[J]. International Journal of Applied Earth Observation and Geoinformation, 2016,52:403-411.
[8] Yang D D, Chen J, Zhou Y , et al. Mapping plastic greenhouse with medium spatial resolution satellite data:Development of a new spectral index[J]. Photogrammetry and Remote Sensing, 2017,128:47-60.
[9] 约翰逊, 威克恩 . 实用多元统计分析[M]. 陆漩译.2版.北京: 清华大学出版社, 2001.
Johnson R A, Wichern D W. Applied Multivariate Statistical Analysis[M].Translated by Lu X. 2nd ed.Beijing: Tsinghua University Press, 2001.
[10] 许剑辉, 赵怡, 肖明虹 , 等. 基于空间自回归模型的广州市NDVI和NDBI与气温关系研究[J]. 国土资源遥感, 2018,30(2):186-194.doi: 10.6046/gtzyyg.2018.02.25.
Xu J H, Zhao Y, Xiao M H , et al. Study on the relationship between NDVI and NDBI and temperature in Guangzhou based on spatial autoregressive model[J]. Remote Sensing for Land and Resources, 2018,30(2):186-194.doi: 10.6046/gtzyyg.2018.02.25.
[11] As-syakur A R, Adnyana I W S, Arthana I W , et al. Enhanced built-up and bareness index (EBBI) for mapping built-up and bare land in an urban area[J]. Remote Sensing, 2012,4(10):2957-2970.
[12] Xu H Q . Modification of normalised difference water index (NDWI) to enhance open water features in remotely sensed imagery[J]. International Journal of Remote Sensing, 2006,27(14):3025-3033.
[13] Kaufman Y J, Remer L . Detection of forests using mid-IR reflectance:An application for aerosol studies[J]. IEEE Transactions on Geoscience and Remote Sensing, 1994,32(3), 672-683.
[14] 方苗, 张金龙, 徐瑱 . 基于GIS和Logistic回归模型的兰州市滑坡灾害敏感性区划研究[J]. 遥感技术与应用, 2011,26(6):845-854.
Fang M, Zhang J L, Xu Z . Landslide susceptibility zoning study in Lanzhou City based on GIS and Logistic regression model[J]. Remote sensing technology and application, 2011,26(6):845-854.
[15] 王济川, 郭志刚 . Logistic回归模型:方法与应用[M]. 北京: 高等教育出版社, 2001.
Wang J C, Guo Z G. Logistic Regression Model:Method and Application[M]. Beijing: Higher Education Press, 2001.
[16] Cox D R . The analysis of binary data[J]. Economica, 1971,150:210-211.
[1] 赵晓晨, 吴皓楠, 李林宜, 孟令奎. 面向汛旱情监测的遥感影像GPU并行处理算法[J]. 自然资源遥感, 2021, 33(3): 107-113.
[2] 谭柳霞, 曾永年, 郑忠. 林火烈度遥感评估指数适应性分析[J]. 国土资源遥感, 2016, 28(2): 84-90.
[3] 张月, 肖彧, 常晶晶, 刘健, 王亚琼, 贺春燕, 何冰. 大气校正对基于遥感指数提取藻华信息的影响[J]. 国土资源遥感, 2015, 27(3): 7-12.
[4] 江振蓝, 沙晋明, 杨武年. 基于GIS的福州市生态环境遥感综合评价模型[J]. 国土资源遥感, 2004, 16(3): 46-48,60.
Viewed
Full text


Abstract

Cited

  Shared   
  Discussed   
京ICP备05055290号-2
版权所有 © 2015 《自然资源遥感》编辑部
地址:北京学院路31号中国国土资源航空物探遥感中心 邮编:100083
电话:010-62060291/62060292 E-mail:zrzyyg@163.com
本系统由北京玛格泰克科技发展有限公司设计开发