The eco-barrier effect of Qinling Mountain on aerosols
MENG Qing1,2(), BAI Hongying1,2(), ZHAO Ting1,2, GUO Shaozhuang1,2, QI Guizeng1,2
1. College of Urban and Environmental Science, Northwest University, Xi’an 710127, China 2. Key Laboratory of Surface System and Environmental carrying Capacity of Shaanxi Province, Northwest University, Xi’an 710127, China
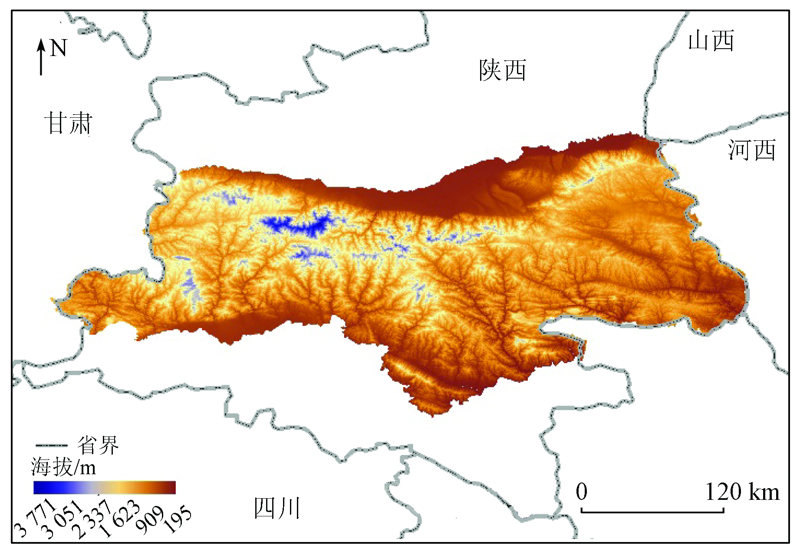
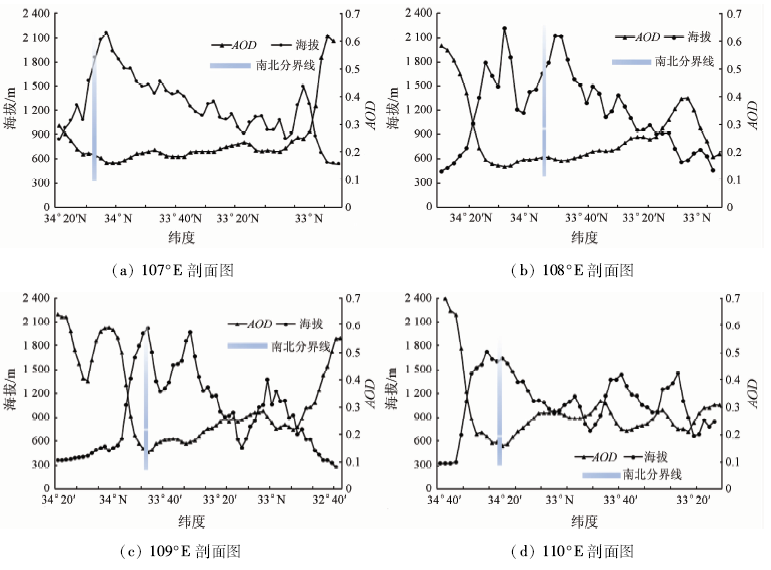
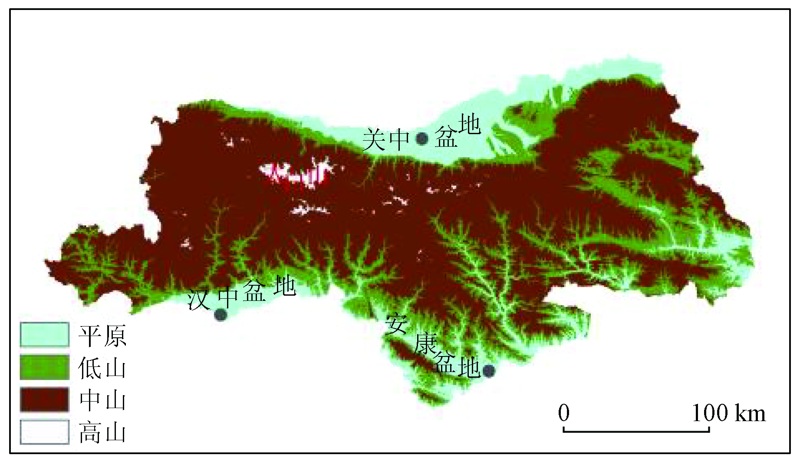
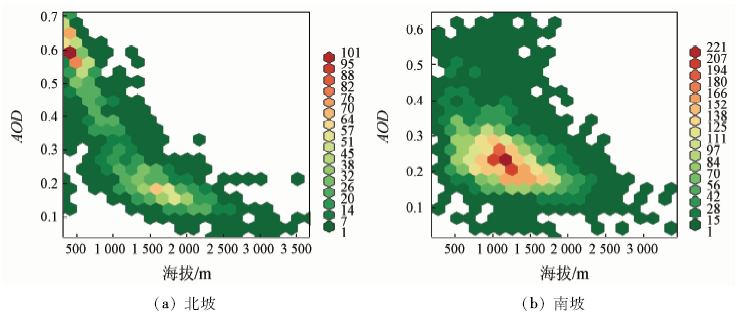
The ecological barrier effect of Qinling Mountain on aerosol optical depth (AOD) and the relationship between aerosol and terrain were studied by spatial analysis and Kernel Density Estimation using AOD retrievals obtained from the Terra-MODIS Collection 6.1 Level-2 aerosol product at 3 km spatial resolution from January 2002 to December 2017. The results showed an obvious effect of the ecological barrier effect of the Qinling Mountain on atmospheric aerosol. An annual average AOD value at the northern foot of the Qinling Mountain was higher than that at the southern foot of the Qinling Mountain in the past 16 years. High-values of AOD were in Guanzhong urban agglomeration at the northern foot of Qinling Mountain. By comparing and analyzing the changes of AOD along different longitudes of Qinling Mountain, obvious differences were observed in AOD between the south and the north of Qinling Mountain in terms of extreme, mean and special values, which showed the characteristics of “north-south differentiation” and further illustrates the obvious barrier effect of Qinling Mountain on AOD. AOD over the Qinling Mountain showed a significant elevation stratification effect, i.e., a logarithmic downward trend with the increase of elevation. Under the elevation of 2 000 m(mutation point), AOD showed a significant accelerated downward trend with a rate of 0.001/1 000 m. Over the elevation of 2 000 m, AOD showed a significant uniform downward trend with a rate close to zero. The results also showed that the distribution of AOD varied greatly in different terrain of the Qinling Mountain. The AOD agglomeration centers in the plain areas were located at 330~420 m above mean sea level (a.s.l.) , where 79% of AOD were concentrated between 0.35 and 0.71, and high-value AOD (AOD =0.7) agglomeration centers were located between 330 and 340 m. The AOD agglomeration centers in the low-mountains areas were located at 900~1 000 m a.s.l., and 79% of AOD were concentrated between 0.15 and 0.32. The AOD agglomeration centers in middle-mountains areas were located at 1 000~1 400 m a.s.l., and about 60% of AOD were concentrated between 0.19 and 0.3. AOD presented a foggy distribution under plain, low-mountain and middle-mountain areas. AOD in high-mountain areas presented a sporadic point distribution without concentration centers. On the northern slope of Qinling Mountain, the elevation distribution of AOD concentration center was 500 m, while that of the southern slope was about 1 100~1 200 m. The AOD concentration center value (AOD=0.6) on the northern slope was higher than that on the southern slope (AOD=0.22). The AOD decreased logarithmically with the elevation of the northern slope of Qinling Mountain, but the decreasing trend of the southern slope was not obvious.
Pan T, Wu S H, He D M, et al. Ecological effects and regional differentiation of land surface pattern in longitudinal range-valley region[J]. Journal of Geography, 2012,67(1):13-26.
Wu S H, Pan T, Cao J, et al. The “channel-blocking” effect of southwestern longitudinal ridge and valley topography on monsoon[J]. Geographic Research, 2012,31(1):1-13.
He Y L, Zhang Y P. Spatial distribution characteristics of air temperature and rainfall under “channel-blocking” effect in longitudinal ridge-valley region[J]. Journal of Mountain Science, 2007(2):169-176.
He Y X, Yi G H, Zhang T B, et al. Changes and driving forces of vegetation EVI in Honghe River basin from 2000 to 2014 under “passage-barrier” effect[J]. Acta Ecologica Sinica, 2018,38(6):2056-2064.
Hao C Y, Dai E F, Wu S D, et al. Study on “blocking” effect and spatial and temporal heterogeneity of vegetation in southern longitudinal range and valley area[J]. Science Bulletin, 2006(s2):120-128.
[6]
Pan T, Wu S H, Dai E F, et al. Indicative significance of sporopollen spatial assemblages in longitudinal ridge and valley area of southwest China to barrier effect[J]. Journal of Geographical Sciences, 2009,19(6):660-670.
Li Y B, Zhang Y Y. Channels for evolution and expansion of construction land pattern in parallel ridge and valley area and barrier effect in low mountains[J]. Geographic Research, 2010,29(3):440-448.
Gao D Y. Preliminary study on the comprehensive effect of mountain barrier and water vapor channel-also on the natural causes of Shangri-La[J]. Plateau Meteorology, 2007(6):1305-1310.
Meng X R. The strong blocking effect of Qinling Mountains caused the failure of snow end forecast[A].China Association of Science and Technology.Harmonious Development of Energy Conservation and Environmental Protection-Proceedings of 2007 China Association of Science and Technology Annual Meeting (2)[C]. China Association of Science and Technology:Academic Department of China Association of Science and Technology, 2007: 4.
Chen Z C, Hao C Y, Liu C H, et al. Spatiotemporal characteristics of hydrothermal factors,land cover and NPP under blocking effect of Funiu Mountain[J]. Journal of Ecological Environment, 2013,22(5):761-766.
Wu S H, Dai E F, He D M. Preliminary study on environment and development in longitudinal range and valley area of southwest China[J]. Progress in Geographical Science, 2005(1):31-40.
He D M, Wu S H, Peng H, et al. Study on ecosystem changes in longitudinal range-valley area and southwest cross-border ecological security[J]. Progress in Geoscience, 2005(3):338-344.
[13]
姜世中. 气象学与气候学[M]. 北京: 科学出版社, 2010: 15.
Jiang S Z. Meteorology and Climatology[M]. Beijing: Science Press, 2010: 15.
[14]
Ofipcc W G I. Climate change 2013:The physical science basis[J]. Contribution of Working, 2013,43(22):866-871.
[15]
Kaiser D P, Qian Y. Decreasing trends in sunshine duration over China for 1954-1998:Indication of increased haze pollution[J]. Geophysical Research Letters, 2002,29(21):38-1-38-4.
[16]
Crutzen P J. The background of an ozone researcher:A brief autobiography[M]// Paul J.Crutzen:A pioneer on atmospheric chemistry and climate change in the Anthropocene.Springer International Publishing 2016.
[17]
Liao H, Adams P J, Chung S H, et al. Interactions between tropospheric chemistry and aerosols in a unified general circulation model[J] Journal of Geophysical Research Atmospheres, 2003, 108(D1):AAC-1-AAC1-23.
pmid: 11542933
[18]
Forster P, Ramaswamy V, Artaxo P, et al. Changes in atmospheric constituents and in radiative forcing[M]// Climate Change 2007:The Physical Science Basis. Contribution of Working Group I to the 4th Assessment Report of the Intergovernmental Panel on Climate Change.DLR, 2007: 129-234.
[19]
Rosenfiled D, Lohmann U, Raga G B, et al. Flood or drought:How do aerosols affect precipitation[J]. Science, 2008,321(5894):1309-1313.
doi: 10.1126/science.1160606
pmid: 18772428
[20]
Li Z Q, Niu F, Fan J W, et al. Long-term impacts of aerosols on vertical development of cloud and precipitation[J]. Nature Geoscience, 2011,4:888-894.
[21]
Tao W K, Chen J P, Li Z Q, et al. Impact of aerosols on convective clouds and precipitation[J]. Reviews of Geophysics, 2012,50(2):1-97.
[22]
汪安璞. 大气气溶胶研究新动向[J]. 环境化学, 1999(1):10-15.
Wang A P. New Trends in atmospheric aerosol research[J]. Environmental Chemistry, 1999(1):10-15.
[23]
Baumer D, Vogel B, Versick S, et al. Relationship of visibility,aerosol optical thickness and aerosol size distribution in an ageing air mass over South-West Germany[J]. Atmospheric Environment, 2008,42(5):989-998.
[24]
Koren I, Martins J V. Measurement of the effect of amazon smoke on inhibition of cloud formation[J]. Science, 2004,303(5662):1342-1345.
pmid: 14988557
[25]
Ramachandan S. Aerosol optical depth and fine mode fraction variations deduced from Moderate Resolution Imaging Spectroradiometer (MODIS) over four urban areas in India[J]. Journal of Geophysical Research Atmospheres, 2007,112(D16).
[26]
Meng F, Cao C, Shao X. Spatio-temporal variability of Suomi-NPP VIIRS-derived aerosol optical depth over China in 2013[J]. Remote Sensing of Environment, 2015,163:61-69.
[27]
He L, Wang L, Lin A, et al. What drives changes in aerosol properties over the Yangtze River Basin in past four decades?[J]. Atmospheric Environment, 2018,190.
Liu Z, Sun X L, Liu D, et al. Temporal and spatial characteristics of aerosol optical thickness in northern provinces of China from 2001 to 2017[J]. Journal of Environmental Science, 2018,38(8):3177-3184.
Wu G X, Li Z Q, Fu S B, et al. Research progress on interaction between aerosol and east asian monsoon[J]. Chinese Science:Geoscience, 2015,45(11):1609-1627.
Zhang L L, Pan J H, Zhang D H. Temporal and spatial distribution characteristics of aerosol optical thickness in China based on MODIS data[J]. Journal of Environmental Science, 2018,38(11):4431-4439.
Yu H Y, Zhang J, Li T, et al. Analysis on temporal and spatial variation characteristics of atmospheric aerosol optical thickness and meteorological influencing factors in Beijing and its surrounding areas from 2000 to 2013[J]. Meteorological Science, 2018,38(4):512-522.
Xu X H, Yu X, Dai J. Effect of aerosol on topographic cloud precipitation in Qinling mountains[J]. Meteorology, 2009,35(1):37-47.
[33]
戴进, 余兴, Daniel Rosenfeld, 等. 秦岭地区气溶胶对地形云降水的抑制作用[J]. 大气科学, 2008(6):1319-1332.
Dai J, Yu X, Daniel R, et al. Inhibitory effect of aerosol on topographic cloud precipitation in Qinling area[J]. Atmospheric Science, 2008(6):1319-1332.
Du C L, Yu X. Analysis of aerosol and urban heat island effect on temperature series in Qinling area in recent 50 years[J]. Plateau Meteorology, 2013,32(5):1321-1328.
[35]
马新萍. 秦岭林线及其对气候变化的响应[D]. 西安:西北大学, 2015.
Ma X P. Qinling forest line and its response to climate change[D]. Xi'an:Northwest University, 2015.
[36]
王耀斌. 秦 岭(陕西段)生态资产时空变化特征及其驱动因素[D]. 西安:长安大学, 2018.
Wang Y B. Spatial-temporal variation characteristics and driving factors of ecological assets in Qinling Mountains (Shaanxi Section)[D]. Xi’an:Chang’an University, 2018.
Meng Q, Bai H Y, Guo S Z. Temporal and spatial changes of precipitation in Qinling Mountains in recent 50 years based on Anusplin[J]. Soil and Water Conservation Research, 2020,27(2):206-212.
Zhao T, Bai H Y, Deng C H, et al. Topographic differentiation effect of vegetation cover change in Qinling Mountains from 2000 to 2016[J]. Acta Ecologica Sinica, 2019,39(12):4499-4509.
Zhou Q, Bian J J, Zheng J Y. Temperature and heat resource changes in north and south Qinling mountains from 1951 to 2009[J]. Journal of Geography, 2011,( 9):1211-1218.
Qi W J, Yang X M. Extraction of vegetation boundary between mountain and plain in duchang county,Jiangxi Province[J]. Journal of Geoscience, 2017,19(4):559-569.
[41]
白红英. 秦巴山区森林植被对环境变化的响应[M]. 北京: 科学出版社, 2014.
Bai H Y. Responses of forest vegetation to environmental changes in Qinba mountain area[M]. Beijing: Science Press, 2014.
[42]
Parzene. On estimation of a probability density function and mode[J]. The Annals of Mathematical Statistics, 1962,33(3):1065-1076.
Luo Y X, Chen J, Zheng X B. Characteristics of MODIS remote sensing aerosol optical thickness in mainland China in recent 10 years[J]. Journal of Ecological Environment, 2012,21(5):876-883.
Wang Y P, Yu X, Xie G Q. Temporal and spatial distribution characteristics of aerosol optical thickness in China in recent 15 years[J]. China Environmental Science, 2018,38(2):426-434.
 2021, Vol. 33
  ), 白红英1,2(