|
|
|
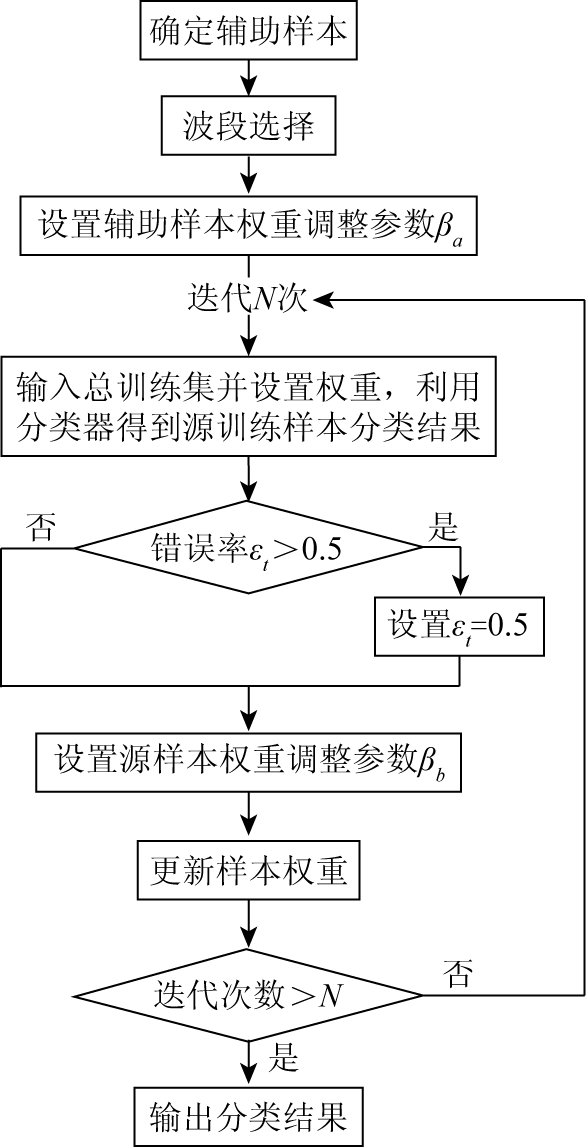
Abstract To tackle the low classification accuracy problem of hyperspectral image classification caused by similar samples under the condition of small-sample-size, this paper proposes a hyperspectral image classification algorithm based on Fisher criterion and TrAdboost (H_TrAdaboost). Firstly, an auxiliary sample is determined with the spectral angle mapping (SAM) method and spectral information divergence (SID) so as to improve the total number of training samples. Secondly, the samples are studied separability based on the improved Fisher criterion to obtain relatively strong samples set. Finally, the weight of positive and negative sample distribution is adjusted dynamically by using TrAdaboost algorithm so as to achieve hyperspectral similarity class classification in the small sample size problem. In the comparative experiments with other compared algorithms, the highest classification accuracy is achieved, which fully shows that H_TrAdaboost algorithm can well solve the similar hyperspectral image classifications.
|
| Keywords
hyperspectral image classification
spectral angle mapping (SAM)
spectral information divergence (SID)
Fisher criterion
|
|
|
|
Corresponding Authors:
Tianhui LI
E-mail: 163250335@qq.com
|
|
Issue Date: 07 December 2018
|
|
|
| [1] |
杜培军, 夏俊士, 薛朝辉 , 等. 高光谱遥感影像分类研究进展[J]. 遥感学报, 2016: 20(2):236-256.
doi: 10.11834/jrs.20165022
url: http://d.wanfangdata.com.cn/Periodical/ygxb201602008
|
| [1] |
Du P J, Xia J S, Xue Z H , et al. Review of hyperspectral remote sensing image classification[J]. Journal of Remote Sensing, 2016,20(2):236-256.
|
| [2] |
Camps-Valls G, Tuia D, Bruzzone L , et al. Advances in hyperspectral image classification:Earth monitoring with statistical learning methods[J]. IEEE Signal Processing Magazine, 2014,31(1):45-54.
doi: 10.1109/MSP.2013.2279179
url: http://ieeexplore.ieee.org/xpls/icp.jsp?arnumber=6678612
|
| [3] |
高恒振 . 高光谱遥感图像分类技术研究[D]. 长沙:国防科学技术大学, 2011.
|
| [3] |
Gao H Z . Research on Classification Techinique for Hyperspectral Remote Sensing Imagery[D]. Changsha:National University of Defence Technology, 2011.
|
| [4] |
谭琨 . 基于支持向量机的高光谱遥感影像分类研究[D]. 徐州:中国矿业大学, 2010.
|
| [4] |
Tan K . Research on Hyperspectral Romote Sensing Image Classification Based on Support Vector Machine[D]. Xuzhou:China University of Mining Technology, 2010.
|
| [5] |
杨凯歌, 冯学智, 肖鹏峰 , 等. 优化子空间SVM集成的高光谱图像分类[J]. 遥感学报, 2016,20(3):409-419.
|
| [5] |
Yang K G, Feng X Z, Xiao P F , et al. Optimal subspace ensemble with SVM for hyperspectral image classification[J]. Journal of Remote Sensing, 2016,20(3):409-419.
|
| [6] |
Persello C, Bruzzone L . Active and semisupervised learning for the classification of remote sensing images[J]. IEEE Transactions on Geoscience and Remote Sensing, 2014,52(11):6937-6956.
doi: 10.1109/TGRS.2014.2305805
url: http://ieeexplore.ieee.org/document/6780607/
|
| [7] |
Pan S J, Yang Q . A survey on transfer learning[J]. IEEE Transactions on Knowledge and Data Engineering, 2010,22(10):1345-1359.
doi: 10.1109/TKDE.2009.191
url: http://ieeexplore.ieee.org/document/5288526/
|
| [8] |
吴田军, 骆剑承, 夏列钢 , 等. 迁移学习支持下的遥感影像对象级分类样本自动选择方法[J]. 测绘学报, 2014,43(9):908-916.
doi: 10.13485/j.cnki.11-2089.2014.0163
|
| [8] |
Wu T J, Luo J C, Xia L G , et al. An automatic sample collection method for object-oriented classification of remotely sensed imageries based on transfer learning[J]. Acta Geodaetica et Cartographica Sinica, 2014,43(9):908-916.
|
| [9] |
Zhou Y, Lian J, Han M . Remote sensing image transfer classification based on weighted extreme learning machine[J]. IEEE Geoscience and Remote Sensing Letters, 2016,13(10):1405-1409.
doi: 10.1109/LGRS.2016.2568263
url: http://ieeexplore.ieee.org/document/7527666/
|
| [10] |
Dai W, Yang Q, Xue G R, et al. Boosting for transfer learning [C]// Proceedings of the 24th International Conference on Machine Learning.Corvallis:ACM, 2007: 193-200.
|
| [11] |
夏冰, 赵勋杰 . 基于光谱信息散度的非监督波段选择[J]. 计算机应用与软件, 2015,32(7):212-215,251.
doi: 10.3969/j.issn.1000-386x.2015.07.051
url: http://d.wanfangdata.com.cn/Periodical/jsjyyyrj201507051
|
| [11] |
Xia B, Zhao X J . An unsupervised band selection algorithm based on spectral information divergence[J]. Computer Applications and Software. 2015,32(7):212-215,251.
|
| [12] |
刘万军, 杨秀红, 曲海成 , 等. 基于光谱信息散度与光谱角匹配的高光谱解混算法[J]. 计算机应用, 2015,35(3):844-848.
doi: 10.11772/j.issn.1001-9081.2015.03.844
|
| [12] |
Liu W J, Yang X H, Qu H C , et al. Hyperspectral unmixing algorithm based on spectral information divergence and spectral angle mapping[J]. Journal of Computer Application, 2015,35(3):844-848.
|
| [13] |
汪浩然, 夏克文, 任苗苗 , 等. 结合PCA及字典学习的高光谱图像自适应去噪方法[J]. 计算机应用, 2016,36(12):3411-3417.
doi: 10.11772/j.issn.1001-9081.2016.12.3411
url: http://www.cqvip.com/QK/94832X/201612/670801971.html
|
| [13] |
Wang H R, Xia K W, Ren M M , et al. Adaptive denoising method of hyperspectral remote sensing based on PCA and dictionary learning[J]. Journal of Computer Application, 2016,36(12):3411-3417.
|
| [14] |
许明明, 张良培, 杜博 , 等. 基于类别可分性的高光谱图像波段选择[J]. 计算机科学, 2015,42(4):274-275,296.
|
| [14] |
Xu M M, Zhang L P, Du B , et al. Supervised band selection based on class separability for hyperspectral image[J]. Computer Science, 2015,42(4):274-275,296.
|
| [15] |
吴东洋, 马丽 . 多流形LE算法在高光谱图像降维和分类上的应用[J]. 国土资源遥感, 2018,30(2):80-86.doi: 10.6046/gtzyyg.2018.02.11.
|
| [15] |
Wu D Y, Ma L . Multi-manifold LE algorithm for dimension reduction and classification of multitemporal hyperspectral image[J]. Remote Sensing for Land and Resources, 2018,30(2):80-86.doi: 10.6046/gtzyyg.2018.02.11.
|
| [16] |
赵波, 苏红军, 蔡悦 . 一种切空间协同表示的高光谱遥感影像分类方法[J]. 武汉大学学报(信息科学版), 2018,43(4):555-562.
|
| [16] |
Zhao B, Su H J, Cai Y . A hyperspectral image classification method based on collaborative representation in tangent space[J]. Geomatics and Information Science of Wuhan University, 2018,43(4):555-562.
|
|
Viewed |
|
|
|
Full text
|
|
|
|
|
Abstract
|
|
|
|
|
Cited |
|
|
|
|
| |
Shared |
|
|
|
|
| |
Discussed |
|
|
|
|
 2018,
Vol. 30
2018,
Vol. 30
 ), Haicheng QU