|
|
 |
|

|
|
|
GDP estimation model of county areas based on NPP/VIIRS satellite nighttime light data |
| Chenyang QU1,2,3, Li ZHANG2,3, Mingquan WANG2,3, Maohua WANG2,3 |
1. School of Microelectronics, University of Chinese Academy of Sciences, Beijing 100049, China
2. Key Laboratory of Low-Coal Conversion Science and Engineering, Chinese Academy of Sciences, Shanghai 201210, China
3. Shanghai Carbon Data Research Center, Shanghai Advanced Research Institute, Chinese Academy of Sciences, Shanghai 201210, China |
|
|
|
|
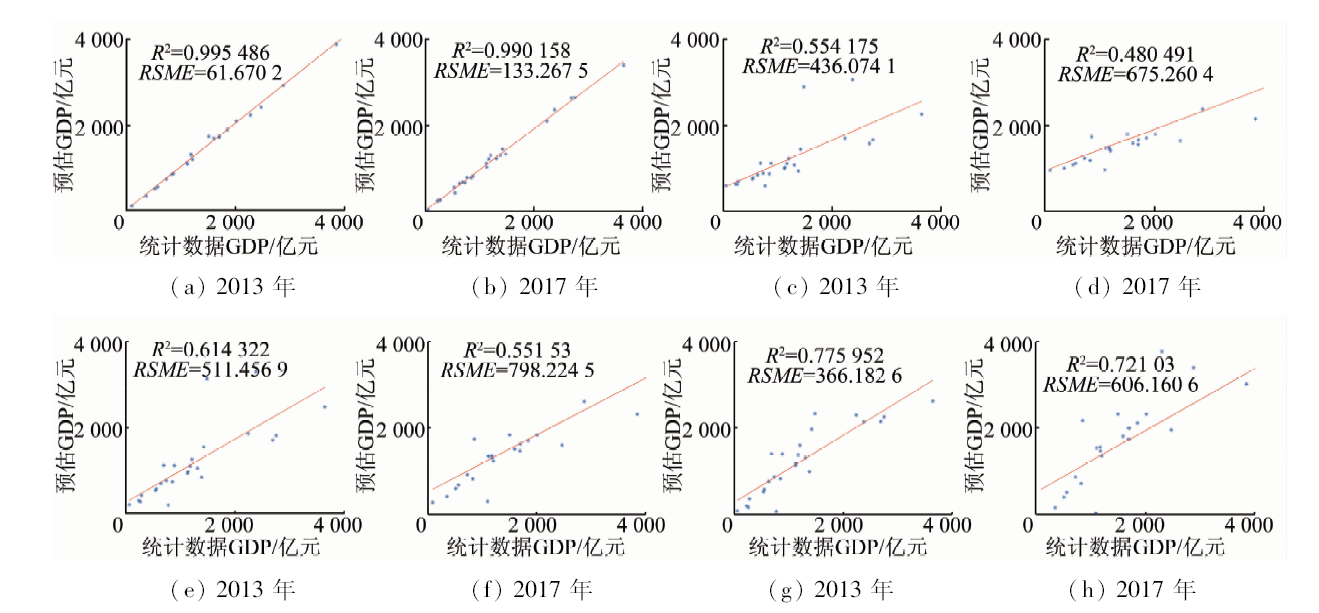
Abstract Based on the NPP/VIIRS nighttime lighting data, the authors constructed a panel regression model to estimate the county GDP of some counties where the new high-speed railway was located in 2013—2018. In this paper, the NPP/VIIRS data was firstly based on the maximum estimation of the correction process, and the night light-GDP panel regression model was established for GDP estimation. The results show that, among the 25 counties, 16 counties have a correlation coefficient R2 of 0.9 or more. The R2 of the six county-level regions is between 0.85 and 0.9, which confirms that the NPP/VIIRS satellite nighttime lighting data changes and the economic growth of the county where the new high-speed railway station is located shows a good and long-term stable positive correlation. At the same time, the authors made a brief analysis of the impact of high-speed rail and county-level economic development, and argued that it is feasible for the panel data model to fit the NPP/VIIRS satellite nighttime lighting data and to estimate the GDP of the counties where the new high-speed railway is located.
|
| Keywords
NPP/VIIRS nighttime light data
new high-speed railway station
county economic estimation
panel data analysis
|
|
|
|
Issue Date: 18 June 2020
|
|
|
| [1] |
方大春, 孙明月. 高速铁路对长三角城市群经济发展影响评估——基于DID模型的实证研究[J]. 华东经济管理, 2016,30(2):42-47.
|
| [1] |
Fang D C, Sun M Y. An evaluation on the impact of high-speed rail on economic development of city clusters in the Yangtze River Delta[J]. East China Economic Management, 2016,30(2):42-47.
|
| [2] |
李新光, 黄安民, 张永起. 高铁对区域经济发展的影响评估——基于DID模型对福建省的实证分析[J].现代城市研究, 2017(4):125-132.
|
| [2] |
Li X G, Huang A M, Zhang Y Q. The impact of high-speed railway on regional economic development:An empirical analysis of Fujian Province based on DID model[J].Modern Urban Research, 2017(4):125-132.
|
| [3] |
江威, 何国金, 刘慧婵. NPP/VIIRS和DMSP/OLS夜光数据模拟社会经济参量对比[J]. 遥感信息, 2016,31(4):28-34.
|
| [3] |
Jiang W, He G J, Liu H C. Modelling regional socio-economic parameters based on comparison of NPP/VIIRS and DMSP/OLS nighttime light imagery[J]. Remote Sensing Information, 2016,31(4):28-34.
|
| [4] |
刘佳, 辛鑫, 刘斌, 等. 基于DMSP/OLS夜间灯光影像的2000—2013年鄂尔多斯市城市扩张遥感制图与驱动因子分析[J]. 国土资源遥感, 2018,30(1):166-172.doi: 10.6046/gtzyyg.2018.01.23.
|
| [4] |
Liu J, Xin X, Liu B, et al. Urban expansion mapping and driving factor analysis of Ordos City during the period of 2000—2013 based on DMSP/OLS nighttime light data[J]. Remote Sensing for Land and Resources, 2018,30(1):166-172.doi: 10.6046/gtzyyg.2018.01.23.
|
| [5] |
周红妹, 高阳, 葛伟强, 等. 城市扩展与热岛空间分布变化关系研究——以上海为例[J].生态环境, 2008(1):163-168.
|
| [5] |
Zhou H M, Gao Y, Ge W Q, et al. The research on the relationship between the urban expansion and the change of the urban heat island distribution in Shanghai Area[J].Ecology and Environment, 2008(1):163-168.
|
| [6] |
金平斌, 徐鹏飞. 基于DMSP/OLS夜间灯光数据的城镇化进程及格局研究——以杭州市为例[J]. 国土资源遥感, 2017,29(4):205-213.doi: 10.6046/gtzyyg.2017.04.31.
|
| [6] |
Jin P F, Xu P F. A study of urbanization progress and spatial pattern using DMSP/OLS nighttime light data:A case study of Hangzhou City[J]. Remote Sensing for Land and Resources, 2017,29(4):205-213.doi: 10.6046/gtzyyg.2017.04.31.
|
| [7] |
舒松, 余柏蒗, 吴健平, 等. 基于夜间灯光数据的城市建成区提取方法评价与应用[J]. 遥感技术与应用, 2011,26(2):169-176.
|
| [7] |
Shu S, Yu B L, Wu J P, et al. Methods for deriving urban built-up area using night-light data:Assessment and application[J]. Remote Sensing Technology and Application, 2011,26(2):169-176.
|
| [8] |
李欣欣, 王利, 何飞. 基于NPP/VIIRS夜间灯光数据和土地利用数据的人口分布图绘制——以大连金普新区为例[J]. 遥感信息, 2018,33(4):35-41.
|
| [8] |
Li X X, Wang L, He F. Population distribution map drawing based on NPP/VIIRS nighttime light remote sensing images and land use data:A case study in Jinpu New Area[J]. Remote Sensing Information, 2018,33(4):35-41.
|
| [9] |
Ghosh T, Anderson S, Rebecca L. et al. Estimation of Mexico’s informal economy and remittances using nighttime imagery[J]. Remote Sensing, 2009,1(3):418-444.
|
| [10] |
Henderson J V, Storeygard A, Weil D N. Measuring economic growth from outer space[J]. American Economic Review, 2012,102(2):994-1028.
|
| [11] |
徐康宁, 陈丰龙, 刘修岩. 中国经济增长的真实性:基于全球夜间灯光数据的检验[J]. 经济研究, 2015,50(9):17-29,57.
|
| [11] |
Xu K N, Chen F L, Liu X Y. The truth of China economic growth:Evidence from global night-time light data[J]. Economic Research Journal, 2015,50(9):17-29,57.
|
| [12] |
徐银凤, 汪德根. 中国城市空间结构的高铁效应研究进展与展望[J]. 地理科学进展, 2018,37(9):1216-1230.
|
| [12] |
Xu Y F, Wang D G. Research progress and prospects of high-speed rail effects on urban spatial structure in China[J]. Progress in Geography, 2018,37(9):1216-1230.
|
| [13] |
Li X, Xu H, Chen X, et al. Potential of NPP-VIIRS nighttime light imagery for modeling the regional economy of China[J]. Remote Sensing, 2013,5(6):3057-3081.
|
| [14] |
Shi K, Yun C, Yu B, et al. Modeling spatiotemporal CO2(carbon dioxide) emission dynamics in China from DMSP-OLS nighttime stable light data using panel data analysis[J]. Applied Energy, 2016,168(2):523-533.
|
| [15] |
潘文卿. 外商投资对中国工业部门的外溢效应:基于面板数据的分析[J]. 世界经济, 2003,26(6):3-7,80.
|
| [15] |
Pan W Q. The spillover effect of foreign investment on China’s industrial sector:Analysis based on panel data[J]. World Economy, 2003,26(6):3-7,80.
|
| [16] |
陈立俊, 王克强. 中国城市化发展与产业结构关系的实证分析[J]. 中国人口·资源与环境, 2010,20(s1):17-20.
|
| [16] |
Chen L J, Wang K Q. Analysis of the relationship between Chinese urbanization and industry structure[J]. China Population,Resources and Environment, 2010,20(s1):17-20.
|
| [17] |
刘金全, 于惠春. 我国固定资产投资和经济增长之间影响关系的实证分析[J]. 统计研究, 2002,19(1):26-29.
|
| [17] |
Liu J Q, Yu H C. An empirical analysis of the relationship between fixed assets investment and economic growth in China[J]. Statistical Research, 2002,19(1):26-29.
|
| [18] |
张俊. 高铁建设与县域经济发展——基于卫星灯光数据的研究[J]. 经济学, 2017,16(4):1533-1562.
|
| [18] |
Zhang J. High-speed rail construction and county economic development:The research of satellite light data[J]. China Economic Quarterly, 2017,16(4):1533-1562.
|
| [19] |
李宗光, 胡德勇, 李吉贺, 等. 基于夜间灯光数据的连片特困区GDP估算及其空间化[J]. 国土资源遥感, 2016,28(2):168-174.doi: 10.6046/gtzyyg.2016.02.26.
|
| [19] |
Li Z G, Hu D Y, Li J H, et al. Simulation and specialization of GDP in poverty areas based on night light imagery[J]. Remote Sensing for Land and Resources, 2016,28(2):168-174.doi: 10.6046/gtzyyg.2016.02.26.
|
| [20] |
刘璐. 基于夜间灯光数据的城市群蔓延指标[J]. 国土资源遥感, 2018,30(2):208-213.doi: 10.6046/gtzyyg.2018.02.28.
|
| [20] |
Liu L. Urban sprawl metrics based on night-time light data for metropolitan areas[J]. Remote Sensing for Land and Resources, 2018,30(2):208-213.doi: 10.6046/gtzyyg.2018.02.28.
|
|
Viewed |
|
|
|
Full text
|
|
|
|
|
Abstract
|
|
|
|
|
Cited |
|
|
|
|
| |
Shared |
|
|
|
|
| |
Discussed |
|
|
|
|
 2020,
Vol. 32
2020,
Vol. 32