|
|
 |
|

|
|
|
Estimation of electric power consumption using nighttime light remote sensing data based on K-Means city classification algorithm |
ZHANG Li1,2( ), XIE Yanan1, QU Chenyang2,3, WANG Mingquan2,3, CHANG Zheng2,3,4, WANG Maohua2,3() ), XIE Yanan1, QU Chenyang2,3, WANG Mingquan2,3, CHANG Zheng2,3,4, WANG Maohua2,3() |
1. Key Laboratory of Specialty Fiber Optics and Optical Access Networks, Joint International Research Laboratory of Specialty Fiber Optics and Advanced Communication, Shanghai Institute of Advanced Communication and Data Science, Shanghai University, Shanghai 201210, China
2. Shanghai Carbon Data Research Center, Shanghai Advanced Research Institute, Chinese Academy of Sciences, Shanghai 201210, China
3. CAS Key Laboratory of Low-Coal Conversion Science and Engineering, Shanghai Advanced Research Institute, Shanghai 201210, China
4. Dalian National Laboratory for Clean Energy, Dalian 116023, China |
|
|
|
|
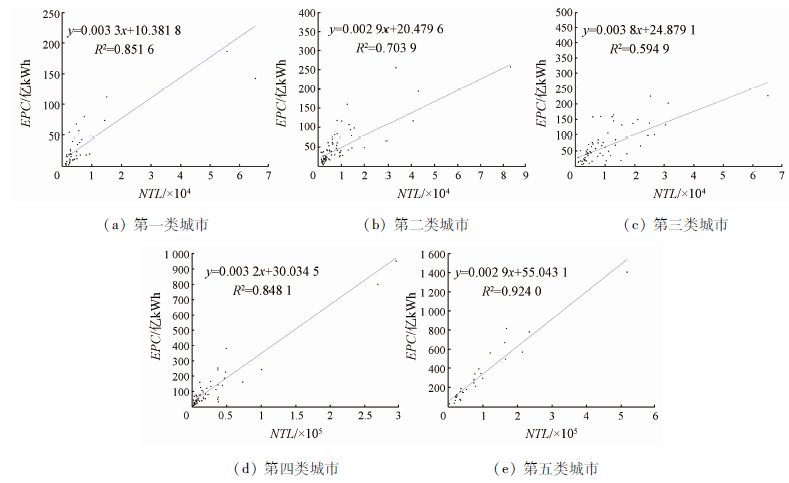
Abstract In order to reduce the error in estimating urban electric power consumption by nighttime light images, it is necessary to consider the development status of sample areas and classify the samples before estimation. In this paper, the NPP-VIIRS nighttime light data from 263 prefecture-level cities in China’s mainland in 2015 were selected to estimate urban electric power consumption. A K-Means city classification method based on light structure rather than traditional statistical data is proposed. The authors used this method to divide the samples into 5 types and estimate the electric power consumption. A comparison of the estimated results with those from other classification methods shows the following regularity: The mean relative error and root mean square error of the estimated results are 32.02% and 57.04, decreasing by 25 and 3.39 percentage points compared with the estimated results without classification respectively. The proportion of high-precision cities in the estimation results is 53.99%, increasing by 13.59 percentage points compared with estimated result without classification, and is the highest proportion among values of all methods. Compared with the estimated results without classification, 152 cities have lower estimated errors. The performance of this method is similar to the optimal performance of other classification methods.
|
| Keywords
NPP/VIIRS nighttime light data
electric power consumption
city classification
K-Means algorithm
|
|
|
|
Corresponding Authors:
WANG Maohua
E-mail: zhangli02@sari.ac.cn;wangmh@sari.ac.cn
|
|
Issue Date: 23 December 2020
|
|
|
| [1] |
肖宏伟. 基于卫星灯光数据的我国省域电力消费模拟研究[J]. 中国能源, 2017,39(1):6-10,14.
|
| [1] |
Xiao H W. Simulation study of provincial electricity consumption based on satellite lighting data[J]. Energy of China, 2017,39(1):6-10,14.
|
| [2] |
袁家海, 丁伟, 胡兆光, 等. 电力消费与中国经济发展的协整与波动分析[J]. 电网技术, 2006,30(9):10-14.
url: http://www.dwjs.com.cn/CN/abstract/abstract21383.shtml
|
| [2] |
Yuan J H, Ding W, Hu Z G, et al. Analysis on cointegration and co-movement of electricity consumption and economic growth in China[J]. Power System Technology, 2006,30(9):10-14.
url: http://www.dwjs.com.cn/CN/abstract/abstract21383.shtml
|
| [3] |
李峰, 米晓楠, 刘军, 等. 基于NPP-VIIRS夜间灯光数据的北京市GDP空间化方法[J]. 国土资源遥感, 2016,28(3):19-24.doi: 10.6046/gtzyyg.2016.03.04.
|
| [3] |
Li F, Mi X N, Liu J, et al. Spatialization of GDP in Beijing using NPP-VIIRS data[J]. Remote Sensing for Land and Resources, 2016,28(3):19-24.doi: 10.6046/gtzyyg.2016.03.04.
|
| [4] |
沈丹, 周亮, 王培安. 基于夜间灯光数据的六盘山连片特困区贫困度识别[J]. 国土资源遥感, 2019,31(2):157-163.doi: 10.6046/gtzyyg.2019.02.22.
|
| [4] |
Shen D, Zhou L, Wang P A. Identification of poverty based on nighttime light remote sensing data:A case study on contiguous special poverty-stricken areas in Liupan Mountains[J]. Remote Sensing for Land and Resources, 2019,31(2):157-163.doi: 10.6046/gtzyyg.2019.02.22.
|
| [5] |
肖东升, 杨松. 基于夜间灯光数据的人口空间分布研究综述[J]. 国土资源遥感, 2019,31(3):10-19.doi: 10.6046/gtzyyg.2019.03.02.
|
| [5] |
Xiao D S, Yang S. A review of population spatial distribution based on nighttime light data[J]. Remote Sensing for Land and Resources, 2019,31(3):10-19.doi: 10.6046/gtzyyg.2019.03.02.
|
| [6] |
He C, Ma Q, Li T, et al. Spatiotemporal dynamics of electric power consumption in Chinese mainland from 1995 to 2008 modeled using DMSP/OLS stable nighttime lights data[J]. Journal of Geographical Sciences, 2014,22(1):125-136.
|
| [7] |
Su Y, Chen X, Wang C, et al. A new method for extracting built-up urban areas using DMSP-OLS nighttime stable lights:A case study in the Pearl River Delta,southern China[J]. Mapping Sciences and Remote Sensing, 2015,52(2):218-238.
|
| [8] |
Cao X, Wang J, Chen J, et al. Spatialization of electricity consumption of China using saturation-corrected DMSP-OLS data[J]. International Journal of Applied Earth Observations and Geoinformation, 2014(28):193-200.
|
| [9] |
Zhao N, Ghosh T, Samson E L, et al. Mapping spatio-temporal changes of Chinese electric power consumption using night-time imagery[J]. International Journal of Remote Sensing, 2012,33(20):6304-6320.
doi: 10.1080/01431161.2012.684076
url: https://www.tandfonline.com/doi/full/10.1080/01431161.2012.684076
|
| [10] |
Xie Y, Weng Q. World energy consumption pattern as revealed by DMSP-OLS nighttime light imagery[J]. GIScience and Remote Sensing, 2016,53(2):265-282.
|
| [11] |
李通, 何春阳, 杨洋, 等. 1995—2008年中国大陆电力消费量时空动态[J]. 地理学报, 2011,66(10):1403-1412.
|
| [11] |
Li T, He C Y, Yang Y, et al. Understanding electricity consumption changes in Chinese mainland from 1995 to 2008 by using DMSP/OLS stable nighttime light time series data[J]. Acta Geographica Sinica, 2011,66(10):1403-1412.
|
| [12] |
施建刚, 裘丽岚. 城市群内城市分级方法比较研究——以成都平原城市群为例[J]. 城市问题, 2009,173(12):19-22,32.
|
| [12] |
Shi J G, Qiu L L. Comparative study on city classification within urban agglomeration[J]. Urban Problems, 2009,173(12):19-22,32.
|
| [13] |
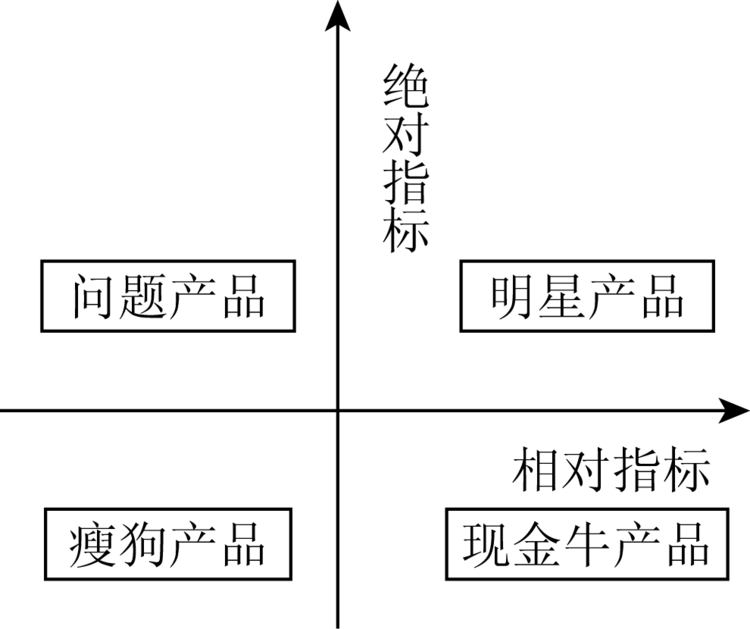
李熙, 薛翔宇. 基于波士顿矩阵的夜光遥感电力消费估算方法[J]. 武汉大学学报(信息科学版), 2018,43(12):1994-2002.
|
| [13] |
Li X, Xue X Y. Estimation method of nighttime light images’ electric power consumption based on the Boston matrix[J]. Geomatics and Information Science of Wuhan University, 2018,43(12):1994-2002.
|
| [14] |
Li S, Cheng L, Liu X, et al. City type-oriented modeling electric power consumption in China using NPP-VIIRS nighttime stable light data[J]. Energy, 2019(189):116040.
|
| [15] |
Henderson J, Storeygard A, Weil D. Measuring economic growth from outer space[J]. American Economic Review, 2012,102(2):994-1028.
doi: 10.1257/aer.102.2.994
url: http://dx.doi.org/10.1257/aer.102.2.994
|
| [16] |
李欣欣, 王利, 何飞. 基于NPP/VIIRS夜间灯光数据和土地利用数据的人口分布图绘制——以大连金普新区为例[J]. 遥感信息, 2018,33(4):35-41.
|
| [16] |
Li X X, Wang L, He F. Population distribution map drawing based on NPP/VIIRS nighttime light remote sensing images and land use data:A case study in Jinpu new area[J]. Remote Sensing Information, 2018,33(4):35-41.
|
| [17] |
Jing X, Shao X, Cao C, et al. Comparison between the Suomi-NPP day-night band and DMSP-OLS for correlating socio-economic variables at the provincial level in China[J]. Remote Sensing, 2015,8(1):17.
|
| [18] |
李雪萍, 贡璐. DMSP/OLS和VIIRS/DNB夜间灯光影像的校正及拟合[J]. 测绘通报, 2019(7):138-146.
|
| [18] |
Li X P, Gong L. Correction and fitting of night light images of DMSP/OLS and VIIRS/DNB[J]. Bulletin of Surveying and Mapping, 2019(7):138-146.
|
| [19] |
Shi K, Chen Y, Yu B, et al. Modeling spatiotemporal CO2 (carbon dioxide) emission dynamics in China from DMSP-OLS nighttime stable light data using panel data analysis[J]. Applied Energy, 2016(168):523-533.
|
| [20] |
Fan Y, Liu L C, Wu G, et al. Analyzing impact factors of CO2 emissions using the STIRPAT model[J]. Environmental Impact Assessment Review, 2006,26(4):377-395.
|
| [21] |
Zhou Y, Clarke L, Eom J, et al. Modeling the effect of climate change on U.S. state-level buildings energy demands in an integrated assessment framework[J]. Applied Energy, 2014(113):1077-1088.
|
| [22] |
Hartigan J A, Wong M A. A K-means clustering algorithm[J]. Journal of Applied Statistics, 2013,28(1):100-108.
|
| [23] |
Bansal N, Blum A, Chawla S, et al. Correlation clustering[J]. Machine Learning, 2004,56(1-3):89-113.
|
| [24] |
Maddah M, Grimson W E L, Warfield S K. Statistical modeling and EM clustering of white matter fiber tracts[C]// Proceedings of the 2006 IEEE International Symposium on Biomedical Imaging:From Nano to Macro,Arlington,VA,USA, 2006:6-9.
|
| [25] |
Davies D L, Bouldin D W. A cluster separation measure[J]. IEEE Transactions Pattern Analysis and Machine Intelligence, 1979,PAMI-1(2):224-227.
|
| [26] |
Calinski T, Harabasz J. A dendrite method for cluster analysis[J]. Communiccrtionsin Statistics, 1974,3(1):1-27.
|
| [27] |
Li X, Li D, Xu H, et al. Intercalibration between DMSP/OLS and VIIRS night-time light images to evaluate city light dynamics of Syria’s major human settlement during Syrian Civil War[J]. International Journal of Remote Sensing, 2017,38(21):5934-5951.
|
| [28] |
Hu Y, Zhao G, Zhang Q L. Spatial distribution of population data based on nighttime light and LUCC data in the Sichuan-Chongqing region[J]. Journal of Geo-Information Science, 2018,20(1):68-78.
|
| [29] |
Su Y, Chen X, Li Y, et al. China’s 19-year city-level carbon emissions of energy consumptions,driving forces and regionalized mitigation guidelines[J]. Renewable and Sustainable Energy Reviews, 2014(35):231-243.
|
|
Viewed |
|
|
|
Full text
|
|
|
|
|
Abstract
|
|
|
|
|
Cited |
|
|
|
|
| |
Shared |
|
|
|
|
| |
Discussed |
|
|
|
|
 2020,
Vol. 32
2020,
Vol. 32