|
|
 |
|
|
|
|
Spatiotemporal characteristics of the surface urban heat island effect in Tianjin City based on ECOSTRESS data |
QIN Jiakai1( ), ZHU Zhongli1(), WU Qingxia1, ZHANG Kaili2 ), ZHU Zhongli1(), WU Qingxia1, ZHANG Kaili2 |
1. State Key Laboratory of Earth Surface Processes and Hazards Risk Governance (ESPHR), Faculty of Geographical Science, Beijing Normal University, Beijing 100875, China
2. School of Remote Sensing & Geomatics Engineering, Nanjing University of Information Science and Technology, Nanjing 210044, China |
|
|
|
|
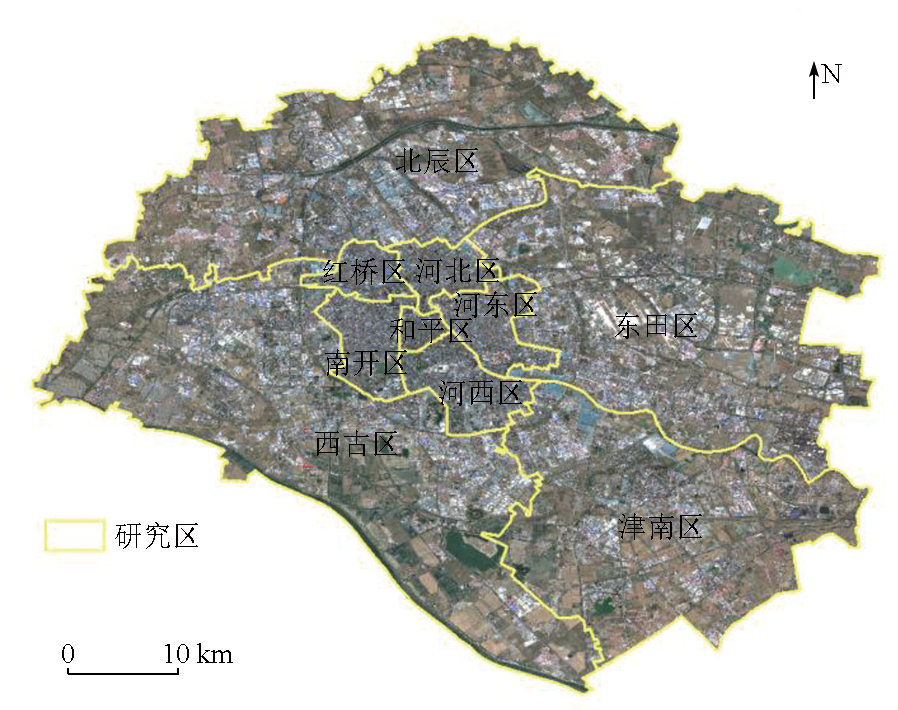
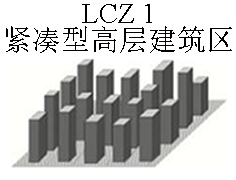
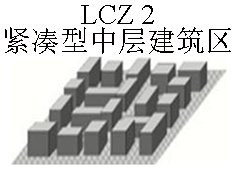
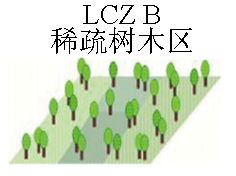
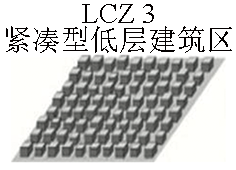
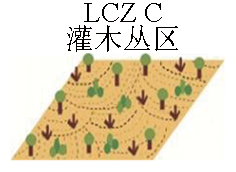
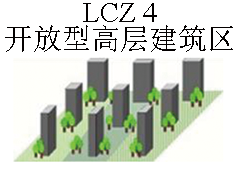
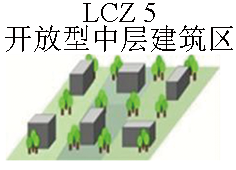
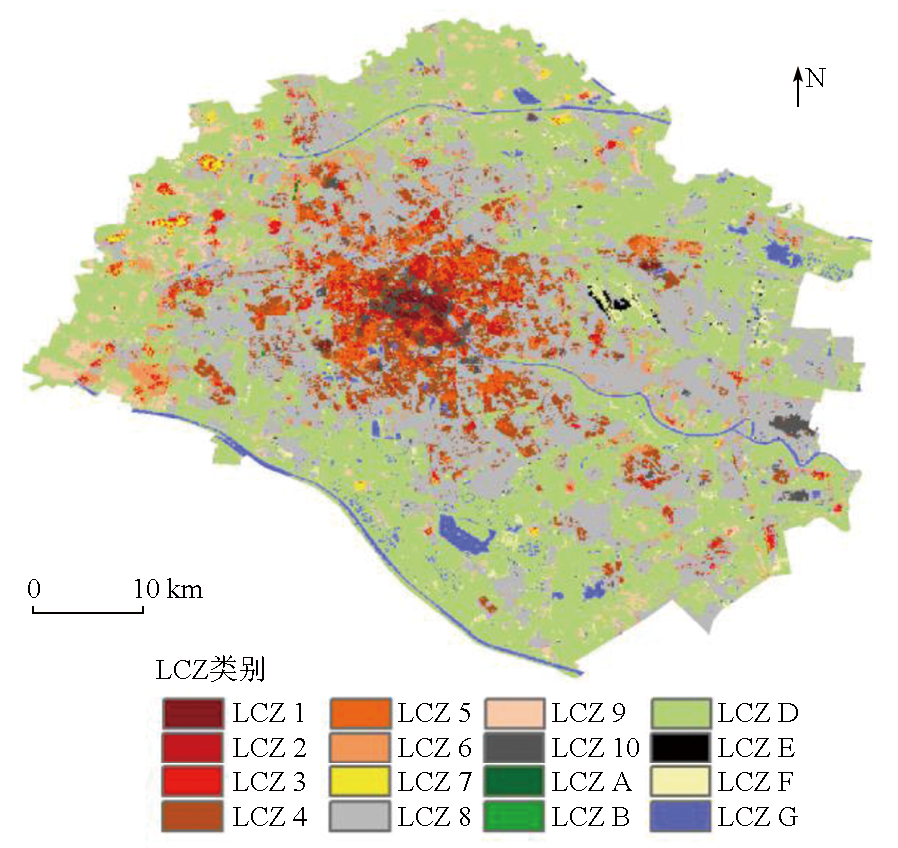
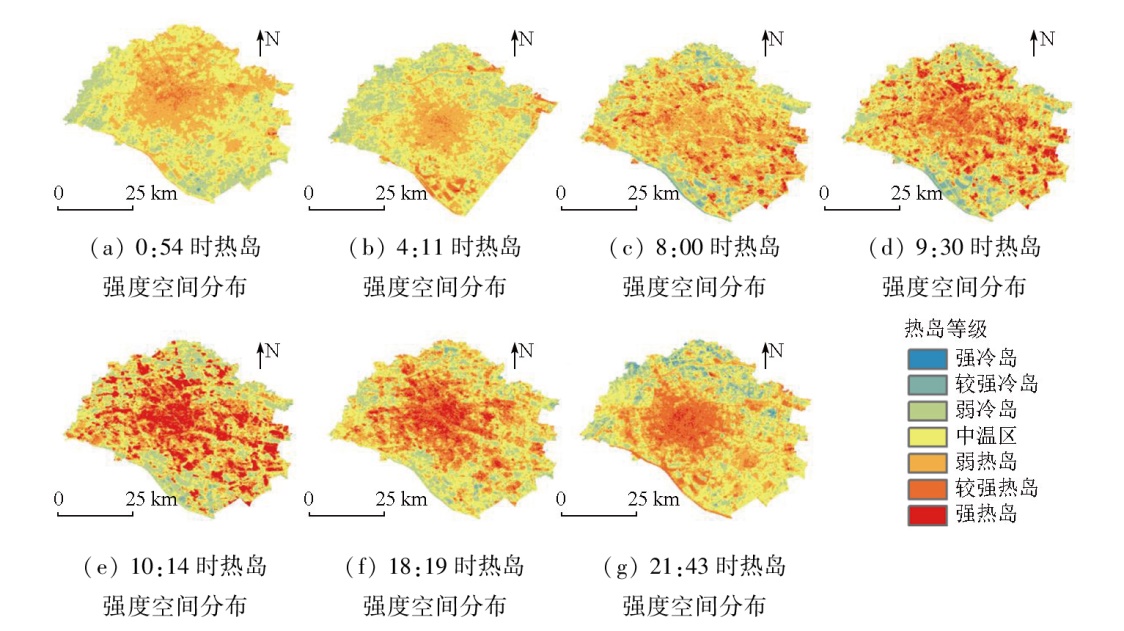
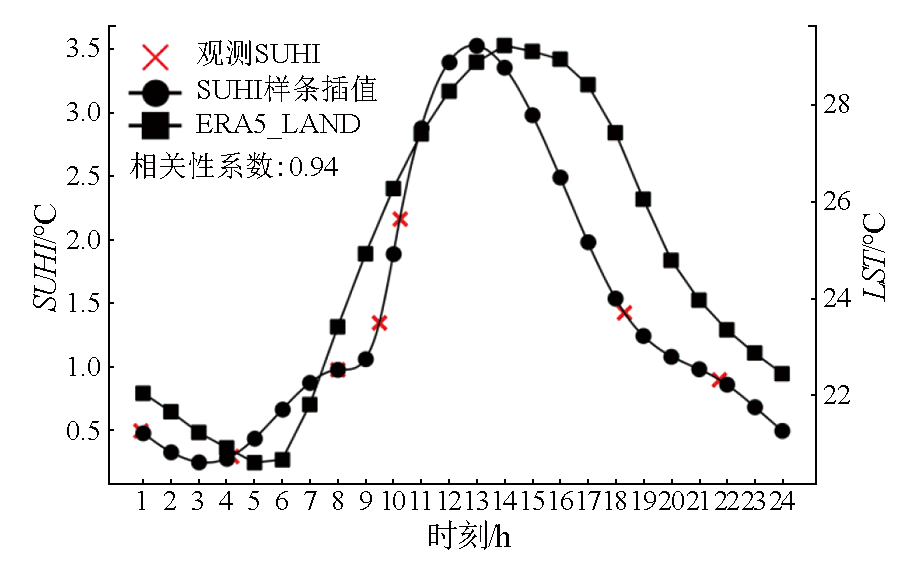
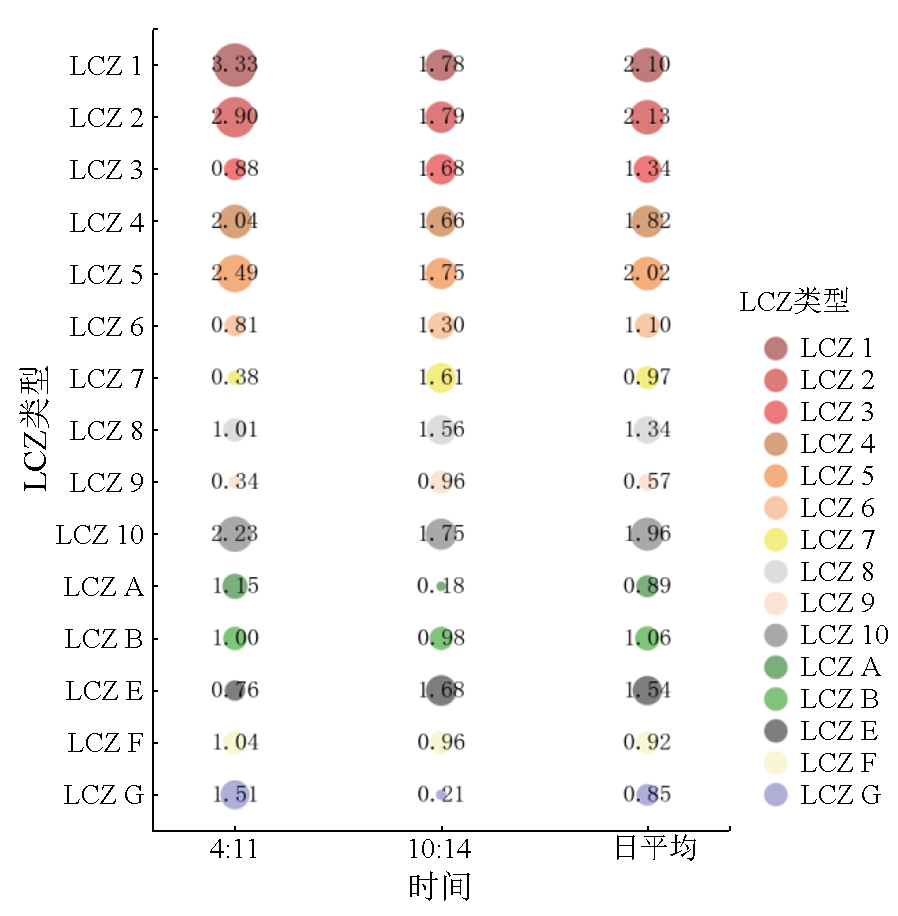
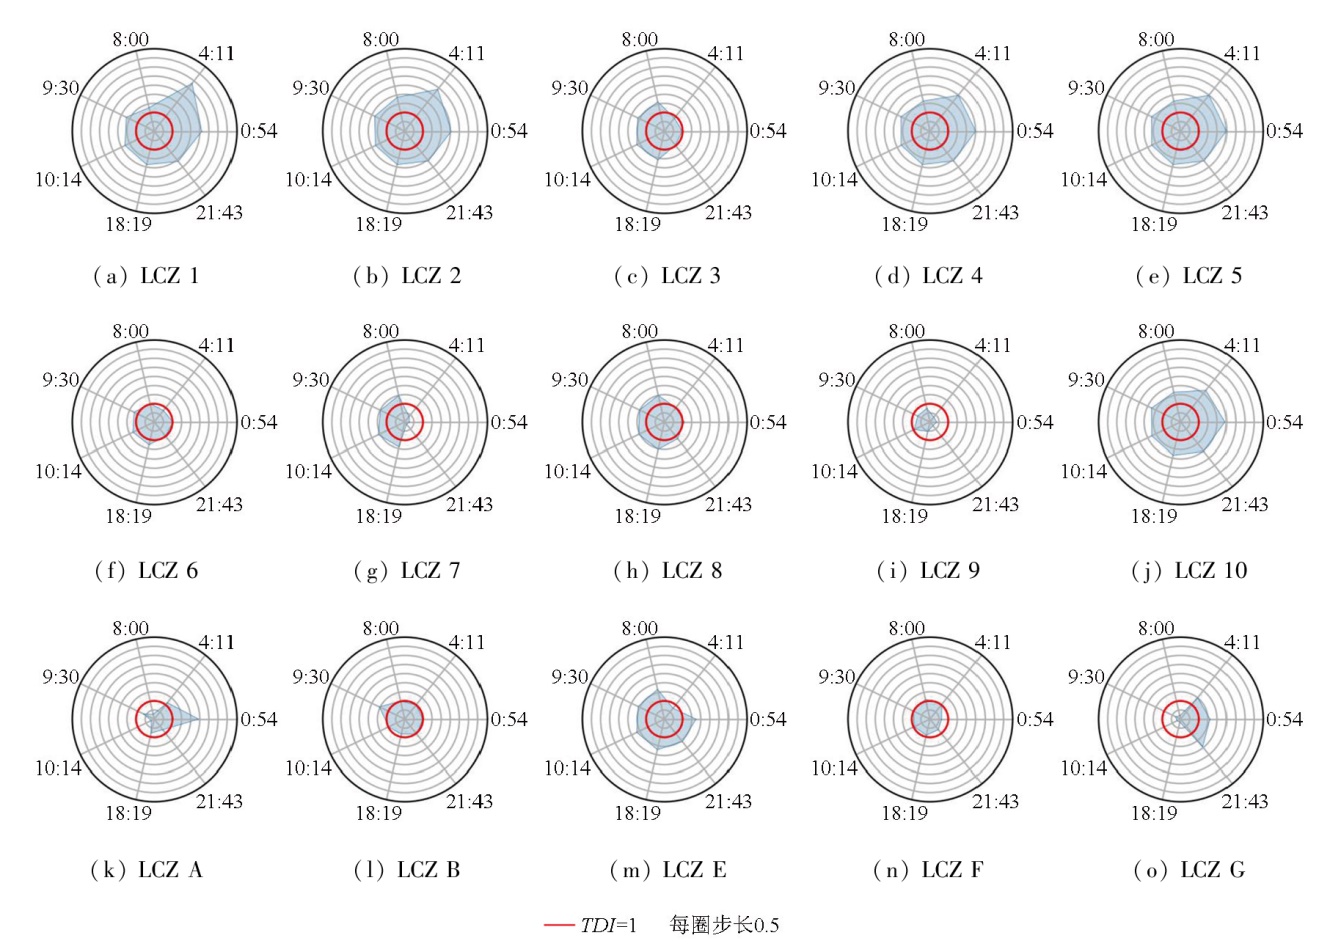
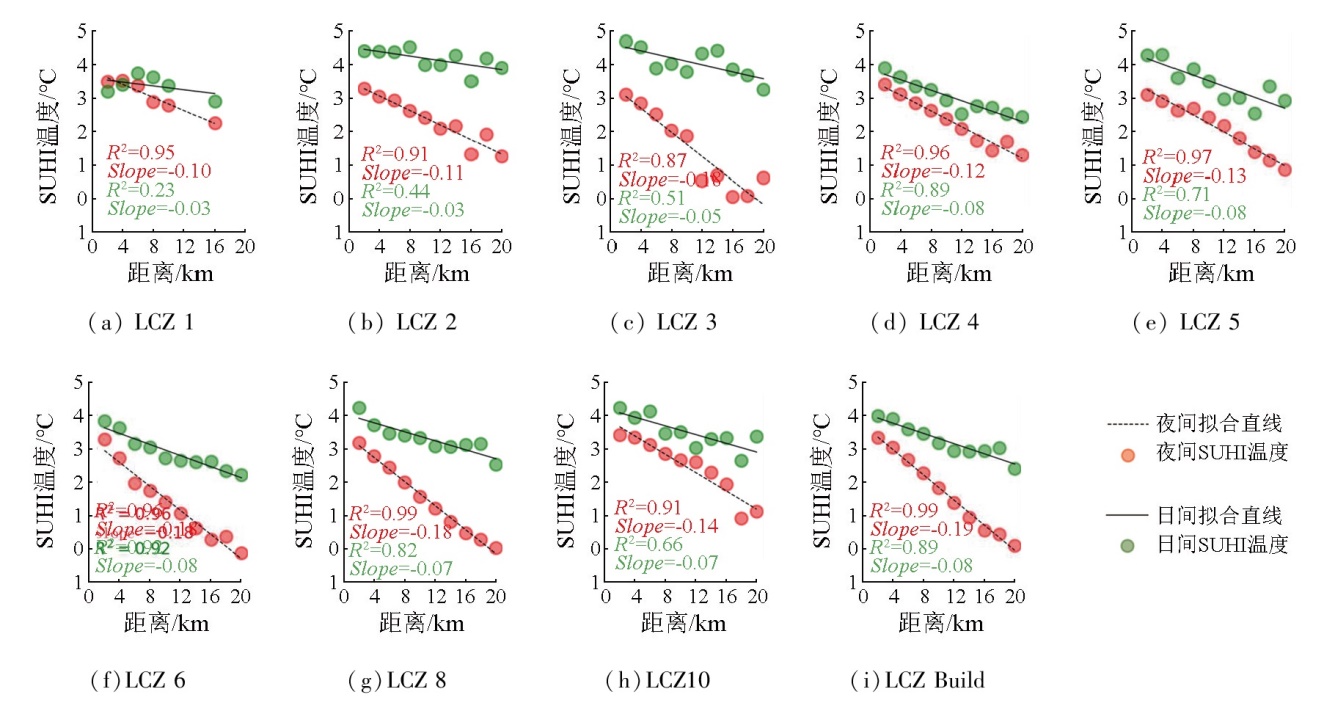
Abstract With the continuous advancement of urbanization, the local thermal environments and microclimates of cities have undergone varying degrees of change, leading to the surface urban heat island (SUHI) effect. Based on the ECOsystem Spaceborne Thermal Radiometer Experiment on Space Station (ECOSTRESS) data and local climate zones (LCZs), this study investigated the diurnal variations of the SUHI effect in Tianjin City, the contributions of various LCZs to the SUHI effect during daytime and nighttime, and the SUHI gradient attenuation differences. The results indicate that the central urban area of Tianjin exhibited significant diurnal variations in the SUHI effect, reaching a minimum value of 0.14 at 3:00 and a maximum value of 3.56 at 13:00, with an average diurnal-nocturnal difference of 1.59. On a daily scale, the contributions of various LCZs to the SUHI effect displayed notable intra-class and inter-class differences. Generally, LCZ1 (compact high-rise buildings) and LCZ2 (compact mid-rise buildings) showed thermal difference indices (TDIs) of 2.10 and 2.13, respectively, serving as the primary heat sources. In contrast, LCZA (dense trees) and LCZG (water bodies) yielded TDIs of 0.89 and 0.85, respectively, serving as the primary cold sources. Notably, the roles of LCZ7 (lightweight low-rise buildings), LCZA, and LCZG as cold/heat sources changed significantly during daytime and nighttime. A pronounced SUHI gradient effect was observed in the central urban area of Tianjin, with the SUHI intensity negatively correlated with the distance from the urban center, building height, and building density. The Moran’s I of the SUHI effect was 0.70 during daytime and 0.84 during nighttime, indicating that the SUHI effect exhibited stronger spatial aggregation and gradient effect during nighttime. Overall, by analyzing the diurnal dynamic changes of the SUHI effect and the contributions of various LCZs to the SUHI effect, this study reduces the errors associated with previous analyses that rely solely on fixed-time images. It provides a novel insight into understanding urban planning and sustainable development policies. Moreover, this study can be referenced for alleviating the SUHI effect and improving the livability and sustainable development of cities.
|
| Keywords
local climate zone (LCZ)
ECOsystem Spaceborne Thermal Radiometer Experiment on Space Station (ECOSTRESS)
diurnal variation
gradient effect
surface urban heat island (SUHI)
|
|
|
|
Issue Date: 31 December 2025
|
|
|
| [1] |
MacKey C W, Lee X H, Smith R B. Remotely sensing the cooling effects of city scale efforts to reduce urban heat island[J]. Building and Environment, 2012,49:348-358.
|
| [2] |
Weng Q H. Remote sensing of impervious surfaces in the urban areas:Requirements,methods,and trends[J]. Remote Sensing of Environment, 2012,117:34-49.
|
| [3] |
肖达. 北京市城市热环境的多时间尺度分析研究[D]. 西安: 长安大学, 2021.
|
| [3] |
Xiao D. A multi-timescale study of the urban thermal environment in Beijing[D]. Xi’an: Changan University, 2021.
|
| [4] |
Grimm N B, Faeth S H, Golubiewski N E, et al. Global change and the ecology of cities[J]. Science, 2008, 319(5864):756-760.
doi: 10.1126/science.1150195
pmid: 18258902
|
| [5] |
Wang W W, Zhou W, Ng E Y Y, et al. Urban heat islands in Hong Kong:Statistical modeling and trend detection[J]. Natural Haza-rds, 2016, 83(2):885-907.
|
| [6] |
Weng Q H, Lu D S, Schubring J. Estimation of land surface temperature-vegetation abundance relationship for urban heat island studies[J]. Remote Sensing of Environment, 2004, 89(4):467-483.
doi: 10.1016/j.rse.2003.11.005
url: https://linkinghub.elsevier.com/retrieve/pii/S0034425703003390
|
| [7] |
Shen H F, Huang L W, Zhang L P, et al. Long-term and fine-scale satellite monitoring of the urban heat island effect by the fusion of multi-temporal and multi-sensor remote sensed data:A 26-year case study of the city of Wuhan in China[J]. Remote Sensing of Environment, 2016,172:109-125.
|
| [8] |
黄群芳. 城市空间形态对城市热岛效应的多尺度影响研究进展[J]. 地理科学, 2021, 41(10):1832-1842.
doi: 10.13249/j.cnki.sgs.2021.10.015
|
| [8] |
Huang Q F. Effects of urban spatial morphology on urban heat island effect from multi-spatial scales perspectives[J]. Scientia Geographica Sinica, 2021, 41(10):1832-1842.
doi: 10.13249/j.cnki.sgs.2021.10.015
|
| [9] |
Rizwan A M, Dennis L Y C, Liu C H. A review on the generation,determination and mitigation of Urban Heat Island[J]. Journal of Environmental Sciences, 2008, 20(1):120-128.
doi: 10.1016/s1001-0742(08)60019-4
pmid: 18572534
|
| [10] |
Stewart I D, Oke T R. Local climate zones for urban temperature studies[J]. Bulletin of the American Meteorological Society, 2012, 93(12):1879-1900.
doi: 10.1175/BAMS-D-11-00019.1
url: https://journals.ametsoc.org/doi/10.1175/BAMS-D-11-00019.1
|
| [11] |
Richard Y, Emery J, Dudek J, et al. How relevant are local climate zones and urban climate zones for urban climate research? Dijon (France) as a case study[J]. Urban Climate, 2018,26:258-274.
|
| [12] |
Li X M, Zhou W Q, Ouyang Z Y. Relationship between land surface temperature and spatial pattern of greenspace:What are the effects of spatial resolution?[J]. Landscape and Urban Planning, 2013,114:1-8.
|
| [13] |
Collins J, Dronova I. Urban landscape change analysis using local climate zones and object-based classification in the salt lake metro region,Utah,USA[J]. Remote Sensing, 2019, 11(13):1615.
doi: 10.3390/rs11131615
url: https://www.mdpi.com/2072-4292/11/13/1615
|
| [14] |
Migliari M, Briche E, Despax J, et al. A cross-analysis matrix comparing multi-site Local Climate Zone trends:Application to identify sustainable built morphologies improving summer daytime urban microclimate[J]. Sustainable Futures, 2024,7:100162.
|
| [15] |
Žgela M, Herceg-Bulić I, Lozuk J, et al. Linking land surface temperature and local climate zones in nine Croatian cities[J]. Urban Climate, 2024,54:101842.
|
| [16] |
Baqa M F, Lu L, Guo H D, et al. Investigating heat-related health risks related to local climate zones using SDGSAT-1 high-resolution thermal infrared imagery in an arid megacity[J]. International Journal of Applied Earth Observation and Geoinformation, 2025,136:104334.
|
| [17] |
Bechtel B, Demuzere M, Mills G, et al. SUHI analysis using local climate zones—A comparison of 50 cities[J]. Urban Climate, 2019,28:100451.
|
| [18] |
Yang X S, Yao L Y, Jin T, et al. Assessing the thermal behavior of different local climate zones in the Nanjing metropolis,China[J]. Building and Environment, 2018,137:171-184.
|
| [19] |
Weng Q H. Thermal infrared remote sensing for urban climate and environmental studies:Methods,applications,and trends[J]. ISPRS Journal of Photogrammetry and Remote Sensing, 2009, 64(4):335-344.
doi: 10.1016/j.isprsjprs.2009.03.007
url: https://linkinghub.elsevier.com/retrieve/pii/S092427160900046X
|
| [20] |
Chang Y, Xiao J F, Li X X, et al. Exploring diurnal cycles of surface urban heat island intensity in Boston with land surface temperature data derived from GOES-R geostationary satellites[J]. Science of the Total Environment, 2021,763:144224.
|
| [21] |
Li X, Xiao J, Fisher J B, et al. ECOSTRESS estimates gross primary production with fine spatial resolution for different times of day from the International Space Station[J]. Remote Sensing of Environment, 2021,258:112360.
|
| [22] |
Xiao J F, Fisher J B, Hashimoto H, et al. Emerging satellite observations for diurnal cycling of ecosystem processes[J]. Nature Plants, 2021, 7(7):877-887.
doi: 10.1038/s41477-021-00952-8
pmid: 34211130
|
| [23] |
Hulley G, Shivers S, Wetherley E, et al. New ECOSTRESS and MODIS land surface temperature data reveal fine-scale heat vulnerability in cities:A case study for Los Angeles County,California[J]. Remote Sensing, 2019, 11(18):2136.
doi: 10.3390/rs11182136
url: https://www.mdpi.com/2072-4292/11/18/2136
|
| [24] |
袁博. 城市三维空间形态对地表热环境的影响及热暴露风险评估[D]. 兰州: 兰州交通大学, 2022.
|
| [24] |
Yuan B. Effects of urban three-dimensional spatial morphology on land surface thermal environment and assessment of heat exposure risks[D]. Lanzhou: Lanzhou Jiaotong University, 2022.
|
| [25] |
Yuan B, Zhou L, Hu F, et al. Diurnal dynamics of heat exposure in Xi’an:A perspective from local climate zone[J]. Building and Environment, 2022,222:109400.
|
| [26] |
赵欣, 赵凯旭, 黄晓军. 基于ECOSTRESS地表温度和手机信令数据的城市人口热环境暴露风险评价——以西安市为例[J]. 地理科学进展, 2022, 41(11):2061-2072.
doi: 10.18306/dlkxjz.2022.11.006
|
| [26] |
Zhao X, Zhao K X, Huang X J. Population exposure risk to urban extreme heat environment based on ECOSTRESS land surface temperature and mobile phone signaling data:A case study of Xi’an City[J]. Progress in Geography, 2022, 41(11):2061-2072.
|
| [27] |
Vo T T, Hu L. Diurnal evolution of urban tree temperature at a city scale[J]. Scientific Reports, 2021, 11(1):10491.
doi: 10.1038/s41598-021-89972-0
pmid: 34006981
|
| [28] |
Chang Y, Xiao J F, Li X X, et al. Exploring diurnal thermal variations in urban local climate zones with ECOSTRESS land surface temperature data[J]. Remote Sensing of Environment, 2021,263:112544.
|
| [29] |
Yao X, Zeng X J, Zhu Z P, et al. Exploring the diurnal variations of the driving factors affecting block-based LST in a “Furnace city” using ECOSTRESS thermal imaging[J]. Sustainable Cities and Society, 2023,98:104841.
|
| [30] |
Wang Q, Wang X N, Meng Y, et al. Exploring the impact of urban features on the spatial variation of land surface temperature within the diurnal cycle[J]. Sustainable Cities and Society, 2023,91:104432.
|
| [31] |
彭敏, 姚娜, 孙培蕾, 等. 基于ECOSTRESS的城市热环境昼夜空间特征分析[J]. 测绘通报, 2024(6):151-156,181.
doi: 10.13474/j.cnki.11-2246.2024.0626
|
| [31] |
Peng M, Yao N, Sun P L, et al. Spatial characteristics analysis of urban thermal diurnal environment based on ECOSTRESS[J]. Bulletin of Surveying and Mapping, 2024(6):151-156,181.
doi: 10.13474/j.cnki.11-2246.2024.0626
|
| [32] |
Demuzere M, Kittner J, Martilli A, et al. A global map of local climate zones to support earth system modelling and urban-scale environmental science[J]. Earth System Science Data, 2022, 14(8):3835-3873.
doi: 10.5194/essd-14-3835-2022
url: https://essd.copernicus.org/articles/14/3835/2022/
|
| [33] |
Hulley G. ECOsystem Spaceborne Thermal Radiometer Experiment on Space Station (ECOSTRESS) Mission-Level 2 Product User Guide[J/OL].USGS,2019(2019-06-18)[2024-10-23]. lpdaac.usgs.gov/documents/424/ECO3ETPTJPL_User_Guide_V1.pdf.
url: lpdaac.usgs.gov/documents/424/ECO3ETPTJPL_User_Guide_V1.pdf
|
| [34] |
Hulley G C, Göttsche F M, Rivera G, et al. Validation and quality assessment of the ECOSTRESS level-2 land surface temperature and emissivity product[J]. IEEE Transactions on Geoscience and Remote Sensing, 2021,60:1-23.
|
| [35] |
Peng J, Xie P, Liu Y X, et al. Urban thermal environment dynamics and associated landscape pattern factors:A case study in the Beijing metropolitan region[J]. Remote Sensing of Environment, 2016,173:145-155.
|
| [36] |
伍肖肖. 城市绿地对热岛效应的缓解作用及其优化策略研究——以贵阳市主城区为例[D]. 贵阳: 贵州师范大学, 2024.
|
| [36] |
Wu X X. Research on the mitigation effect of urban green space on heat island effect and its optimisation strategy- A case study of the main urban area of Guiyang city[D]. Guiyang: Guizhou Normal University, 2024.
|
| [37] |
张沁, 张守平, 杨清伟. 山地新城市化进程的热岛效应时空演变特性研究[J]. 中国农业大学学报, 2024, 29(10):290-304.
|
| [37] |
Zhang Q, Zhang S P, Yang Q W. Spatio-temporal characteristics of heat island effect during new urbanization in mountainous areas[J]. Journal of China Agricultural University, 2024, 29(10):290-304.
|
| [38] |
何苗. 基于多源遥感的北京城市高温热浪风险评估[D]. 南京: 南京信息工程大学, 2019.
|
| [38] |
He M. Assessing heat wave risk in Beijing by multi-source remote sensing[D]. Nanjing: Nanjing University of Information Science and Technology, 2019.
|
| [39] |
Lu Y S, He T, Xu X L, et al. Investigation the robustness of standard classification methods for defining urban heat islands[J]. IEEE Journal of Selected Topics in Applied Earth Observations and Remote Sensing, 2021,14:11386-11394.
|
| [40] |
王杉. 基于LCZ的长三角城市群热岛的时空特征及规划对策研究[D]. 杭州: 浙江大学, 2023.
|
| [40] |
Wang S. Research on the spatial and temporal characteristics and planning countermeasures of UHI in the Yangtze river delta urban agglomeration based on LCZ[D]. Hangzhou: Zhejiang University, 2023.
|
| [41] |
张策, 吕王勇, 张萍, 等. 基于Moran’s I的多变量空间自相关研究与应用[J]. 四川师范大学学报(自然科学版), 2024, 47(6):818-829.
|
| [41] |
Zhang C, Lyu W Y, Zhang P, et al. Research and application of multivariate spatial autocorrelation based on Moran’s I[J]. Journal of Sichuan Normal University (Natural Science), 2024, 47(6):818-829.
|
| [42] |
Li F, Sun W W, Yang G, et al. Investigating spatiotemporal patterns of surface urban heat islands in the Hangzhou metropolitan area,China,2000—2015[J]. Remote Sensing, 2019, 11(13):1553.
doi: 10.3390/rs11131553
url: https://www.mdpi.com/2072-4292/11/13/1553
|
| [43] |
Guo G H, Wu F C, Xie F Z, et al. Spatial distribution and pollution assessment of heavy metals in urban soils from southwest China[J]. Journal of Environmental Sciences, 2012, 24(3):410-418.
pmid: 22655353
|
| [44] |
刘晓娟. 城市发展对生物多样性的影响研究——以中国鸟类多样性为例[D]. 上海: 华东师范大学, 2024.
|
| [44] |
Liu X J. Impacts of urban development on biodiversity:Empirical evidence from bird diversity in China[D]. Shanghai: East China Normal University, 2024.
|
| [45] |
方云皓, 顾康康, 马晴. 基于多源数据的城市通风廊道构建及效能评估研究——以合肥市主城区为例[J]. 地理科学进展, 2024, 43(8):1597-1608.
doi: 10.18306/dlkxjz.2024.08.010
|
| [45] |
Fang Y H, Gu K K, Ma Q. Construction and efficiency assessment of urban ventilation corridors based on multi-source data:A case study of the main urban area of Hefei City[J]. Progress in Geography, 2024, 43(8):1597-1608.
|
| [46] |
Zhao L, Lee X H, Smith R B, et al. Strong contributions of local background climate to urban heat islands[J]. Nature, 2014, 511(7508):216-219.
doi: 10.1038/nature13462
|
| [47] |
Huang X, Wang Y. Investigating the effects of 3D urban morphology on the surface urban heat island effect in urban functional zones by using high-resolution remote sensing data:A case study of Wuhan,Central China[J]. ISPRS Journal of Photogrammetry and Remote Sensing, 2019,152:119-131.
|
|
Viewed |
|
|
|
Full text
|
|
|
|
|
Abstract
|
|
|
|
|
Cited |
|
|
|
|
| |
Shared |
|
|
|
|
| |
Discussed |
|
|
|
|
 2025,
Vol. 37
2025,
Vol. 37