|
|
|
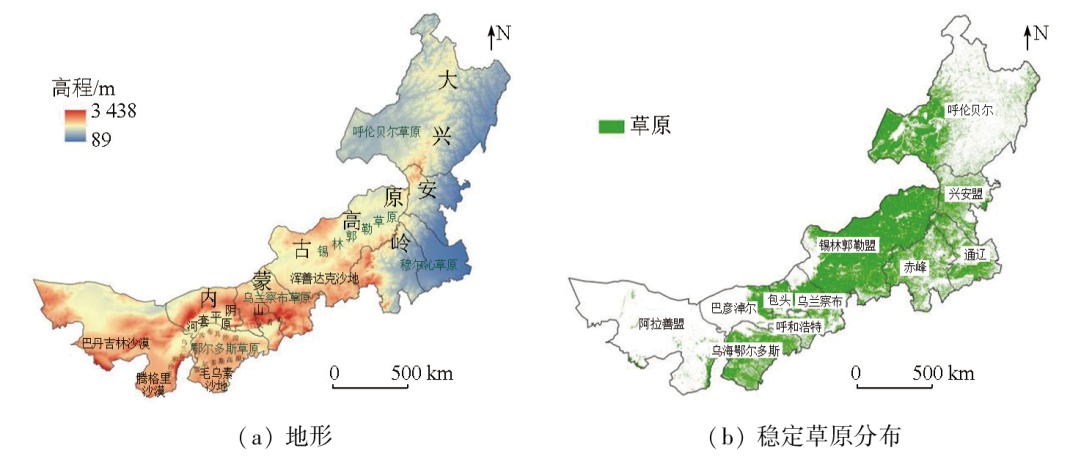
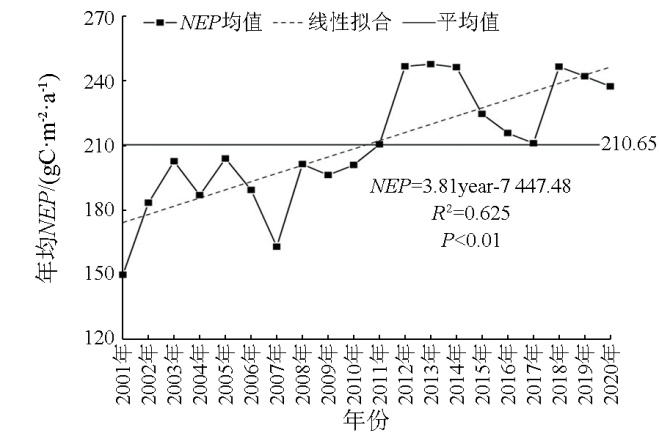
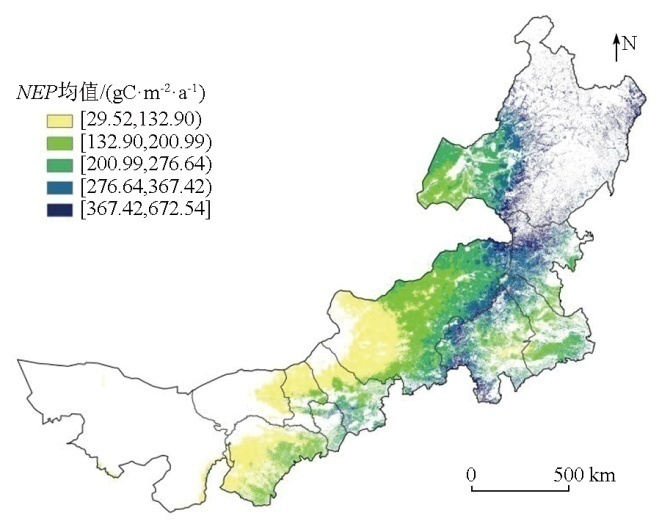
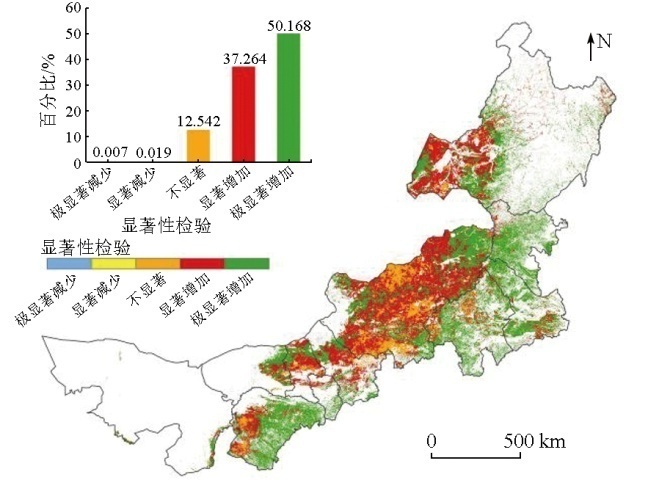
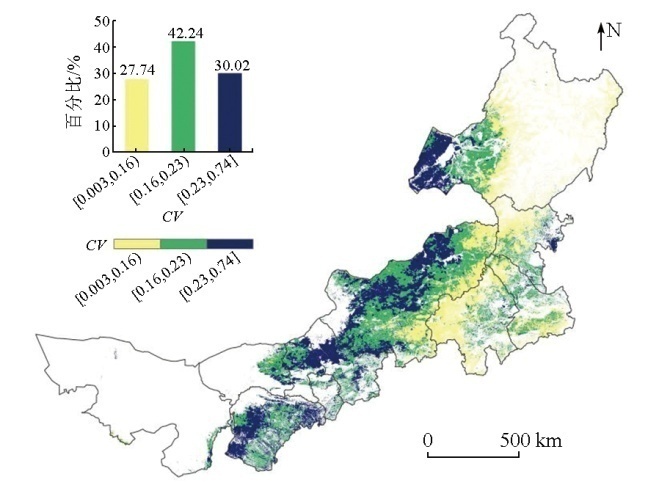
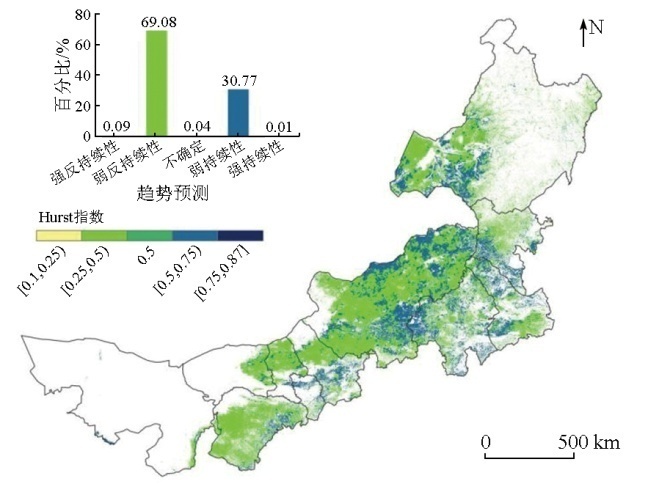
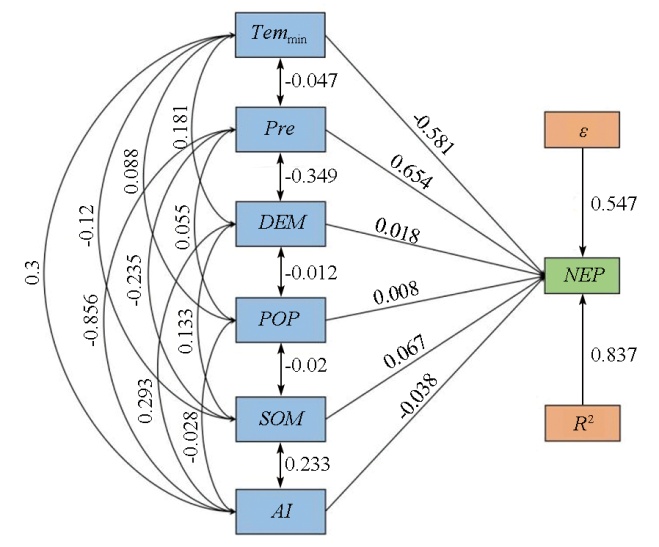
Abstract Net ecosystem productivity (NEP) serves as a significant index that quantitatively represents the carbon sequestration capacity of ecosystems. This study aims to explore the carbon source/sink status of the Inner Mongolian grassland ecosystem to support the efforts for low carbon and emission reduction. Based on MODIS NPP and meteorological data, and applying the trend analysis, coefficient of variation, Hurst index, and path analysis, this study explored the spatiotemporal variations of the NEP index in the Inner Mongolian grassland ecosystem from 2001 to 2020 and its relationship with influential factors. The results indicate that the overall spatial distribution pattern of average NEP in the Inner Mongolian grassland ecosystem was characterized by a gradual increase from northwest to southeast, and a gradual decrease from the Great Xing’an Range to the eastern and western foothills. The average annual NEP over the past 20 years was 210.65 gC·m-2·a-1, showing a fluctuating increase at a rate of 3.81 gC·m-2·a-1. The areas with increased NEP represented 99.33 % of the total grassland area, suggesting relatively stable changes in carbon sink. However, 69.08 % of NEP in the grassland system is expected to show weak anti-persistence in the near future, suggesting that carbon sink might be weakened. The selected influential factors, dominated by rainfall and minimum temperature, comprehensively explained 83.7 % of NEP variations. The results of this study assist in understanding the carbon sequestration characteristics of the Inner Mongolian grassland ecosystem while holding critical significance for achieving the carbon peak and neutrality goals.
|
| Keywords
Inner Mongolian grassland ecosystem
net ecosystem productivity (NEP) index
carbon source/sink
spatiotemporal variations
path analysis
|
|
|
|
Issue Date: 01 July 2025
|
|
|
| [1] |
Woodwell G M, Whittaker R H. Primary production in terrestrial ecosystems[J]. Integrative and Comparative Biology, 1968, 8(1):19-30.
|
| [2] |
曹云, 孙应龙, 姜月清, 等. 黄河流域净生态系统生产力的时空分异特征及其驱动因子分析[J]. 生态环境学报, 2022, 31(11):2101-2110.
doi: 10.16258/j.cnki.1674-5906.2022.11.001
|
| [2] |
Cao Y, Sun Y L, Jiang Y Q, et al. Analysis on temporal-spatial variations and driving factors of net ecosystem productivity in the Yellow River Basin[J]. Ecology and Environmental Sciences, 2022, 31(11):2101-2110.
|
| [3] |
Qiu J, Song M, Li Y, et al. High level of ammonium nitrogen increases net ecosystem productivity in a Quercus liaotungensis forest in Northern China[J]. Atmosphere, 2022, 13(6):889.
|
| [4] |
Sato Y, Nishihara G N, Tanaka A, et al. Variability in the net ecosystem productivity (NEP) of seaweed farms[J]. Frontiers in Marine Science, 2022,9:861932.
|
| [5] |
You C, Wang Y, Tan X, et al. Inner Mongolia grasslands act as a weak regional carbon sink:A new estimation based on upscaling eddy covariance observations[J]. Agricultural and Forest Meteorology, 2023,342:109719.
|
| [6] |
Shao Y, Liu H, Du Q, et al. Impact of sky conditions on net ecosystem productivity over a “floating blanket” wetland in Southwest China[J]. Advances in Atmospheric Sciences, 2024, 41(2):355-368.
|
| [7] |
田钊, 梁艾琳. 居民碳排放的遥感监测与分析[J]. 自然资源遥感, 2023, 35(4):43-52.doi: 10.6046/zrzyyg.2022310.
|
| [7] |
Tian Z, Liang A L. Remote sensing-based monitoring and analysis of residential carbon emissions[J]. Remote Sensing for Natural Resources, 2023, 35(4):43-52.doi: 10.6046/zrzyyg.2022310.
|
| [8] |
Huang Y, Xu X, Zhang T, et al. Multi-temporal and time-lag responses of terrestrial net ecosystem productivity to extreme climate from 1981 to 2019 in China[J]. Remote Sensing, 2023, 16(1):163.
|
| [9] |
Huang C, Sun C, Nguyen M, et al. Spatio-temporal dynamics of terrestrial Net ecosystem productivity in the ASEAN from 2001 to 2020 based on remote sensing and improved CASA model[J]. Ecological Indicators, 2023,154:110920.
|
| [10] |
Mao F, Du H, Zhou G, et al. Simulated net ecosystem productivity of subtropical forests and its response to climate change in Zhejiang Province,China[J]. Science of the Total Environment, 2022,838:155993.
|
| [11] |
王晴宇. 内蒙古草原植被物候变化及其与净初级生产力关系研究[D]. 长春: 东北师范大学, 2023.
|
| [11] |
Wang Q Y. Research on the relationship between phenological changes of steppe vegetation and net primary productivity in Inner Mongolia,China[D]. Changchun: Northeast Normal University, 2023.
|
| [12] |
侯蒙京. 中国天然草地生产力遥感估算及其时空变化成因研究[D]. 兰州: 兰州大学, 2023.
|
| [12] |
Hou M J. Study on remote sensing estimation of natural grassland productivity and causes analysis of spatiotemporal changes in China[D]. Lanzhou: Lanzhou University, 2023.
|
| [13] |
王明玖. 内蒙古草原生态安全屏障建设的核心是维持碳库稳定[J]. 北方经济, 2023(7):9-12.
|
| [13] |
Wang M J. The core of grassland ecological security barrier construction in Inner Mongolia is to maintain the stability of carbon pool[J]. Northern Economy, 2023(7):9-12.
|
| [14] |
穆少杰, 周可新, 陈奕兆, 等. 内蒙古典型草原不同群落净生态系统生产力的动态变化[J]. 生态学杂志, 2014, 33(4):885-895.
|
| [14] |
Mu S J, Zhou K X, Chen Y Z, et al. Net ecosystem productivity dynamics of grassland communities on the typical steppe of Inner Mongolia[J]. Chinese Journal of Ecology, 2014, 33(4):885-895.
|
| [15] |
董晓宇. 2000—2017年内蒙古荒漠草原植被物候和净初级生产力对气候变化的响应[D]. 西安: 长安大学, 2020.
|
| [15] |
Dong X Y. Responses of phenology and NPP for desert steppe vegetation in Inner Mongolia to climate change from 2000 to 2017[D]. Xi’an: Changan University, 2020.
|
| [16] |
Lyu X, Li X, Dou H, et al. Evaluation of grassland carbon pool based on TECO-R model and climate-driving function:A case study in the Xilingol typical steppe region of Inner Mongolia,China[J]. Ecological Indicators, 2020,117:106508.
|
| [17] |
Zhang L, Cao W, Fan J. Soil organic carbon dynamics in Xilingol grassland of Northern China induced by the Beijing-Tianjin sand source control program[J]. Frontiers of Earth Science, 2017, 11(2):407-415.
doi: 10.1007/s11707-016-0589-9
|
| [18] |
关伟涛. 呼伦贝尔草甸草原不同利用方式下有机碳增汇特征研究[D]. 北京: 中国环境科学研究院, 2023.
|
| [18] |
Guan W T. Study on the characteristic of organic carbon sink enhancement under different disturbances in Hulunbuir meadow steppe[D]. Beijing: Chinese Research Academy of Environmental Sciences, 2023.
|
| [19] |
马军, 平丽华. 基于钻石模型的内蒙古草原碳汇产业竞争力研究[J]. 黑龙江畜牧兽医, 2020(8):14-17,23.
|
| [19] |
Ma J, Ping L H. Study on the competitiveness of Inner Mongolia grassland carbon sequestration industry based on diamond model[J]. Heilongjiang Animal Science and Veterinary Medicine, 2020(8):14-17,23.
|
| [20] |
Liu P, Liu L, Xu X, et al. Carbon footprint and carbon emission intensity of grassland wind farms in Inner Mongolia[J]. Journal of Cleaner Production, 2021,313:127878.
|
| [21] |
潘竟虎, 文岩. 中国西北干旱区植被碳汇估算及其时空格局[J]. 生态学报, 2015, 35(23):7718-7728.
|
| [21] |
Pan J H, Wen Y. Estimation and spatial-temporal characteristics of carbon sink in the arid region of Northwest China[J]. Acta Ecologica Sinica, 2015, 35(23):7718-7728.
|
| [22] |
刘永新, 张思源, 边鹏, 等. 1989—2020年黄河流域巴彦淖尔段地表覆盖类型时空演变研究[J]. 自然资源遥感, 2024, 36(2):207-217.doi:10.6046/zrzyyg.2023049.
|
| [22] |
Liu Y X, Zhang S Y, Bian P, et al. Study on temporal and spatial evolution of land cover types in the Bayannur section of Yellow River Basin from 1989 to 2020[J]. Remote Sensing for Natural Resources, 2024, 36(2):207-217.doi:10.6046/zrzyyg.2023049.
|
| [23] |
Dai E F, Huang Y, Wu Z, et al. Analysis of spatio-temporal features of a carbon source/sink and its relationship to climatic factors in the Inner Mongolia grassland ecosystem[J]. Journal of Geographical Sciences, 2016, 26(3):297-312.
doi: 10.1007/s11442-016-1269-0
|
| [24] |
奎国娴, 史常青, 杨建英, 等. 内蒙古草原区植被覆盖度时空演变及其驱动力[J]. 应用生态学报, 2023, 34(10):2713-2722.
doi: 10.13287/j.1001-9332.202310.005
|
| [24] |
Kui G X, Shi C Q, Yang J Y, et al. Spatial-temporal variations of vegetation coverage and its driving force in Inner Mongolia grassland,China[J]. Chinese Journal of Applied Ecology, 2023, 34(10):2713-2722.
|
| [25] |
Shi S, Zhu L, Luo Z, et al. Quantitative analysis of the contributions of climatic and anthropogenic factors to the variation in net primary productivity,China[J]. Remote Sensing, 2023, 15(3):789.
|
| [26] |
Terwayet Bayouli O, Zhang W, Terwayet Bayouli H. Assessment of drought characteristics and its impacts on net primary productivity (NPP) in southeastern Tunisia[J]. Arabian Journal of Geosciences, 2022, 16(1):26.
|
| [27] |
刘应帅, 余瑞, 郑彬彬, 等. 海南岛森林植被NEP季节性时空变化规律及气候驱动因素分析[J]. 热带生物学报, 2022, 13(2):166-176.
|
| [27] |
Liu Y S, Yu R, Zheng B B, et al. Analysis of seasonal spatial and temporal variation patterns of forest vegetation NEP and climate drivers in Hainan Island[J]. Journal of Tropical Biology, 2022, 13(2):166-176.
|
| [28] |
Zhang J, Hao X, Hao H, et al. Climate change decreased net ecosystem productivity in the arid region of central Asia[J]. Remote Sensing, 2021, 13(21):4449.
|
| [29] |
Long Y, Jiang F, Deng M, et al. Spatial-temporal changes and dri-ving factors of eco-environmental quality in the Three-North Region of China[J]. Journal of Arid Land, 2023, 15(3):231-252.
|
| [30] |
唐霞, 汤军, 杨勇, 等. 基于LRC的城市发展水平时空演变特征及驱动因素分析——以湖北省为例[J]. 自然资源信息化, 2023(1):55-63.
|
| [30] |
Tang X, Tang J, Yang Y, et al. Analysis on temporal and spatial evolution characteristics and driving factors of urban development level based on LRC:A case of Hubei[J]. Natural Resources Informatization, 2023(1):55-63.
|
| [31] |
Zhang X, Chen L, Zhou C. Deformation monitoring and trend analysis of reservoir bank landslides by combining time-series InSAR and Hurst index[J]. Remote Sensing, 2023, 15(3):619.
|
| [32] |
华朗钦, 张方敏, 翁升恒, 等. 1982—2020年安徽省净生态系统生产力时空格局变化及其成因[J]. 生态学报, 2023, 43(17):7237-7251.
|
| [32] |
Hua L Q, Zhang F M, Weng S H, et al. Spatio-temporal pattern changes and attribution analysis of net ecosystem productivity in Anhui Province from 1982 to 2020[J]. Acta Ecologica Sinica, 2023, 43(17):7237-7251.
|
| [33] |
Bao G, Bao Y, Sanjjava A, et al. NDVI-indicated long-term vegetation dynamics in Mongolia and their response to climate change at biome scale[J]. International Journal of Climatology, 2015, 35(14):4293-4306.
|
| [34] |
Zhou W, Yang H, Zhou L, et al. Dynamics of grassland carbon sequestration and its coupling relation with hydrothermal factor of Inner Mongolia[J]. Ecological Indicators, 2018,95:1-11.
|
| [35] |
曹鹏辉, 齐晓明, 杨雯, 等. 内蒙古土地利用多情景模拟与碳储量预测分析[J]. 干旱区资源与环境, 2023, 37(9):83-90.
|
| [35] |
Cao P H, Qi X M, Yang W, et al. Multi scenario simulation and prediction of carbon storage for land use types in Inner Mongolia[J]. Journal of Arid Land Resources and Environment, 2023, 37(9):83-90.
|
| [36] |
Chen H, Shao L, Zhao M, et al. Grassland conservation programs,vegetation rehabilitation and spatial dependency in Inner Mongolia,China[J]. Land Use Policy, 2017,64:429-439.
|
| [37] |
张祯祺, 蔡惠文, 张平平, 等. 基于GEE遥感云平台的三江源植被碳源/汇时空变化研究[J]. 自然资源遥感, 2023, 35(1):231-242.doi: 10.6046/zrzyyg.2022042.
|
| [37] |
Zhang Z Q, Cai H W, Zhang P P, et al. A GEE-based study on the temporal and spatial variations in the carbon source/sink function of vegetation in the Three-River Headwaters Region[J]. Remote Sensing for Natural Resources, 2023, 35(1):231-242.doi: 10.6046/zrzyyg.2022042.
|
| [38] |
杜家菊, 陈志伟. 使用SPSS线性回归实现通径分析的方法[J]. 生物学通报, 2010, 45(2):4-6.
|
| [38] |
Du J J, Chen Z W. Method of path analysis with SPSS linear regression[J]. Bulletin of Biology, 2010, 45(2):4-6.
|
| [39] |
Chen Z, Yu G, Ge J, et al. Roles of climate,vegetation and soil in regulating the spatial variations in ecosystem carbon dioxide fluxes in the Northern Hemisphere[J]. PLoS One, 2015, 10(4):e0125265.
|
|
Viewed |
|
|
|
Full text
|
|
|
|
|
Abstract
|
|
|
|
|
Cited |
|
|
|
|
| |
Shared |
|
|
|
|
| |
Discussed |
|
|
|
|
 2025,
Vol. 37
2025,
Vol. 37
 ), LIU Yongxin(