

0 引言
土地利用/覆被变化直接受到城市扩张的影响,产业发展、经济建设和能源消耗等都与土地利用紧密相关[1]。城市化进程中伴随着地表土地覆被的巨大变化,建设用地不断扩张,导致生态用地成为最大的损失者,耕地、林地和草地面积减退,在地类转换的过程中,产生了大量的碳排放。世界资源组织研究表明,自1850年到21世纪初,土地利用变化产生的碳排放占人为总碳排放的1/3[2]。中国是世界上二氧化碳排放最多的国家,我国政府提出,力争于2030年前实现碳达峰,2060年前实现碳中和[3]。在这种情况下,通过建模合理调整各种土地类型的面积比例,优化国土空间分布格局,从土地利用的角度寻找低碳和经济相平衡的途径,是保障区域土地合理规划和生态安全的重要问题。
当前关于土地低碳管理的研究大多集中于对未来最小碳排放模式下土地利用数量结构的预测和优化[9],土地的经济效益没有得到充分考虑; 而且侧重于土地类型的数量比例调整,对于空间布局的相关研究有待加强。同一土地利用结构,在不同的空间布局下,可能会产生不同的效果。随着GIS技术的发展,逐渐开发了多种地理模拟模型,元胞自动机模型(cellular automata,CA)[10]、CLUE-S模型[11]、FLUS模型[12]和多智能体模型(agent-based modeling,ABM)[13]等都在土地模拟研究中得到了广泛的应用。其中,FLUS模型引入多层前馈神经网络算法(BP-ANN)计算地类适宜性概率,将各驱动因子统一起来,消除了以往研究通过线性回归方法获取地类转换规则的局限性[14],采用创新的自适应惯性机制以及基于轮盘赌的土地分配机制[15],考虑了多种土地类型转化过程的相互影响,更好地模拟了地类间的竞争,有利于模拟实际情况下用地变化的偶然发生与交替增长。研究表明,FLUS模型对于土地利用模拟的精度要高于CLUE-S模型及传统CA-Markov模型[16]。
在以往利用FLUS模型进行城市未来发展模拟的研究中,大多聚焦于自然地理等静态驱动因子。近年来,有学者尝试对FLUS模型进行优化,张经度等[17]以珠江三角洲地区为例,通过引入空间自相关驱动因子进行了土地演变模拟; 程雨薇[18]利用创新产业因子,对杭州市未来的用地增长进行预测。上述研究虽然在模型优化方面提出了一些新思路,但居民日常活动与土地扩张之间的关系仍没有得到充分考虑,没有纳入兼顾城市动态热点的驱动因子。事实上,购物、饮食住宿和公共服务设施等会影响交通出行和消费活动,人类活动和城市扩张之间有着紧密的联系[19]。地理大数据为此提供了新的解决方法,兴趣点(point of interest,POI)数据可以表征实际地理实体,样本量大、范围广,能够较准确地识别城市功能区分布格局,在城市研究中有着良好的应用前景。综上所述,本文使用POI数据刻画地理实体与居民活动,并将其作为一种驱动因子来改进FLUS模型。考虑到“十四五”是碳达峰的关键期,以及北京市建设生态文明、推动绿色低碳循环发展的要求,耦合理想点法和改进的FLUS模型,寻求有利于低碳经济发展的土地利用结构和空间布局,并设置自然演变情景作为对照组,以期为研究区低碳城市规划体系构建和土地管理规划提供参考。
1 研究区概况及数据源
北京市作为国家第二批低碳试点城市之一,研究区高强度的城市扩张和经济发展,引起土地覆被类型的巨大变化,建设用地迅速扩张,生态环境“超载”的现象仍然存在,是全国碳减排的重点区域和潜力地区。因此,强化城市空间规划和用途管理,协调经济发展和生态保护,对区域未来的土地利用情况进行模拟分析具有重要意义。
表1 数据说明
Tab.1
| 数据类型 | 数据内容 | 数据来源及处理方式 | |
|---|---|---|---|
| 统计数据 | 2011—2021年的相关土地利用数据; 历年能源消耗标准煤数量、各产业产值 | 《北京统计年鉴(2011—2021年)》 | |
| 规划数据 | 耕地红线、生态空间约束等规划信息 | 《北京城市总体规划(2016—2035年)》等相关文件 | |
| 土地利用数据 | 2010年和2020年2期土地利用遥感数据 | 来自GlobeLand30(全球地理信息公共产品),在ArcGIS软件中对原始数据进行镶嵌、裁剪,并将土地类型重分类为耕地、林地、草地、建设用地、水域和其他用地 | |
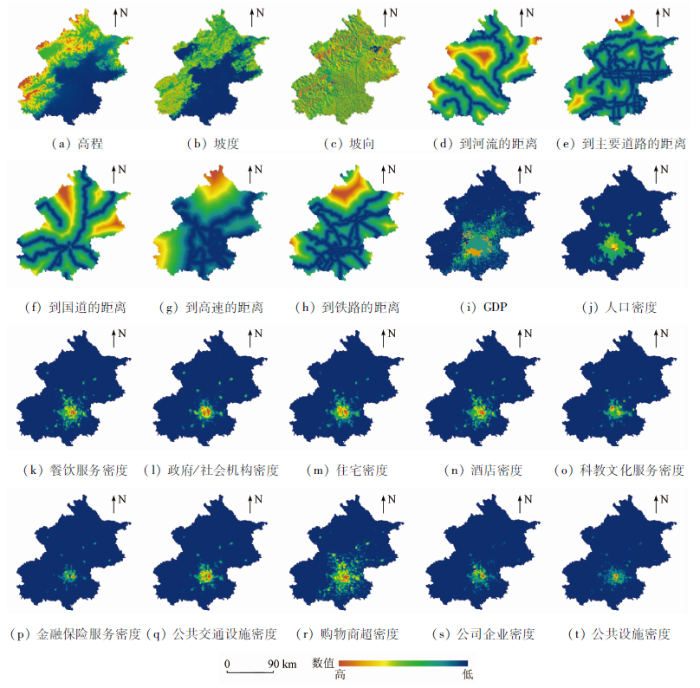
| 驱动因子数据 | 自然地理 | 高程、坡度、坡向 | DEM数据由地理空间数据云平台获得,并在ArcGIS软件中对原始DEM数据进一步处理得到坡度、坡向数据 |
| 交通可达性 | 到河流、主要道路、国道、高速、铁路的距离 | 路网数据来自OSM地图,在ArcGIS软件中采用欧氏距离工具进行处理得到可达性驱动因子 | |
| 社会经济 | GDP、人口密度 | 来源于中国科学院资源环境科学与数据中心,在ArcGIS软件中进行重采样处理 | |
| POI大数据 | 餐饮服务密度、政府/社会机构密度、住宅密度、酒店密度、科教文化服务密度、金融保险服务密度、公共交通设施密度、购物商超密度、公司企业密度、公共设施密度 | 采用北京大学开发研究数据平台于2018年发布的POI数据作为数据源,并于2021年9月通过高德开放平台API接口抓取POI数据作为进一步补充,将其分为10类,使用ArcGIS软件的核密度分析工具对其进行处理 | |
图1
2 研究方法
2.1 不同发展情景设置
以北京市2020年土地利用情况为初始年份数据,以2030年为目标,设置低碳经济情景和自然演变情景2种情景假设。其中,低碳经济情景集成理想点法和改进的FLUS模型进行模拟研究。自然演变情景则参考过往土地演变情况,在保持土地总面积不变的基础上,遵循土地利用的历史发展规律对未来土地利用变化进行模拟,同时将其作为对照组与低碳经济情景进行对比分析。
2.2 不同情景下土地利用数量结构求解
土地需求结构在不同情景下存在差异,并且后续的土地利用演变模拟也需要输入各个土地类型的预测数量。故首先利用MATLAB软件编写程序来求解2种情景下的土地利用数量结构。
在自然演变情景中,土地覆被变化将在未来保持已有趋势,土地需求数量根据2010—2020年的规律变化。Markov方法已被广泛应用于预测该情景下的未来土地类型数量[20],本文将沿用此模型预测研究区2030年土地利用数量结构,其计算公式为:
式中:
在低碳经济情景中,以经济效益最大、碳排放量最小为目标函数,采用理想点法进行多目标求解,并且遵循有关规划文件对目标函数进行约束条件设置,参考规划文件中的耕地保护红线、建设用地规划限制、森林覆盖率、绿地及湿地指标等,确定各类用地的面积约束范围。其计算公式为:
式中:
利用理想点法进行求解,首先将其分解为单目标问题,分别求取
2.3 FLUS模型及其改进机制
GeoSOS—FLUS模型是模拟与预测城市发展空间格局的有效方法[21]。该模型主要包括3部分: ①输入未来目标年份各类用地的数量需求,作为模拟的目标; ②结合初始年份土地利用数据及驱动因子数据,利用BP-ANN算法,求取各个地类的适宜性概率; ③采用基于自适应惯性机制的CA模型,进行未来土地利用空间布局模拟。
2.3.1 基于BP-ANN算法的适宜性概率计算
FLUS模型引入BP-ANN算法计算适宜性概率,主要分为输入层、隐藏层和输出层3部分。以初始年份土地利用数据及驱动因子数据作为输入层; 根据经验[15],本文的隐藏层数量为12; 最后将生成的各栅格土地类型适宜性概率文件作为输出层。其计算公式为:
式中:
2.3.2 基于自适应惯性机制的CA模拟
未来土地类型的转化概率还与邻域影响、惯性系数、转换成本设置及土地类型间的竞争有关。
1)邻域影响包含邻域范围和邻域权重2方面,其基本公式为:
式中:
2)惯性系数是由当前分配的土地数量与目标数量之间的差异决定的,在模型训练中进行自适应调整,使得各用地类型的数量更接近预期目标,其计算公式为:
式中:
3)转换成本代表将目前的土地类型转换为其他土地利用类型的难度,按照不同发展情景的要求进行转换等级设置,转换原则为优先安排低等级向高等级用地转换[22]。
4)结合以上步骤,可以确定各栅格占用土地类型的综合概率,计算公式为:
式中:
最后,根据计算出的综合概率,FLUS模型通过轮盘赌机制,采用CA迭代的方式将土地利用类型分配到每个像元上。模型精度验证一般参考Kappa系数以及总体精度(overall accuracy, OA)这2个指标。通常认为,若Kappa系数大于0.75,则该模拟结果较精准[23]。
2.3.3 基于POI数据分析城市热点
合理的驱动因子在一定程度上影响着模拟的效果。POI数据作为一种社会感知数据,以一种抽象的方式表达了土地系统中的各种地理实体。利用ArcGIS软件中的核密度分析方法,基于POI数据提取城市中心热点区域和兴趣点设施,将其纳入驱动因子体系参与BP-ANN算法训练模块,从而对FLUS模型进行改进。核密度计算公式为:
式中:
2.4 不同情景下土地利用空间模拟转换规则设置
利用FLUS模型进行未来土地演变情景模拟时需要对邻域权重(式(5))进行设置。邻域权重越大,表示该地类扩张能力越强,越难被转移为其他地类。自然演变情景下,根据过往土地利用变化特点,水域不易进行开发建设、建设用地扩张能力最强,故这2种土地类型发生地类转移的难度较大,邻域权重值也相对较大。而耕地、林地、草地和其他用地往往成为被侵占对象,易发生转移,其邻域权重较小。在低碳经济情景中,应当注重碳源用地管治和碳汇空间保护,林地和草地等是主要的碳汇来源,而建设用地和耕地等一般被视为碳源,故增大林地和草地等生态用地的邻域权重提高其转移难度,可以缓解其被过度侵占的趋势。结合已有文献[22],不同情景下的邻域权重如表2所示。另一方面,成本矩阵通过改变不同情景下的用地等级,来表示从当前用地类型转换为需求类型的困难度。基于2010—2020年土地转移矩阵,通过多次对比实验调整参数,设置自然演变情景下建设用地的优先级最高,适当增加耕地和草地等转移为建设用地的概率,满足建设用地需求。而低碳经济情景下生态用地优先级上升,严格控制林地、草地和水域等生态用地转移为建设用地的成本,适当提高退耕还林还草的转移概率。
表2 不同情景下土地邻域权重参数
Tab.2
| 情景 | 耕地 | 林地 | 草地 | 水域 | 建设用地 | 其他用地 |
|---|---|---|---|---|---|---|
| 自然演变情景 | 0.1 | 0.3 | 0.2 | 0.4 | 1.0 | 0.1 |
| 低碳经济情景 | 0.2 | 0.6 | 0.5 | 0.5 | 0.9 | 0.2 |
3 结果与分析
3.1 改进模型精度验证
为证实纳入POI数据的改进FLUS模型在北京市土地利用研究中的适用性,利用研究区2010年数据对其2020年土地利用情况进行模拟。以2020年真实地类数量作为土地需求量,并根据研究区历史土地利用演变规律输入各项参数,设置原模型包括自然因子、交通可达性因子、社会/经济因子共3类驱动因子; 在其他参数不变的情况下,在原模型基础上再纳入10项POI数据作为改进的FLUS模型模拟2020年土地利用情况。然后将上述2种模拟结果分别与2020年实际现状进行对比,分析模型精度变化,结果如表3和图2所示。结合表3及图2可知,改进模型的模拟结果与实际情况更为接近。其中,林地的模拟精度最高。水域次之,改进模型的模拟误差缩小了0.17百分点,主要体现在东北部水域方向上,改进模型的模拟结果更符合实际情况。其他用地由于和驱动因子的联系较弱且占地面积小,模拟误差最大。耕地、草地和建设用地的数量误差相对适中,其空间布局模拟结果与2020年实际情况的主要差异均位于中西部的门头沟区和房山区,由图2(b)可知,建设用地已经扩张到了浅山区,浅山区位于山区与平原的过渡地带,林地与山体较多,原本并不适合大规模开发,但当地通过人为干预,整合采矿用地,提升近山侧的耕地和草地利用效率,增加了建设用地规模。
表3 研究区2020年土地利用模拟结果对比
Tab.3
| 模拟方法 | 耕地 | 林地 | 草地 | 水域 | 建设用地 | 其他用地 | |
|---|---|---|---|---|---|---|---|
| 实际值 | 栅格数/102个 | 1 534.81 | 3 318.37 | 374.77 | 339.07 | 1 563.44 | 162.87 |
| 原模型模拟 | 栅格数/102个 | 1 628.75 | 3 401.98 | 389.41 | 331.09 | 1 421.46 | 120.64 |
| 模拟误差/% | 6.12 | 2.52 | 3.91 | 2.35 | 9.08 | 25.93 | |
| 改进模型模拟 | 栅格数/102个 | 1 625.37 | 3 389.12 | 389.05 | 331.67 | 1 435.72 | 122.40 |
| 模拟误差/% | 5.90 | 2.13 | 3.81 | 2.18 | 8.17 | 24.85 | |
图2
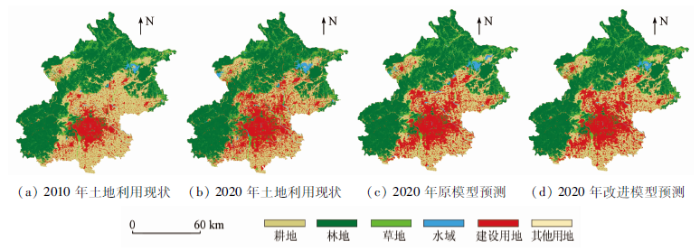
就整体空间布局模拟结果而言,改进FLUS模型模拟结果的Kappa系数和OA分别为0.796 2和87.50%,原模型为0.759 4和84.61%,分别比原模型提高了4.85%和3.42%,而且Kappa系数均大于0.75,满足精度要求。改进的FLUS模型通过纳入POI数据,兼顾了居民的经济及日常活动对建设用地扩张的影响,在驱动因子设置上更加全面,更能体现城市分布格局和发展规律,其模拟结果的空间布局与实际情况更相似。
3.2 2030年土地利用变化情景模拟
3.2.1 不同情景下的土地利用结构分析
以2020年土地利用数据作为基期数据,以2030年为目标年份,设置2种发展情景,利用2.2节中数量结构求解方法,得到2种情景下的土地利用模拟结果如表4所示。
表4 不同情景下的土地利用结构
Tab.4
| 变量 | 名称 | 土地利用现状(2020年) | 情景1(2030年自然演变情景) | 情景2(2030年低碳经济情景) |
|---|---|---|---|---|
| X1 | 耕地/hm2 | 345 331.70 | 323 879.47 | 325 176.40 |
| X2 | 林地/hm2 | 746 634.08 | 747 136.34 | 756 537.52 |
| X3 | 草地/hm2 | 84 323.67 | 82 049.36 | 82 508.40 |
| X4 | 建设用地/hm2 | 351 774.06 | 378 795.06 | 366 955.98 |
| X5 | 水域/hm2 | 76 291.41 | 71 957.61 | 72 504.60 |
| X6 | 其他用地/hm2 | 36 645.08 | 37 183.14 | 37 317.10 |
| F1(x) | 经济效益/万元 | 364 059 651.83 | 391 530 894.60 | 379 492 633.73 |
| F2(x) | 碳排放量/t | 58 541 616.80 | 63 047 593.81 | 61 062 740.35 |
耕地、草地和水域等经济效益较低的用地类型在2种情景下都呈现下降趋势,这是由于历史土地利用变化特点总是优先发展经济,而城市发展所需的建设用地主要通过占用生态用地实现,导致未来城市生态空间持续缩减。此下降程度在自然演变情景中表现得更加明显,3种地类面积分别较2020年减少6.21%,2.70%和5.68%; 在低碳经济情景中下降程度减弱,分别较2020年减少5.84%,2.15%和4.96%。林地在2种情景下都有一定的增长,受到近年来退耕还林政策的影响,北京市的林地面积自2016年至今保持了连续多年的增长状态,故自然演变情景下,保持了这一增长趋势,但低碳情景下林地的增长幅度更大,较自然演变情景增长了1.26%。建设用地在自然演变情景中大幅度扩张,较2020年增长7.68%; 预测碳排放量较2020年增加7.70%,发展经济的同时造成了一定量的生态损失。在低碳经济情景下,建设用地扩张得到遏制,预计比2020年同期增长4.32%。与自然演变情景相比,该情景下的碳排放量减少3.15%,有利于从城市空间规划层面推动降碳减排。该情景下经济效益较自然演变情景略有降低,但与2020年实际相比,经济效益仍上涨了4.24%,保持正向增长趋势。低碳经济导向的优化方案促进碳减排的同时满足了社会经济建设的需求,而且各用地类型的面积变化适中,因此该土地利用优化方案具备一定的合理性。
3.2.2 不同情景下的土地利用空间布局分析
鉴于纳入POI数据对FLUS模型的改进作用以及该模型在北京市的适用性已得到了有效验证,故使用该改进的FLUS模型对北京市2030年土地利用情况进行模拟分析。通过对比2种情景下的土地利用布局优化结果(图3),在发展趋势上,二者大致相同,都表现为沿已有区域向外扩张。但是在空间布局及地类转移方面各有不同的表现。耕地在2种情景下均有所减少,自然演变情景下耕地流失更多,集中表现在房山区东部及大兴区、通州区的东南部地区,大部分转移为建设用地; 而低碳经济情景下东南部侵占耕地的趋势得到遏制,与自然演变情景相比,耕地面积增加了0.40%,东南部耕地资源得以保护。林地在2种情景下都有一定的增长,低碳经济情景下的增长幅度更大,较自然演变情景增长了1.26%,以北部怀柔区和延庆区为例,林地增加更加密集和广泛,表现出成片增长的趋势,更有利于推动林业碳汇发展。水域在2种情景下的差异并不明显,与2020年实际相比都呈现下降趋势,主要是由于水域与建设用地在地理位置上联系紧密,建设用地不断扩张导致水面收缩,低碳经济情景中,水域还在西南部密云区有小幅度发展。草地在自然演变情景下减少了2.70%,以主城区为主,绿色斑块减少,转为建设用地; 在低碳情景下减少了2.15%,流失的草地更多地转化为碳汇能力更强的林地,主要体现在北部怀柔区和密云区一带。从建设用地的空间分布来看,都表现为沿现有布局向东南部扩张的趋势。其中,自然演变情景扩张更为明显,以东南部的大兴区和通州区为例,通过侵占耕地,建设用地面积得到迅速增加。相比之下,低碳经济情景下建设用地减少了3.13%,主要是在现有主城区的基础上发展。此外,自然演变情景下,在门头沟区、房山区和昌平区的浅山区地带,建设用地通过侵占林地和草地进一步扩张,而低碳经济情景下的浅山区建设用地的扩张趋势更小,红色斑块更少,符合《北京市浅山区保护规划》的相关规定。
图3
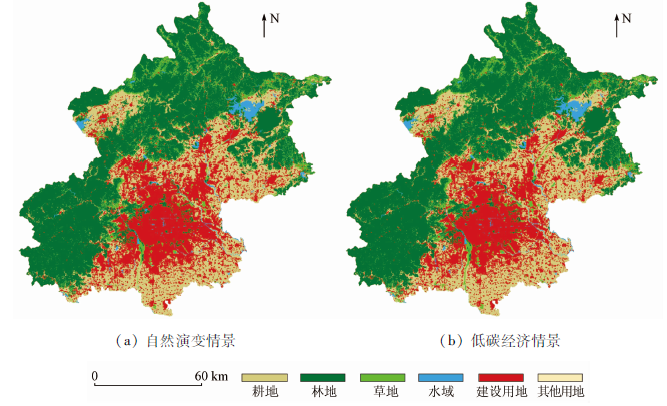
图3
2030年研究区土地利用布局优化模拟结果
Fig.3
Simulation results of land use layout in the study area in 2030
4 结论与讨论
FLUS模型在进行土地利用模拟时通过驱动因子体系来确定未来土地流转的空间位置,以往研究较少考虑到城市热点和人类活动对城市发展的影响,本研究纳入POI数据等作为驱动因子对FLUS模型进行了改进。结果表明,模拟精度得到切实提高,POI数据是进行城市发展规划的有效工具,在进行土地模拟时具备较好的适用性和应用前景,可为城市空间发展与管控提供支撑。北京市以占全国0.17%的国土面积,创造了超过3.6%的GDP,对北京市2030年低碳经济情景下的土地利用优化方案进行求解,与自然演变情景相比,低碳经济情景下的碳排放量减少198.49万t,耕地减退速度放缓,避免耕地、浅山区草地和林地向建设用地的大量转化,林地面积持续增加,有利于增强固碳减碳能力,可为研究区制定科学合理的土地规划提供参考。
在城市土地资源供应趋紧和环境污染日趋严重的双重压力下,从土地利用的角度寻找降低碳排量的方法,同时使土地利用的综合效益达到最优,是保障生态环境的重要问题。在今后的研究中,可以通过以下几个方面进一步完善: ①进一步落实降碳减排,使得分析结果更加精确客观,未来考虑加入生态保护情景,对城市土地时空演变特征进行交叉验证; ②本次研究主要考察了低碳发展和经济建设之间的权衡,但低碳土地利用结构优化还需要兼顾多方面利益,后期研究将考虑在运算中加入生态效益和社会福利等指标,以便更好地构建低碳城市规划体系; ③为了使驱动因子更加全面,提升模拟精度,未来应该进一步引入地质和人文等相关数据,更准确地为城市发展提供建议。
参考文献
The multi-objective spatial optimization of urban land use based on low-carbon city planning
[J].DOI:10.1016/j.ecolind.2021.107540 URL [本文引用: 1]
土地利用变化对区域碳源汇的影响研究进展
[J].
Progress in the study on the impact of land-use change on regional carbon sources and sinks
[J].
中国实现2030年前碳达峰目标及主要途径
[J].
China’s goal of achieving carbon peak by 2030 and its main approaches
[J].
Optimization of land-use structure based on the trade-off between carbon emission targets and economic development in Shenzhen,China
[J].
DOI:10.3390/su11010001
URL
[本文引用: 1]

Urban agglomeration, an established urban spatial pattern, contributes to the spatial association and dependence of city-level CO2 emission distribution while boosting regional economic growth. Exploring this spatial association and dependence is conducive to the implementation of effective and coordinated policies for regional level CO2 reduction. This study calculated CO2 emissions from 2005–2016 in the Chengdu-Chongqing urban agglomeration with the IPAT model, and empirically explored the spatial structure pattern and association effect of CO2 across the area leveraged by the social network analysis. The findings revealed the following: (1) The spatial structure of CO2 emission in the area is a complex network pattern, and in the sample period, the CO2 emission association relations increased steadily and the network stabilization remains strengthened; (2) the centrality of the cities in this area can be categorized into three classes: Chengdu and Chongqing are defined as the first class, the second class covers Deyang, Mianyang, Yibin, and Nanchong, and the third class includes Zigong, Suining, Meishan, and Guangan—the number of cities in this class is on the rise; (3) the network is divided into four subgroups: the area around Chengdu, south Sichuan, northeast Sichuan, and west Chongqing where the spillover effect of CO2 is greatest; and (4) the higher density of the global network of CO2 emission considerably reduces regional emission intensity and narrows the differences among regions. Individual networks with higher centrality are also found to have lower emission intensity.
雄安新区对京津冀城市群低碳协同发展促进作用预评估
[J].
Pre-evaluation of the role of Xiongan New District in the low carbon synergy development of Beijing-Tianjin-Hebei urban agglomeration
[J].
基于CLUE-S模型的不同情景下区域土地利用布局优化
[J].
Land use layout optimization under different scenarios by using the CLUE-S model
[J].
基于改进型NSGA-Ⅱ算法的西宁市土地利用多目标优化
[J].
Multi-objective optimization of land use in Xining City based on improve NSGA-Ⅱ
[J].
Optimization of the spatial pattern of land use in mountain towns: A case study of Yuexi County,Anqing City,Anhui Province
[J].
DOI:10.1088/1755-1315/569/1/012085
[本文引用: 1]
There are a lot of unused land and land type distribution problems in the land use layout of mountain towns. Mountainous area is widely distributed in China. In the past, scholars focused on the big cities in the planning of land use layout, but paid little attention to the towns in mountainous area.This paper takes Yuexi county, Anqing city, Anhui province as the research area, and based on the principle of multi-objective particle swarm optimization. Firstly, the current land use map was pretreated with unused land and aggregation. The unused land was converted into a high-grade land type according to the suitability map. The aggregation processing increases the aggregation of a certain land type in the eight neighboring areas. Then, the multi-objective function is combined with the particle swarm optimization(PSO) algorithm, and the PSO algorithm is used to update the iterative operation, and the optimal layout scheme is selected. Finally, from the area changes before and after the optimization, economic, ecological benefits and spatial layout of the evaluation. The results showed that the optimized economic and ecological benefits were 9092.7397 million yuan and 40.09377 million yuan higher than the original, respectively. Moreover, after the optimization, the landscape fragmentation index of the original layout was improved by 0.019930486 per hectare compared with that of the original, and the aggregation was greatly improved in space, so the research has corresponding value.
以低碳为目标的海东市土地利用结构优化方案
[J].以低碳为目标的土地利用结构优化对区域和全球的碳循环具有重要意义。该文以海东市为例探讨了青海高原东部农业区低碳导向的土地利用结构优化方案。首先计算了海东市主要土地利用类型的碳密度和碳排放系数,然后以最大化碳储量和最小化碳排放量作为目标函数,运用线性规划方法构建了土地利用结构优化模型,获得了土地利用结构优化方案。通过与土地规划方案的对比发现,基于碳储量最大化的优化方案最佳。在该方案下,到2020年海东碳储量达14 171.68万t,碳排放量为217.65万t,比规划方案的碳储量增加了7.77万t,同时减少了31.98万t的碳排放,可见以增加碳储量和减少碳排放为目的的优化方案,对区域固碳作用明显。该结论能为相关部门进行土地利用规划及其调整提供了有效支持。
Optimization of land use structure for low-carbon targets in Haidong City,Qinghai Plateau
[J].Optimizing land use structure for low-carbon targets is important to regional and global carbon cycle research. Here,we investigated low-carbon oriented land use structure optimization for Haidong in Qinghai,China,located in the eastern part of the Qinghai Plateau. Carbon storage and carbon emission factors for each land use type in Haidong were calculated based on local carbon mechanisms. Methods for calculating carbon storage and carbon emission estimation have been established systematically. Land use quantitative structure optimization models aimed at maximum carbon storage and minimum carbon emissions were constructed using linear programming methods. Two optimized schemes were obtained using land use quantitative structure optimization models. By comparing land use planning schemes with that of carbon storage maximizing and carbon emission minimizing we found that although the carbon emission minimizing scheme in Haidong is capable of bringing carbon emissions to the lowest level in 2020,the corresponding carbon accumulation is much less than that of the land use planning scheme. The carbon storage maximizing scheme can increase carbon storage in Haidong to 141.71×10⁶t in 2020,which is 77.7×10³t higher than the land use planning scheme. However,this maximizing scheme can decrease carbon emissions to 2.17×10⁶t,which is 319.8×10³t lower than for land use planning. In comparing the land use programming scheme,the main advantages of the carbon storage maximizing scheme would be that it increases the rate of increasing forestry and dampens the expansion rate of construction land. Therefore,low-carbon oriented land use structure optimization is good support for government land use planning and adjustment.
Cellular automata for simulating land-use change with a constrained irregular space representation:A case study in Nanjing City,China
[J].
DOI:10.1177/2399808320949889
URL
[本文引用: 1]
Traditional cell-based cellular automata (CA) models use a regular cellular grid to represent geographic space, and new approaches to CA models have explored the use of a vector representation of space instead of a regular grid to characterize urban space more realistically. However, less attention has been paid to modeling the interaction between the geospatial information and the irregular cells. To date, the majority of spatial boundaries have been created by individual agencies in an uncoordinated manner. As a consequence, the potential uses of the data collected for land-use change models are limited. In this paper, we propose a new vector-based CA model based on a new constrained irregular space representation using the theory of hierarchical spatial reasoning. For dividing the geographic space considering different items, first land patches are considered as the minimum division unit; then aggregation rules, including attribute, geometric and boundary barrier constraints, are defined; and finally different levels of spatial units are formed through land patches based on aggregation rules. The proposed model is used to simulate the land-use changes in Nanjing, Jiangsu Province, China. The performance validation and comparison illustrate the feasibility of the proposed space representation in a CA model. By using this model, it is expected that the use of the real spatial boundaries that are employed in urban planning could help provide a flexible paradigm to consider various drivers or constraints for realistically simulating land-use changes.
Combining system dynamic model and CLUE-S model to improve land use scenario analyses at regional scale:A case study of Sangong watershed in Xinjiang,China
[J].DOI:10.1016/j.ecocom.2010.02.001 URL [本文引用: 1]
纳入动态数据的改进FLUS模型在城市增长边界划定中的应用
[J].
DOI:10.12082/dqxxkx.2020.200373
[本文引用: 1]
城市增长边界是管控城市建设用地无序扩张的有效手段,科学合理划定城市增长边界是当前研究关注的重要课题。本研究试图引入百度动态交通时间和POI数据改进FLUS模型,以长沙市中心城区为例,采用2000、2010和2018年3期土地利用数据对比验证改进FLUS模型模拟精度,并利用改进FLUS模型设置2种情景,模拟2030年长沙市中心城区土地利用变化,结合用地适宜性评价划定城市增长边界。结果显示:① 纳入动态数据的改进FLUS模型模拟2010年和2018年土地利用相比原模型KAPPA系数提高了2.90%和2.74%,总体精度提高了1.79%和1.83%,表明改进模型具有更高模拟精度;② 利用改进FLUS模型模拟的2030年长沙市中心城区土地利用变化,基准情景和生态保护情景建设用地规模分别为930.06 km<sup>2</sup>和881.36 km<sup>2</sup>,均以耕地转为建设用地比例最大;③ 长沙市中心城区刚性增长边界范围为1479.59 km<sup>2</sup>,占中心城区总面积的37.38%,边界内包含了芙蓉区、天心区、雨花区、岳麓区和开福区的大部分区域;④ 基准情景和生态保护情景下,长沙市中心城区弹性增长边界面积分别为799.35 km<sup>2</sup>和742.92 km<sup>2</sup>,建设用地扩张空间主要为长沙县和望城区,结果与2010版长沙市城市总体规划拓展方向一致。纳入动态数据的改进FLUS模型多情景模拟划定城市增长边界,能更高精度的为规划决策提供科学依据。
Delimitation of urban growth boundary based on improved FLUS model considering dynamic data
[J].
基于多智能体和土地转换模型的耕地撂荒模拟研究——以陕西省米脂县为例
[J].
DOI:10.11849/zrzyxb.20170040
[本文引用: 1]
多模型耦合已经成为国内外模拟LUCC有效途径之一。论文通过如下步骤阐明宏观耕地撂荒格局和微观主体行为间的互动机理。首先,将微观主体间的相互作用纳入其决策,构建有限理性多智能体决策模型(Multi-Agent System,MAS);其次,通过SNNS平台的训练学习以及与历史数据对比分析,验证土地转换模型(Land Transformation Model,LTM)模拟研究区宏观撂荒格局的有效性;最后,依据多模型耦合机理,耦合MAS模型与LTM模型,形成耕地撂荒模拟模型(Cropland Abandonment Simulation Model,CASM),并基于研究区耕地撂荒的实际数据,探讨模型的合理性和可行性。结果表明:与2013年历史土地利用数据对比,CASM模型的PCM(Percent Correct Metric)系数为71%,比单独利用LTM模型的模拟精度提高3%,不仅表明CASM能够较好地模拟分析米脂县耕地撂荒空间格局分布,而且可有效揭示宏观耕地撂荒格局的微观驱动机理;同时,文章指出未来研究中要考虑政策和市场的影响,进一步完善不同层次主体决策对撂荒的影响,以此来提高模型对现实耕地撂荒的解释力。
The simulation of cropland abandonment based on multi-agent system and land transformation model:A case study of Mizhi County,Shaanxi Province
[J].
A future land use simulation model (FLUS) for simulating multiple land use scenarios by coupling human and natural effects
[J].DOI:10.1016/j.landurbplan.2017.09.019 URL [本文引用: 1]
基于FLUS模型的汾河流域生态空间多情景模拟预测
[J].
Multi-scenario simulation prediction of ecological space in Fenhe River basin based on FLUS model
[J].
耦合MOP与GeoSOS-FLUS模型的县级土地利用结构与布局复合优化
[J].
DOI:10.31497/zrzyxb.20190604
[本文引用: 1]
在自然资源整合不断加强,土地利用结构日趋复杂的形势下,采用单一土地利用结构优化方式难以有效满足区域土地利用合理规划的需求。综合考虑生态文明、乡村振兴、城乡融合等土地可持续利用目标,构建土地利用结构优化与布局优化的集成体系,对提升规划适用性具有积极作用。选取常州市金坛区为研究区,以经济效益与生态效益为优化目标,设置自然演变、经济优先和生态优先三种发展情景,在通过MOP(多目标规划)模型进行土地利用结构优化的基础上,利用GeoSOS-FLUS模型实现土地利用布局优化。结果表明:通过集成MOP和GeoSOS-FLUS模型,采用”结构+约束+布局+准则“研究模式探索县域单元下的土地利用结构布局优化,对调整土地利用结构,优化土地利用空间布局有一定帮助。从案例分析结果看,城镇工矿用地数量在自然演变和经济效益优先情景下分别增加了39%和95%;林地在生态效益优先情景下增加了40%;农村居民点在三种情景下分别减少33%、66%和66%。在三种发展情景下,空间格局都将面临城镇空间与生态空间两级分化的现象,后期区域发展中应加强城乡土地利用与生态保护协调发展,促进空间布局均衡化。
Coupled MOP and GeoSOS-FLUS models research on optimization of land use structure and layout in Jintan District
[J].
DOI:10.31497/zrzyxb.20190604
[本文引用: 1]
Faced with the background of natural resources integration and the more complex land use structure, it is difficult to effectively meet the demand for rational land use planning with a single land use structure optimization method. Considering the objectives of sustainable utilization of land use, ecological civilization, rural development, and urban-rural integration, we constructed an integrated system for land use structure and layout optimization, which will play a positive role in improving the applicability of planning. This study first sets three scenarios of natural evolution, economic priority, and ecological priority, and then uses the MOP model (multi-objective planning model) to calculate the optimal land use structure under different scenarios. Finally, it can carry on land use layout optimization based on the GeoSOS-FLUS model in 2030, Jintan district, Jiangsu province, China. Results show that, by integrating the MOP and GeoSOS-FLUS models and adopting the "Structure + Constraint + Layout + Criterion" approach to optimize the land use structure and layout in the county, it is conducive to optimize the quantitative land use structure and improve the land use spatial distribution; from the results of the case analysis, the area of industrial and mining land in cities and towns has increased by 39% and 95% under the natural evolution and economic efficiency priority scenarios; the forest land has increased by 40% under the eco-efficiency priority scenario; rural settlements decreased by 33%, 66% and 66%, respectively in the three scenarios. Under the three development scenarios, the spatial pattern will face the two-level differentiation of urban space and ecological space. In the later period of regional development, it is necessary to strengthen the coordinated development of urban and rural land use and ecological protection, and promote a balanced spatial distribution.
纳入空间自相关的FLUS模型在土地利用变化多情景模拟中的应用
[J].
DOI:10.12082/dqxxkx.2020.190359
[本文引用: 1]
FLUS模型是一种新型的土地利用变化模拟模型,应用前景广阔。本文通过在FLUS模型的人工神经网络(Artificial Neural Network,ANN)训练模块中引入空间自相关因子来改进模型,以珠江三角洲地区为例,基于2009年、2015年土地利用数据和一系列驱动因子对改进的模型进行了验证,并利用该改进的FLUS模型模拟了2035年研究区在3种情景下土地利用变化格局。结果表明:① 引入空间自相关因子后各地类发生概率分布的预测精度更高,耕地、林地、建设用地、水体和未利用土地的拟合优度ROC值分别从0.819、0.928、0.885、0.855和0.861提高到0.857、0.934、0.890、0.863和0.978;② 改进的FLUS模型的模拟精度有一定的提高,Kappa系数从0.732提高到0.744,FOM系数从0.077升到0.106;③ 情景模拟表明,3种情景下珠江三角洲建设用地和林地均将增加、而耕地均呈减少趋势。但不同情景下模拟的土地利用格局也存在显著差异: 基准情景下,建设用地明显扩张且大幅侵占耕地。耕地保护情景下,耕地面积保持在合理水平,建设用地蔓延扩张趋势得到遏制,土地利用布局总体趋向合理。生态保护情景下,耕地、林地和水体得到较好保护,建设用地布局更为合理,土地利用可持续性明显提高。
Simulating multiple land use scenarios based on the FLUS model considering spatial autocorrelation
[J].
Analyzing urban spatial patterns and functional zones using Sina Weibo POI Data:A case study of Beijing
[J].
DOI:10.3390/su13010001
URL
[本文引用: 1]
Firms must adapt to a business environment in constant flux. Economic and political factors and the constant interruption of new technologies force firms and organizations to change and to adapt, so that they are not left behind. Over recent years, the development of disruptive innovations has completely revolutionized past scenarios. These innovations break with what is already established and firms from various sectors face no choice other than to incorporate them into their project management portfolios, so as to ensure survival and business sustainability. Using MIVES methodology as its foundation, a business sustainability management model is presented in this paper for the management of disruptive innovation projects that a firm may wish to develop within a given sector. The management model is designed to facilitate disruptive innovation project management for firms within technological-industrial sectors, by assessing the sustainability of the project. The model is applied to two firms, one from the machine-tooling sector and another from the construction sector. Finally, a sensitivity analysis was performed, the results of which verified the validity and the stability of the proposed model.
基于多准则CA-Markov模型的城市景观格局演变与预测——以上杭县城区为例
[J].
Urban landscape pattern evolution and prediction based on multi-criteria CA-Markov model: Take Shanghang County as an example
[J].
基于FLUS-InVEST模型的中国未来土地利用变化及其对碳储量影响的模拟
[J].
Simulating the change of terrestrial carbon storage in China based on the FLUS-InVEST model
[J].
DOI:10.13284/j.cnki.rddl.003138
[本文引用: 1]
The dynamics of terrestrial carbon are a key factor driving climate change and are greatly influenced by terrestrial processes. Land-use changes as a specific terrestrial process extensively influence terrestrial carbon storage through the alteration of biomass and soil organic matters. However, the direct effect of future land-use changes on terrestrial carbon storage is limited by the refinement of future land-use simulation. In this paper, we propose a FLUS-InVEST (future land use simulation-Integrate valuation of ecosystem services and trade-offs) model to assess the impact of projected land-use change on terrestrial carbon storage in China. The FLUS-InVEST model is composed of fine land-use projection and terrestrial carbon change detecting. Based on the representative showed that: 1) the area with deceased carbon storage shifts from North China to Northeast and the area with increased concentration pathways (RCPs) scenarios, we projected a future land-use change with 30 m resolution for 2100 in China and simulated the changing in terrestrial carbon storage. The FLUS results had a Kappa value of 0.74 and an overall accuracy with 0.80, which indicated that the FLUS performed well in fine land-use projection on a national scale. In addition, carbon storage shifted from Northwest to Southwest between 1995 and 2010. 2) In the RCPs scenario, carbon storage in the forests continues to increase, but decreased in grassland. Specifically, the carbon storage in ?he forest was predicted to increase by 2 332.64 Tg (1 Tg = 1012 g) and 1 754.59 Tg in RCP 6.0 and RCP 8.5, respectively. The carbon storage in grassland was predicted to decrease by 1 719.03 Tg and 2 468.80 Tg in RCP 6.0 and RCP 8.5, respectively. 3) In RCP 6.0, the carbon stored in aboveground vegetation and soil was projected to increase by 127.12 and 83.67 Tg. Conversely, the carbon stored in RCP 8.5 was projected to decrease by 24.67 Tg and 32.41 Tg in aboveground vegetation and soil, respectively, which indicated that RCP 6.0 contributes more to the future carbon sink than RCP 8.5. 4) In the RCPs scenario, the area with increased carbon was mainly located in lines of Hengduan-Qinling-Taihang-Great Khingan and Xufeng-Taihang-Great Khingant, and the area with decreased carbon was distributed throughout the Yunnan-Guizhou Plateau, Sichuan Basin, and Beijing-Tianjing-Hebei Region.
基于FLUS模型的湖北省生态空间多情景模拟预测
[J].
DOI:10.31497/zrzyxb.20200119
[本文引用: 3]
改革开放以来,中国经济在飞速发展的同时,生态环境问题日益严峻。为保障国家和地区的生态安全,对未来生态空间进行模拟预测十分必要。在长江大保护和长江经济带绿色发展背景下,以湖北省为研究区,利用FLUS模型基于湖北省2010年、2015年土地利用数据及包含自然和人文因素的15种驱动因子数据,对2035年的湖北省生态空间进行模拟预测。结果表明:利用2010年土地利用现状模拟出的2015年湖北省土地利用变化情况,总体精度达到0.976,Kappa系数达到0.961,模拟精度较高。设置的生产空间优先、生活空间优先、生态空间优先以及综合空间优化4种不同情景,基本满足未来湖北省不同发展导向的需求。从地貌单元角度来看,在不同情景下,湖北省生态空间主要分布于湖北省边陲四大山区,中部江汉平原生态空间零星分布。从数量规模上来看,不同情景下各个用地类型数量规模差异较为明显,生产空间优先情景下耕地面积增加1216 km<sup>2</sup>,生活空间优先情景下城镇用地规模增加5959 km<sup>2</sup>,生态空间优先情景下生态空间用地增长722 km<sup>2</sup>,综合空间优化情景下生态空间用地规模变化更趋于平缓。从生态空间变化分布来看,四大山区的生态空间变化不大,但中部江汉平原生态空间变化较为明显,其中从行政区划上来看,变化范围主要分布于武汉城市圈、襄阳市、宜昌市中西部地区及随州市中部地区。总而言之,FLUS模型对于湖北省生态空间模拟的适用性较好,多情景模拟结果可为湖北省未来国土空间规划及未来生态空间管控提供多角度、多方向的政策决策参考。
Multi-scenario simulation and prediction of ecological space in Hubei Province based on FLUS model
[J].
DOI:10.31497/zrzyxb.20200119
[本文引用: 3]
Since reform and opening up in 1978, with the rapid development of China's economy, the problem of ecological environment has become increasingly serious. In order to ensure the ecological security of the countries and regions, it is necessary to simulate and predict the future ecological space. Under the background of the Yangtze River protection strategy and the green development of the Yangtze River Economic Belt, this paper takes Hubei province as the research area. Based on the data of land use in 2010 and 2015 and the data of 15 driving factors including natural and human factors, the FLUS model was used to simulate and predict the ecological space of Hubei province in 2035. Based on the current situation of land use in 2010, the results show that the overall accuracy of land use change in Hubei in 2015 is 0.976, and the Kappa coefficient is 0.961, which are of high accuracy. The four scenarios of production space priority, living space priority, ecological space priority and comprehensive space optimization basically meet the needs of different development orientations in this province in the future. From the perspective of geomorphic unit, under different scenarios, the ecological space of Hubei is mainly distributed in the four major mountainous areas on the border of Hubei province, and the ecological space in the central Jianghan Plain is scattered. In terms of quantity scale, the difference in the size and scale of each land use type in different scenarios is more obvious. The area of cultivated land increased by 1216 km2 under the priority of production space, and the scale of urban land use increased by 5959 km2 under the priority of living space. The ecological space used in the ecological space priority scenario increased by 722 km2, while that used in the integrated space optimization scenario became moderate. From the distribution of ecological space change, the ecological space of the four mountainous areas has not changed much, but the ecological space of the central Jianghan Plain is more obvious. From the perspective of administrative divisions, the scope of change is mainly distributed in Wuhan City Circle, Xiangyang city, the central-west of Yichang city and the central part of Suizhou city. All in all, the FLUS model has good applicability to the ecological spatial simulation in Hubei. The results of multi-scenario simulation can provide a multi-angle and multi-directional policy decision reference for the future territorial spatial planning and ecological spatial control in this province.
Delineating multi-scenario urban growth boundaries with a CA-based FLUS model and morphological method
[J].DOI:10.1016/j.landurbplan.2018.04.016 URL [本文引用: 1]
