

0 引言
自改革开放以来,中国正经历着史无前例的快速城市化过程[1-2],城市化率由1978年的17.9%增长到2019年的60.6%,与此同时,快速城市化过程也带来诸如交通拥堵[3]、环境恶化[4]、住房紧缺[5]等城市问题。为实现城市的健康可持续发展,中国主要城市相继出台相应规划政策以发展多中心城市空间结构[6-7],但中国城市多中心空间结构的发展情况仍缺乏全面系统的研究[8]。因此,准确地识别城市多中心既是目前城市问题研究的重要内容,也在规划评估等方面具有重要的现实意义。城市多中心识别受数据可得性的限制较为严重[8-9],现有识别方法也多基于就业、人口等统计数据[10⇓-12],但统计数据周期较长、获取难度较大,使得大空间范围、长时间序列城市多中心识别研究受到限制; 现有中国城市多中心识别研究的空间单元以街道(乡镇)行政区划为主,街道(乡镇)行政区划面积及空间分异较大,不仅会影响人口/就业密度的计算[13],同时街道(乡镇)行政区划内部细节特征被忽略[9,11-12],这很大程度限制了统计数据在城市多中心识别研究中的应用。
随着大数据时代的到来,手机信令、社交媒体签到、兴趣点(point of interest,POI)等地理大数据以其能反映人类活动的特征,为城市多中心识别研究提供了新的数据选择[8-9,14⇓⇓-17]。与传统的统计数据相比,地理大数据具有精度高、覆盖面广、更新快、数据量大等优点,能够弥补传统数据周期长且难以获取等缺点,但其空间分布不稳定且具有严重的空间变异性[9]。与基于传统统计数据的城市多中心识别研究相比,基于地理大数据的城市多中心识别研究案例相对较少,研究中使用的方法多为阈值法或空间统计法[9,18],且相关研究中空间单元多为规则格网[9,14,17]。因此,如何为地理空间大数据提供稳定的空间单元是城市多中心识别研究的重要议题。NPP-VIIRS夜间灯光数据在社会经济指标估算和城市化等研究中取得了广泛应用。受道路、机场、港口、工业园等内部灯光的影响,NPP-VIIRS数据不能准确表征城市内部经济指标与人类活动,但数据较高的空间稳定性使其在描述城市景观格局与基础设施分布方面表现出更大的潜力[8]。部分学者使用NPP-VIIRS夜间灯光数据对城市内部区域进行区块分割,进而用于城市多中心识别研究。Cai等[9]使用多主体的面向对象分割算法框架对夜间灯光数据进行分割; Lou等[8]使用eCognition软件中的多尺度分割算法对夜间灯光数据进行分割。然而,现有2种算法较为复杂,且算法中参数的设定对2种区域分割算法结果影响较大,这些特点使得面向对象分割算法框架的应用受到限制。
本文提出了一种新的基于夜间灯光数据与地理大数据的城市多中心识别方法框架,首先使用分水岭分割算法对NPP-VIIRS夜间灯光数据进行区域分割,获取城市多中心识别研究的基本空间单元; 其次使用微博签到数据表征城市内部人类活动,使用两阶段方法识别城市中心进而分析城市空间结构特征; 最后以北京、上海、重庆为例,验证本文提出的城市中心识别框架的可靠性。本研究拓展了基于地理空间大数据的城市空间结构研究思路与方法,对中国城市多中心空间结构发展分析和规划评估等具有较强参考价值。
1 研究区概况与数据源
1.1 研究区概况
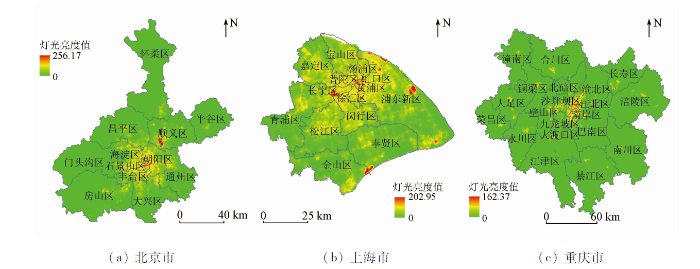
本文选取2015年北京、上海、重庆3个特大城市的市辖区作为研究区,研究区范围如图1所示。为保证研究区的连续性,上海市崇明区,重庆市万州区、黔江区不作为本文的研究区,2015年11月北京市密云县和延庆县撤县设区,故本研究不将其纳入研究范围。北京、上海作为中国最著名的2个超大型城市,其城市空间结构实证研究案例较多,可与本文研究成果进行对比分析; 3个城市在地理区位与地形条件方面存在差异,可用于验证本文研究方法的可靠性。
图1
1.2 数据源及其预处理
1)NPP-VIIRS夜间灯光数据。NPP-VIIRS夜间灯光数据来源于美国国家海洋和大气管理局(
2 研究方法
2.1 基于分水岭的区域分割算法
城市内部空间单元的缺失使得基于人类活动点数据的城市多中心识别研究受到限制,为实现基于地理大数据的城市多中心识别,必须获取城市内部稳定的空间单元。与DMSP-OLS夜间灯光数据相比,NPP-VIIRS夜间灯光数据不受灯光饱和效应的影响,能够很好地区分城市内部精细尺度上的空间差异[20]。如图2所示,NPP-VIIRS夜间灯光数据在区域尺度上显示出基本的空间分布特征,灯光强度较大的区域形成了类似地形中的“山峰”,而“山峰”之间的灯光强度低值形成了类似于地形中的“山谷”。每个“山峰”的顶点可认为是灯光强度的热点,热点在城市区域中表现出较大的空间差异,热点区根据灯光强度最大值点及影响范围可对城市区域范围进行像元尺度分割。因此,基于灯光影像的区域分割过程转换为求灯光热点及其影响范围的过程。
图2
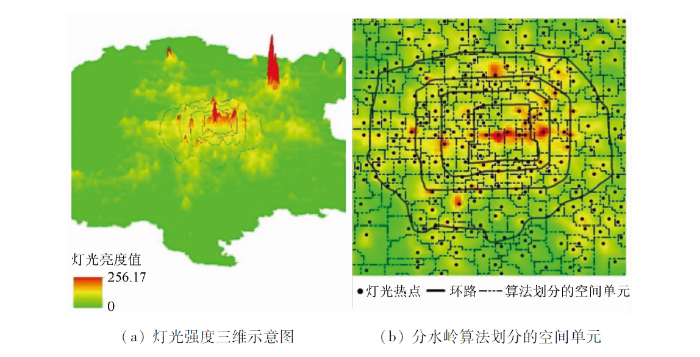
本文使用基于分水岭的区域分割算法对NPP-VIIRS灯光影像进行分割,分水岭算法是一种基于拓扑的形态分割算法,算法将图像视为拓扑地貌,获取局部极小值及其影响区域(集水盆)的分界线[20]。利用MATLAB软件中内置的分水岭算法对图像进行处理,在算法过程中,将灯光强度视为海拔高度,为使输入的影像符合分水岭算法的要求,需对灯光影像进行变换。公式为:
式中:
2.2 两阶段城市多中心识别
识别城市多中心是城市空间结构研究的重要环节[21]。城市中心一般包含2方面特征: ①中心内部要素(就业和人口等活动)密度显著高于周边区域; ②城市中心范围内要素总量足够大使其对周边区域具有一定影响。常用的识别方法主要包含阈值法[22]、空间聚类模型[23⇓⇓-26]、参数模型[27]、非参数模型法[28-29],其中,阈值法最为简便,但阈值的设定依赖于研究者对研究区的先验知识[11,28,30]; 空间聚类模型、参数模型与非参数模型不依赖先验知识,但空间聚类模型多用于格网数据[9],难以识别郊区的中心[31]; 参数模型假设城市以主中心为原点对称分布,与真实的城市发展不符[32]; 非参数模型可以更好地拟合城市密度曲面,识别出中心城区及郊区的次中心[13,33],但方法操作较为复杂。本文参考Lee[34]的研究,对原始的非参数模型方法进行改进,采用两阶段方法识别城市中心。
第一阶段,在计算每个空间单元微博签到密度的基础上,将点密度的平方根表示为其与空间单元中心坐标的关系,即
式中:
式中
3 结果与分析
3.1 区域分割算法结果
图3
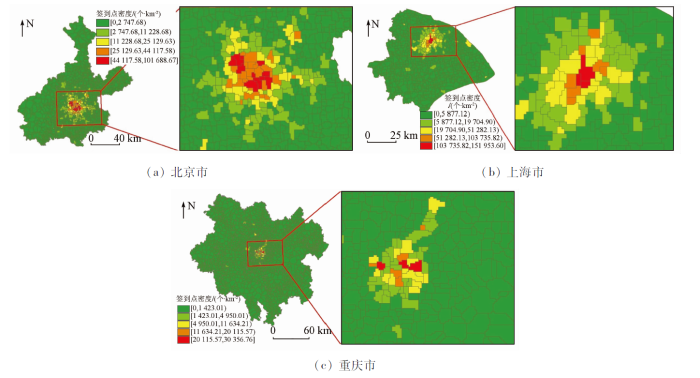
图3
基于分水岭的区域分割算法结果
Fig.3
Spatial divisions partitioned by the watershed-based partition approach
表1 城市空间单元统计
Tab.1
| 指标 | 统计值 | 北京市 | 上海市 | 重庆市 |
|---|---|---|---|---|
| 研究区面积/km2 | 总和 | 12 186.12 | 5 448.06 | 28 657.55 |
| 数量/个 | 总和 | 1 192 | 775 | 1 706 |
| 空间单元面积/km2 | 最大值 | 98.25 | 38.00 | 124.13 |
| 平均值 | 10.22 | 7.03 | 16.80 | |
| 标准差 | 10.45 | 4.87 | 14.67 | |
| 微博签到点数量/个 | 总和 | 20 789 250 | 16 755 584 | 3 210 651 |
| 平均值 | 17 440.65 | 21 620.11 | 1 881.98 | |
| n% | 45 595.23 | 40 933.59 | 17 918.29 | |
| 微博签到 点密度/ (个·km-2) | 最大值 | 101 688.70 | 151 953.60 | 30 356.67 |
| 平均值 | 2 420.88 | 3 750.26 | 1 767.62 |
北京、上海、重庆分别有1 192个、775个、1 706个空间单元,空间单元平均面积分别为10.22 km2,7.03 km2,16.80 km2,空间单元数量与研究区面积呈现正相关关系,且郊区空间单元一般大于城市中心空间单元。对比3个城市空间单元来看,重庆市空间单元面积的平均值、最大值及标准差最大,北京市次之,上海市最小。上海市地处长三角平原,经济发展水平最高,因此其内部空间单元面积差异最小; 重庆市地形以山地丘陵为主,灯光分布较为分散,部分山地地区灯光基本为0,因此郊区空间单元面积最大值为124.13 km2,远大于中心城区,各个空间单元面积差异最大; 北京市介乎两者之间,空间单元平均大小与差异位于中间。从3个城市各空间单元微博签到点数量及密度来看,上海市微博签到点数量最大,平均密度最大,北京次之,重庆最低,从点密度的空间分布来看,3个城市显示出不同的内部空间结构特征。
3.2 城市多中心识别结果
使用两阶段的城市多中心识别算法,基于空间单元微博签到点密度数据识别3个城市的多中心,识别结果如图4和表2所示。北京、上海、重庆表现出多中心的城市空间结构,其内部的中心数量分别为17,11,12。其中,北京市17个城市中心微博签到点数量约占全市的83.78%,主中心面积为524 km2,其内部微博签到点数量为15 033 714,占全部中心内签到点数量的86.31%; 上海市11个城市中心微博签到点数量约占全市的86.26%,主中心面积为498 km2,其内部微博签到点数量占全部中心签到点数量的86.79%; 重庆市12个城市中心微博签到点数量约占全市的91.30%,主中心面积为421 km2,其内部微博签到点占全部中心签到点数量的80.08%。从3个城市中心的空间分布情况来看,北京市的次中心主要集中在近郊区,部分远郊区的新城新区中心也可识别为次中心; 上海市的次中心空间分布上距离城市主中心较远; 重庆市受内部山地地形的影响,次中心分布更为分散。从3个城市内部签到点数量来看,城市内部的活动主要集聚在城市中心,其中主中心集聚了绝大部分的人类活动,在城市空间结构中发挥着重要作用; 城市内部存在着相当数量的次中心,但次中心内人类活动相对于主中心较少,次中心的发育程度较弱,城市仍表现为强主中心的多中心空间结构。
图4
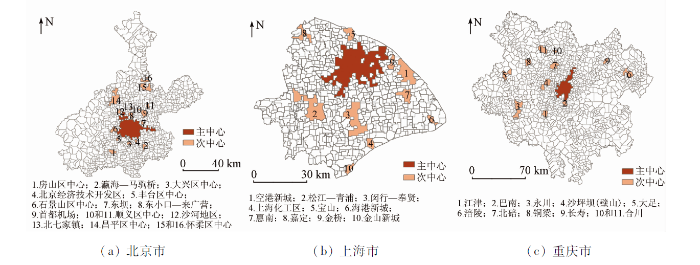
图4
两阶段法城市中心识别结果
Fig.4
Locations of urban centers identified by a two-stage method in different cities
表2 城市中心指标统计
Tab.2
| 指标 | 统计值 | 北京市 | 上海市 | 重庆市 |
|---|---|---|---|---|
| 中心数量/个 | 全市 | 17 | 11 | 12 |
| 微博签到点数/个 | 全市 | 20 789 250 | 16 755 584 | 3 210 651 |
| 所有中心 | 17 418 001 | 14 452 674 | 2 931 382 | |
| 主中心 | 15 033 714 | 12 543 156 | 2 347 317 | |
| 微博签到点比重/% | 所有中心/全市 | 83.78 | 86.26 | 91.30 |
| 主中心/全部中心 | 86.31 | 86.79 | 80.08 |
4 讨论
4.1 空间单元对比分析
空间单元的大小会影响密度计算结果,进而影响城市空间结构识别结果,栅格单元过小,将导致空间单元密度出现大量零值; 空间单元过大,空间单元密度计算结果空间异质性过小,进而影响城市中心识别效果。因此,选取合适的空间单元是城市空间结构研究的重要环节。本文对前人研究中不同城市选取的空间单元面积进行统计,结果如表3所示。美国城市多中心识别研究中,常以普查区(census tracts)作为研究单元,研究选用的空间单元面积从1.09 km2到19.19 km2不等; 首尔市城市多中心识别研究中以邑、面、洞(eup-myeon-dong)作为基本单元,平均面积约为12.64 km2; 巴塞罗那与巴黎分别以自治市(municipalities)、市镇(communes)作为基本研究单元,平均面积各为19.51 km2与9.28 km2; 中国城市多中心识别研究中,常以街道(乡镇)作为基本空间单元,面积分别为38.14 km2(北京)、26.48 km2(上海)、44.47 km2(广州)、44.51 km2(深圳)。街道(乡镇)空间单元平均面积以及城市中心与郊区空间单元面积差异相比国外基本空间单元均较大,这会对城市多中心识别结果造成一定影响,因此,寻找平均面积及面积差异均较小的空间单元成为中国城市空间结构研究的重点与难点。
表3 不同研究中选取的空间单元平均面积
Tab.3
| 城市 | 单元平 均面积/ km2 | 参考文献 | 城市 | 单元平 均面积/ km2 | 参考文献 | |
|---|---|---|---|---|---|---|
| 北京 | 38.14 | 孙铁山等[13] | 巴塞罗那 | 19.51 | Garcia-López 等[41] | |
| 上海 | 26.48 | 魏旭红等[37] | 首尔 | 12.64 | Nam等[42] | |
| 广州 | 44.47 | 蒋丽等[38] | 芝加哥 | 1.09 | McMillen[28] | |
| 深圳 | 44.51 | 曾海宏等[39] | 达拉斯 | 2.72 | McMillen[28] | |
| 洛杉矶 | 4.68 | Pereira等[40] | 休斯顿 | 6.73 | McMillen[28] | |
| 匹兹堡 | 19.19 | Pereira等[40] | 洛杉矶 | 4.51 | McMillen[28] | |
| 圣保罗 | 20.45 | Pereira等[40] | 新奥尔良 | 14.61 | McMillen[28] | |
| 巴黎 | 9.28 | Pereira等[40] | 旧金山 | 3.65 | McMillen[28] |
如表1所示,基于分水岭的区域分割算法划分的北京、上海、重庆3市空间单元面积平均值及标准差分比为10.22 km2,7.03 km2,16.80 km2以及10.45 km2,4.87 km2,14.67 km2,其面积大小与西方城市选用的空间单元面积较为接近,且其空间单元面积标准差相较于街道(乡镇)也有较大程度降低(北京市街道(乡镇)面积标准差为53.4 km2); 与多主体的面向对象分割算法结果[9]相比,本文得到的空间单元平均面积与面积差异更小,且空间单元的边界更为平滑。由此可知,本文基于分水岭的区域分割算法得到的空间单元大小合适,且城市中心与郊区空间单元的一致性方面效果更好,适用于城市多中心识别的相关研究。
4.2 城市中心识别结果对比分析
为保证城市中心识别结果的可靠性,本文收集3个城市对标2020年的《城市总体规划》,并将《城市总体规划》划定的城市中心与本文识别的城市多中心进行对比,验证本文城市多中心识别算法的准确性。
《北京城市总体规划(2004—2020)》中将北京市中心城市设为城市主中心,这与本文识别结果相同,除通州次中心因城市发展与主中心连接成片之外,石景山、昌平、房山、顺义、怀柔、大兴等区中心街道均被识别为城市次中心,北京经济技术开发区、沙河地区也被识别为城市次中心,平谷区中心街道以及永乐经济开发区内部微博签到点较少,没有被识别为城市次中心; 除规划划定的次中心之外,本文还将北京首都国际机场、瀛海—马驹桥、北七家镇、东小口—来广营识别为次中心。《上海城市总体规划(1999—2020)》中设定的城市主中心与本文识别结果近似,城市规划设定的11个次中心中,除城桥地区不在研究区范围之外,其余中心均可在本文研究结果中找到,但其中闵行—奉贤、松江—青浦因城市发展等原因,2个市辖区次中心逐渐合并; 除城市规划划定的次中心之外,奉贤海湾旅游区也被识别为上海市次中心(可在2035年城市总体规划中看到)。《重庆市总体规划(2007—2020)》设定重庆都市区“多中心组团式”空间结构,本文识别的城市主中心以渝中区为中心,沙坪坝区、北碚区与主中心较远,被识别为城市次中心,这与城市规划中设定的主中心略有差别; 次中心中,除綦江、南川2个次中心发育水平较低之外,合川、璧山、江津、长寿均能识别为显著的城市次中心; 此外,重庆都市区之外的巴南、涪陵、铜梁、大足、永川也被识别为城市次中心。
总体来看,本文基于地理大数据的城市多中心识别方法对3个城市主中心、次中心的识别效果较好,识别结果与城市规划设定的城市中心基本吻合,城市多中心识别方法结果总体上接近于城市空间结构真实状况。
5 结论
本文基于微博签到数据、夜间灯光数据等易于获取的地理大数据,使用基于分水岭的区域分割算法以及两阶段城市中心识别算法识别了3个城市的多中心,并对本文方法的研究成果进行了对比验证,得到相关结论如下:
1)基于分水岭的区域分割算法可以打破现有城市行政区划的限制,更好地获取城市空间单元; 与前人空间结构研究成果对比发现,算法划分的空间单元面积的均值与方差均小于城市街道(区县)空间单元,适合应用于城市空间结构的相关研究。
2)基于微博签到数据以及两阶段城市中心识别方法,可以识别出北京、上海、重庆3个城市的多中心,识别结果与城市规划设定的城市多中心结构基本吻合,本文城市中心识别方法结果满足分析需要。
3)提出了一种新的应用地理大数据识别城市多中心的方法,此方法可应用于基于其他地理大数据的全球大城市城市空间结构研究,并对拓展地理大数据的应用领域、丰富现有城市空间结构研究的方法具有重要意义。
本研究中微博签到数据可以很大程度上代指人类活动,但微博用户基本不涉及老人、儿童及贫困人群,因此数据本身存在一定偏差,下一步可使用手机信令、微信点数据等地理大数据作为本文基础数据进行城市空间结构研究; 本文方法城市中心识别过程中,微博点总量阈值的选取会对结果造成一定影响; 此外,本文研究方法适用于中心城区面积较大的大城市,而中小城市中心城区面积较小,识别的空间单元较少,不容易识别出多中心空间结构。
参考文献
Monocentric or Polycentric? The urban spatial structure of employment in Beijing
[J].DOI:10.3390/su70911632 URL [本文引用: 1]
Economic transition,urbanization and population redistribution in China
[J].DOI:10.1016/j.habitatint.2015.10.006 URL [本文引用: 1]
Urban traffic congestion estimation and prediction based on floating car trajectory data
[J].
A new era of pollution progress in urban China
[J].
DOI:10.1257/jep.31.1.71
URL
[本文引用: 1]

Over the last 30 years, China's economy has boomed. This trend has lifted hundreds of millions of Chinese out of poverty but it has also sharply increased local, regional, and global pollution levels. We look at the rise in air pollution over recent decades, and the perhaps surprising finding that in many of China's urban areas, levels of particulates (of less than 10 microns) have been decreasing during the last 10 to 15 years. We then turn to the costs and tradeoffs of air pollution, including costs to human health, reductions in worker productivity, and how people are seeking to reduce their exposure to pollution as shown by compensating differentials in real estate prices and purchases of masks and air filters. We discuss how rising incomes tend to raise the demand for environmental amenities and thus increase political pressure for environmental protection, and then we turn to the policy tools that China has used to reduce pollution. We conclude by arguing that as China's government is preparing for an additional 300 million people to move to urban areas over the next 30 years, it will have a number of opportunities for China to reduce pollution through a shift from manufacturing to services, along with various steps to improve energy efficiency and resource conservation. Overall, it seems that China is on track to improve its environmental performance in the years ahead.
Selected studies on urban development issues in China:Introduction
[J].DOI:10.1080/02723638.2016.1158037 URL [本文引用: 1]
多中心结构:我国特大城市的未来形态
[J].
Multi-centered structure:The future pattern of mega-cities in China
[J].
郊区化进程中的就业分散化及其空间结构演化——以北京都市区为例
[J].
Employment decentralization and evolution of employment spatial structure amid suburbanization:An empirical study on Beijing metropolitan area
[J].
Using nighttime light data and POI big data to detect the urban centers of Hangzhou
[J].
DOI:10.3390/rs11151821
URL
[本文引用: 5]
The worldwide development of multi-center structures in large cities is a prevailing development trend. In recent years, China’s large cities developed from a predominantly mono-centric to a multi-center urban space structure. However, the definition and identification city centers is complex. Both nighttime light data and point of interest (POI) data are important data sources for urban spatial structure research, but there are few integrated applications for these two kinds of data. In this study, visible infrared imaging radiometer suite (NPP-VIIRS) nighttime imagery and POI data were combined to identify the city centers in Hangzhou, China. First, the optimal parameters of multi-resolution segmentation were determined by experiments. The POI density was then calculated with the segmentation results as the statistical unit. High–high clustering units were then defined as the main centers by calculating the Anselin Local Moran’s I, and a geographically weighted regression model was used to identify the subcenters according to the square root of the POI density and the distances between the units and the city center. Finally, a comparison experiment was conducted between the proposed method and the relative cut-off_threshold method, and the experiment results were compared with the evaluation report of the master plan. The results showed that the optimal segmentation parameters combination was 0.1 shape and 0.5 compactness factors. Two main city centers and ten subcenters were detected. Comparison with the evaluation report of the master plan indicated that the combination of nighttime light data and POI data could identify the urban centers accurately. Combined with the characteristics of the two kinds of data, the spatial structure of the city could be characterized properly. This study provided a new perspective for the study of the spatial structure of polycentric cities.
Using multi-source geospatial big data to identify the structure of polycentric cities
[J].DOI:10.1016/j.rse.2017.06.039 URL [本文引用: 10]
Towards concentration and decentralization:The evolution of urban spatial structure of Chinese cities,2001—2016
[J].DOI:10.1016/j.compenvurbsys.2019.101425 URL [本文引用: 1]
A longitudinal study of changes in intra-metropolitan employment concentration in Beijing:Decentralisation,reconcentration and polycentrification
[J].
Employment centers and polycentric spatial development in Chinese cities:A multi-scale analysis
[J].DOI:10.1016/j.cities.2020.102617 URL [本文引用: 2]
北京都市区人口——就业分布与空间结构演化
[J].
DOI:10.11821/xb201206010
[本文引用: 3]
本研究应用非参数计量方法,实证刻画北京都市区人口—就业空间分布演化,揭示在快速城市化和城市增长背景下,北京都市区空间结构特征及发展趋势。研究发现,北京都市区人口和就业分布都呈现多中心空间结构。20 世纪80 年代以来,随着人口郊区化,北京都市区人口次中心数量不断增加,并由近郊向远郊扩展,人口分布呈现明显的分散化和多中心化趋势,但人口分散的空间范围还比较有限。与人口的分散化趋势不同,2004-2008 年,北京都市区就业仍呈现向心集聚的趋势,造成远郊就业次中心的影响不断被弱化,都市区空间结构的多中心性有所降低。这说明北京都市区的单中心或强中心结构可能并未从根本上改变,且人口的分散化和就业的向心集聚导致宏观面上人口—就业的空间失衡。北京都市区多中心空间结构的形成,需要强化郊区次中心的集聚能力,同时注重人口—就业的平衡布局,这是未来北京都市区空间结构调整的重点。
Distributions of population and employment and evolution of spatial structures in the Beijing metropolitan area
[J].
DOI:10.11821/xb201206010
[本文引用: 3]
This study aims to examine the characteristics and changes of the spatial structure in the Beijing Metropolitan Area with the rapid urban growth and decentralization, through analyzing the spatial distributions of urban population and employment. To demonstrate the spatial evolution of population and employment distributions in the Beijing Metropolitan Area, we apply the nonparametric analysis in this study. Our study finds that the significant population and employment subcenters in the suburbs of the Beijing Metropolitan Area, characterized by the polycentric urban spatial structure. Since the 1980s, with the suburbanization of population, the number of population subcenters has increased in the Beijing Metropolitan Area, and the distribution of population subcenters has expanded from the inner suburbs to the outer suburbs. The overall trend toward the decentralization and polycentrification of population is evident, whereas the spatial extent of the decentralization of population is limited in the Beijing Metropolitan Area. Contrary to the decentralization of population, our study finds that the centralization of employment in the Beijing Metropolitan Area from 2004 to 2008 has led to the weakening influences of the outer suburban employment subcenters as well as the decline of the polycentricity of the spatial structure. This implies the spatial pattern of the Beijing Metropolitan Area may still be highly centralized, and the nature of the monocentric urban spatial structure may not be fundamentally changed. Meanwhile, the decentralization of population and the centralization of employment may lead to the overall jobs-housing imbalance. Therefore, to form the polycentric spatial structure, it is necessary to reinforce the agglomeration economies of suburban subcenters and improve the overall jobs-housing balance in the Beijing Metropolitan Area.
Detecting urban polycentric structure from POI data
[J].
DOI:10.3390/ijgi8060283
URL
[本文引用: 2]
It is meaningful to analyze urban spatial structure by identifying urban subcenters, and many methods of doing so have been proposed in the published literature. Although these methods are widely applied, they exhibit obvious shortcomings that limit their further application. Therefore, it is of great value to propose a new urban subcenter identification method that can overcome these shortcomings. In this paper, we propose the density contour tree (DCT) method for detecting urban polycentric structures and their spatial distributions. Conceptually, this method is based on an analogy between urban spatial structure and terrain. The point-of-interest (POI) density is visualized as a continuous mathematical surface representing the urban terrain. Peaks represent the regions of the most frequent human activity, valleys represent regions with small population densities in the city, and slopes represent spatial changes in urban land-use intensity. Using this method, we have detected the urban “polycentric” structure of Beijing and determined the corresponding spatial relationships. In addition, several important properties of the urban centers have been identified. For example, Beijing has a typical urban polycentric structure with an urban center area accounting for 5.9% of the total urban area, and most of the urban centers in Beijing serve comprehensive functions. In general, the method and the results can serve as references for the later research on analyzing urban structure.
Live-work-play centers of Chinese cities:Identification and temporal evolution with emerging data
[J].DOI:10.1016/j.compenvurbsys.2018.04.002 URL [本文引用: 1]
Characterizing the polycentric spatial structure of Beijing metropolitan region using carpooling big data
[J].DOI:10.1016/j.cities.2020.103040 URL [本文引用: 1]
Identifying subcenters with a nonparametric method and ubiquitous point-of-interest data:A case study of 284 Chinese cities
[J].
DOI:10.1177/2399808321996705
URL
[本文引用: 2]
Urban spatial structure, which is primarily defined as the spatial distribution of employment and residences, has been of lasting interest to urban economists, geographers, and planners for good reason. This paper proposes a nonparametric method that combines the Jenks natural break method and the Moran’s I to identify a city’s polycentric structure using point-of-interest density. Specifically, a polycentric city consists of one main center and at least one subcenter. A qualified (sub)center should have a significantly higher density of human activity than its immediate surroundings (locally high) and a relatively higher density than all the other subareas in the city (globally high). Treating Chinese cities as the subject, we ultimately identified 70 cities with polycentric structures from 284 prefecture-level cities in China. In addition, regression analyses were conducted to reveal the predictors of polycentricity among the subjects. The regression results indicate that the total population, GDP, average wage, and urban land area of a city all significantly predict polycentricity. As a whole, this paper provides an alternative and transferrable method for identifying main centers and subcenters across cities and to reveal common predictors of polycentricity. The proposed method avoids some of the potential problems in the conventional approach, such as the arbitrariness of thres hold. setting and sensitivity to spatial scales. It can also be replicated rather conveniently, as its input data, such as point-of-interest data, are widely available to the public and the data’s validity can be efficiently checked by field trips or other traditional data sources, such as land-use maps or censuses.
Polycentric urban development and its determinants in China:A geospatial big data perspective
[J].DOI:10.1111/gean.v53.3 URL [本文引用: 2]
The geography of Weibo
[J].DOI:10.1177/0308518X15594912 URL [本文引用: 1]
Delineating spatial patterns in human settlements using VIIRS nighttime light data:A watershed-based partition approach
[J].DOI:10.3390/rs10030465 URL [本文引用: 2]
The effect of employment sub-centres on population density in Barcelona
[J].
DOI:10.1177/0042098007087338
URL
[本文引用: 1]
The polycentric models of the new urban economics (NUE) predict that population density decreases while increasing the distance to employment centres. In contrast with this, some studies have calculated non-significant gradients or even positive ones, which appear to threaten seriously the usefulness of these theoretical models. Does this mean that this theoretical framework should be given up in order to understand the decision-making processes of the actors in a polycentric city and their cumulative effects on urban structure? Or, rather, is it a matter of overcoming problems with the appropriate estimating techniques? This study has tested the effect of decentralised and integrated sub-centres in the Barcelona metropolitan region on population density in 1991 and 2001. From the preliminary results, it is clear that population density increases with distance in a considerable number of the sub-centres that have sprung up as employment has decentralised. It has been detected that this result is due not so much to the higher value of more distant residential land compared with that nearer the employment sub-centres, but to deficiencies in the econometric model used. The problem is that the sub-centres belonging to this group are very close together. Once this is resolved, it is demonstrated that, although distance has less effect on decentralised sub-centres than integrated ones, in both cases the effect is negative; that is, when distance increases, population density is reduced. Therefore, the results obtained are not clearly contrary to the predictions of the theoretical models.
Subcenters in the Los Angeles region
[J].
Spatial analysis of employment and population density:The case of the agglomeration of Dijon 1999
[J].DOI:10.1111/gean.2004.36.issue-2 URL [本文引用: 1]
Agglomeration and dispersion of economic activities in Paris and its surroundings:An exploratory spatial data analysis
[J].
Functional polycentricity:Examining metropolitan spatial structure through the connectivity of urban sub-centres
[J].
DOI:10.1177/0042098012447000
URL
[本文引用: 1]
A shift from monocentric cities to increasingly polycentric urban regions has been widely recognised in recent research literature. Although polycentricity in general refers to the existence of several adjacent centres within the same area, many studies have emphasised that functional linkages between the centres of an urban system are also an essential part of polycentricity. Despite the increasing number of studies concerning functional polycentricity, research on the subject is still in a development phase. In this paper, a new approach to measure functional polycentricity is presented, in which functional polycentricity is approached through the connectivity of individual centres to the whole urban system. The paper illustrates the potential of the method with empirical case studies addressing the urban spatial structures of three functional urban regions in Finland. In the case studies, detailed commuting data are used in order to measure the degree of functional polycentricity.
Polycentric employment growth and the commuting behaviour in Benin metropolitan region,Nigeria
[J].
Suburban employment centres:The case of Chicago
[J].
DOI:10.1080/00420989420080201
URL
[本文引用: 1]
This paper uses data from the journey to work portion of the 1980 Census to estimate a polycentric model of employment density for the Chicago urbanised area. Distance to the Chicago central business district exerted a strong effect on employment density, but density was also influenced by proximity to three suburban employment centres. Some 27 per cent of total employment growth in metropolitan Chicago over the next decade was concentrated in these three subcentres.
Nonparametric employment subcenter identification
[J].DOI:10.1006/juec.2001.2228 URL [本文引用: 8]
The topography of metropolitan employment:Identifying centers of employment in a polycentric urban area
[J].DOI:10.1016/j.jue.2006.08.009 URL [本文引用: 1]
Detecting the true urban polycentric pattern of Chinese cities in morphological dimensions:A multiscale analysis based on geospatial big data
[J].DOI:10.1016/j.cities.2021.103298 URL [本文引用: 1]
The typology of the American metropo-lis:Monocentricity,polycentricity,or generalized dispersion
[J].
Decentralization and polycentricity:Spatial changes of employment in Beijing metropolitan area,China
[J].DOI:10.3390/su9101880 URL [本文引用: 1]
Evolving urban spatial structure and commuting patterns:A case study of Beijing,China
[J].DOI:10.1016/j.trd.2017.12.007 URL [本文引用: 1]
“Edge” or “edgeless” cities? Urban spatial structure in U.S.Metropolitan areas,1980 to 2000
[J].DOI:10.1111/jors.2007.47.issue-3 URL [本文引用: 1]
Urban subcentres in German city regions:Identification,understanding,comparison
[J].
Measuring growth and change in metropolitan form
[J].
我国大都市区就业次中心的形成机制——上海研究及与北京比较
[J].
Formation mechanism of employment subcenters in metropolitan areas:The case of Shanghai in comparison to Beijing
[J].
2000—2010年广州外来人口空间分布变动与对多中心城市空间结构影响研究
[J].
Guangzhou non-registered population spatial distribution and impact on poloycentricity spatial structure
[J].
深圳市就业空间结构及其演变(2001—2004)
[J].
Spatial structure of employment and its evolution in Shenzhen City:2001—2004
[J].
Urban centrality:A simple index
[J].DOI:10.1111/gean.12002 URL [本文引用: 4]
Employment decentralisation:Polycentricity or scatteration? The case of Barcelona
[J].
DOI:10.1177/0042098009360229
URL
[本文引用: 1]
At the present time, most large cities in the world are polycentric and, at the same time, they are undergoing processes of employment decentralisation and deconcentration. It has been argued that polycentricity is just an intermediate stage between monocentricity and a more unstructured, chaotic and amorphous location model, scatteration. For the case of the polycentric Barcelona, the aims of this study are to test: whether its employment is moving from polycentricity to scatteration; and, whether its employment location model is increasingly random and unstructured. The results show that, in spite of the decentralisation and deconcentration processes, employment concentrated in centres still represents a significant percentage of total employment and new sub-centres have emerged in the periphery. What is more, the results also show an increasing influence of employment sub-centres on employment location and density conditions. As a result, polycentricity has been reinforced.
The effect of spatial structure and dynamic externalities on local growth in Seoul metropolitan area
[J].DOI:10.1080/08111146.2017.1283751 URL [本文引用: 1]
