

0 引言
土壤水分是衔接大气、地表、土壤和地下的水分转换和循环的核心,土壤湿度是全球气候观测系统的基本气候变量之一,对于区域尺度的水分和能量交换也中起着至关重要的作用。虽然土壤水分仅占世界水资源的一小部分,但是在不同的地表和地下条件中,土壤水分对水循环的水量和能量平衡起着至关重要的作用[1]。由于土壤特征、土地利用、植被、地形以及气候条件的差异,土壤湿度的时空变异非常大[2⇓-4],传统的站点观测由于站点的数量有限、观测需要大量的人力、物力等而无法高效地获得大范围连续的观测数据。卫星遥感是获取土壤水分的一种有效的方式,可以提供地表土壤湿度的空间信息,能够对地表进行连续且大规模的观测。但卫星遥感仅能获取近地表(0~5 cm)的土壤湿度信息,无法获取根区土壤湿度(root-zone soil moisture, RZSM)的时空分布信息[1]。研究表明,位于植被根系层的RZSM对土壤表层的蒸发过程和植被蒸腾作用以及土壤-植被-大气界面的水分和能量收支有着显著影响[5],是蒸发、蒸腾、径流、地下水补给等水分分配的关键[6]。因此RZSM的定量估算及其时空变化特征对于水文、农业和气象的研究和应用都非常重要。
RZSM的估算方法主要包括同化法[7-8]、指数滤波器[9⇓-11]、土壤水分分析关系(soil moisture analytical relationship,SMAR)模型[12⇓-14]和人工神经网络(artificial neural network, ANN)[15]等。其中ANN模型能够模拟土壤水分之间的非线性相互作用,考虑土壤水分的传输特性以及地表通量的影响。Kornelsen等[15]提出利用ANN从地表测量中估计根区土壤水分的方法; 吴善玉[16]基于Sentinel系列卫星中的Sentinel-1 SAR数据、Sentinel-2光学数据以及AMSR2亮温数据,分别在青藏高原那曲地区和西班牙萨拉曼卡地区训练了BP神经网络模型反演地表土壤水分,结果表明在BP神经网络中加入表达地形要素的坡度因子可以更好地训练网络,得到更高精度的反演结果; 杨晓霞等[17]针对神经网络收敛速度慢、易陷入局部最优的问题,提出基于动量因子和自适应学习率的BP神经网络改进方法,用于土壤湿度的时序预测,结果表明该方法在预测精度、收敛速度方面都优于其他4种方法。
综上所述,本文将西辽河流域作为研究区,利用ANN方法,以2013—2018年的数据训练模型,基于模型估算西辽河流域内2019—2020年的RZSM,分析其时空变化特征,为减轻西辽河流域水旱灾害、有效保护及合理开发利用水资源,提高水土保持能力以及社会经济可持续发展提供科学依据。
1 研究区概况和数据源
1.1 研究区概况
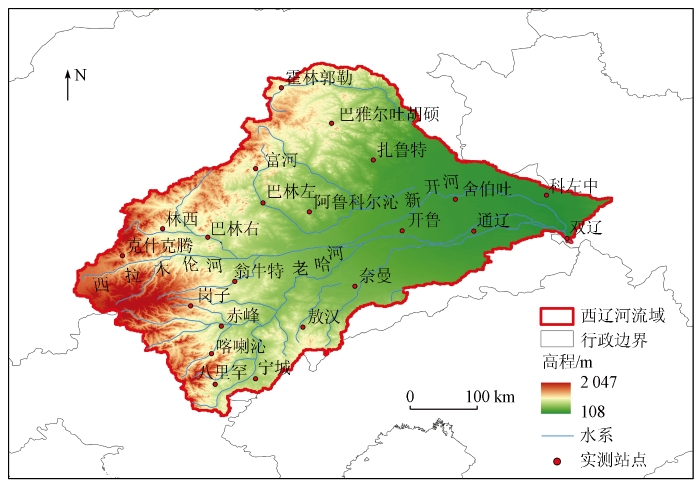
西辽河流域地处我国北方农牧交错带东段三北交界处[19],地理范围为E116°32'~124°30',N41°05'~45°13',面积约1.37万 km2,主要在内蒙古自治区境内,小部分边缘区域位于吉林省、辽宁省和河北省境内,如图1所示。流域北、西、南3面环山,东邻辽河平原,地势西高东低,海拔在108~2 047 m,干流长312.69 km,水流方向为自西向东,最后汇入辽河,流域内较大的支流有西拉木伦河、老哈河、新开河、西辽河等。西辽河流域平原区是典型的干旱半干旱地区,属温带大陆性气候,季节分明,干旱少雨,年降雨量在300~400 mm之间,70%的降雨量多集中在6—8月,年平均气温在5.0~6.5 ℃之间,年日照时数在2 800~3 100 h之间[20]。由于西辽河流域地理区位特殊,自然环境、人类活动的双重影响使得沙漠化现象逐年严重,当地农牧业直接或间接地受到影响,西辽河流域成为我国东北地区生态环境最为脆弱的地区[21-22]。
图1
1.2 数据及预处理
1.2.1 遥感表层土壤湿度数据
1.2.2 站点实测土壤湿度数据
本研究采用的实测土壤湿度数据来自国家气象局的站点土壤湿度数据,以体积含水量(m3/m3)为单位,包括10 cm,20 cm,30 cm,40 cm,50 cm和60 cm等深度的土壤湿度,时间分辨率为1 d。考虑到西辽河流域为半干旱地区,研究表明在自然条件下的半干旱区土壤,土壤水分的入渗深度一般在40 cm左右,植被根系主要分布在地下50 cm左右,因此本研究将地下40~60 cm的土壤湿度作为研究区内的根区土壤湿度,将40 cm,50 cm和60 cm深度的实测土壤湿度数据均值作为站点实测RZSM。实测站点的分布情况如图1所示。
1.2.3 土壤属性数据
本研究使用的土壤属性数据来自Liu等[27]的研究成果,土壤物理属性数据包括土壤各个深度的沙砾含量、粉粒含量和黏粒含量,单位为g/kg,土壤水文属性数据包括土壤各个深度的田间持水量、萎蔫含水量、残余含水量、饱和含水量、饱和导水率、土壤容重和孔隙度,含水量的单位为cm3/cm3,饱和导水率的单位为cmd-1,容重的单位为g/cm3,孔隙度的单位为cm3/cm3。以上土壤属性均包括[100) cm和[100,200] cm多个深度数据,将[0,5) cm和[30,60) cm的土壤属性分别作为土壤表层和根系层的土壤属性数据,并将土壤属性数据重采样为分辨率为0.25°的栅格数据。
1.2.4 气象数据
本研究所采用的气象数据来自国家气象局,时间分辨率为每日,包括2013—2020年每天的云覆盖度/%、日最高温/℃、日最低温/℃、日降水量/(mm·d-1)、相对湿度/%、风速/(m·s-1)和日照时长/h,将所有气象数据重采样为0.25°的栅格数据。
1.2.5 植被指数数据
归一化植被指数(normalized difference vegetation index, NDVI)与光合作用吸收辐射占总辐射的比例有关,是最常使用的反映植物叶绿素活性的植被指数,计算公式[28]为:
式中:
1.2.6 实际蒸散发
本研究选取GLEAM产品表征西辽河流域内的实际蒸散发。GLEAM模型基于Priestley-Taylor公式,利用来自不同卫星的遥感观测数据反演得到空间分辨率0.25°的日实际蒸散发。GLEAM模型由4个相互联系的单元组成: ①Gash截留模型; ②土壤模块; ③胁迫模块; ④Priestley-Taylor模块。将高大冠木、低矮植被以及裸土这3种有具体物理特性的陆地表面类型分开计算[31]。本文使用的GLEAM模型估算的全球陆地蒸散发,空间分辨率是0.25°,时间分辨率为1 d,时间跨度为2013—2020年,具体模型结构可参考文献[32-33]。Yang等[34]于2017年详细评价了GLEAM蒸散发产品在中国区域的适用性,因此本研究不再单独评价其在西辽河流域的适用性。
2 研究方法
2.1 ANN模型
在过去20 a中,ANN模型已广泛应用于水文学领域[35⇓-37]。在各种神经网络模型中,多层感知机(multiple layer perceptron, MLP),又称前馈神经网络,能够捕捉系统中的非线性,被广泛应用于预测在复杂大气和作物生长条件下的土壤湿度[38]。研究表明,在训练样本数量足够、权重取值合理和模型结构设置恰当的情况下,具有一个隐藏层的多层感知机模型能够拟合任何连续且有界的函数[39-40]。因此本研究使用3层MLP模型,包括一个输入层、一个隐藏层和一个输出层(图2)。第一层的神经元代表模型的输入变量,将加权输入变量和偏差之和传递给隐藏层中的神经元,计算隐藏层神经元中内置的激活函数,得到隐藏层神经元的输出,将隐藏层神经元的加权输出和偏差之和传递给输出层,计算输出层神经元的激活函数,得到整个网络模型的输出值。这一过程可表示为[40]:
图2
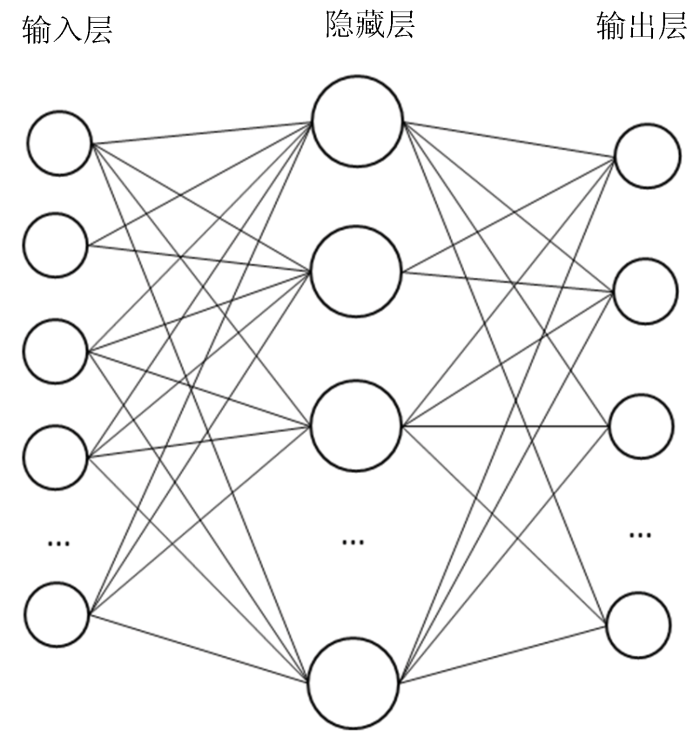
式中: y为神经网络的输出变量; X为输入变量; W1和W2分别为输入层神经元和隐藏层神经元的权重; b1和b2分别为输入层和隐藏层的偏差; f和g分别为输出神经元和隐藏神经元的激活函数。
MLP算法捕捉非线性特征的能力主要依赖于神经元中使用的非线性激活函数。研究表明,正切S型函数反对称性的特点通常会加速学习过程,在以往研究中被证明是在水文模型中更好的选择[39⇓-41],因此将正切S型函数设置为隐藏层神经元的激活函数。以往研究未发现输出神经元的非线性函数对模型有明显改善效果[41],为了简化模型,选择线性函数作为输出层的激活函数。隐藏层的神经元的个数一般在20~70个之间,研究发现隐藏层神经元个数越多,模型拟合越精确,但模型容易过拟合。Kornelsen等[15]采用20个隐藏层神经元模拟小规模RZSM,能够取得较好的效果。本研究中的模型训练数据总共包含19 011个样本,数据规模与Kornelsen等[15]采用的数据规模相近,因此本研究分别采用10,20,30和40个隐藏层神经元训练模型,发现隐藏层神经元个数为20个时,模型模拟的RZSM与站点实测RZSM之间的相关性较高,因此将隐藏层的神经元个数设置为20个。
将每个输入/目标对视为ANN学习的一个样本,每个样本的估计值与相应的目标值之间存在误差,神经网络可以通过调整神经元之间的权重来最小化误差函数,从而增强其拟合目标的能力。在本研究中,均方误差(mean squared error, MSE)被用作所有模型训练的误差函数,计算公式为:
式中: N为样本数; yi和ti分别为模型输出值和相应的目标变量值。为了获得最小代价函数,采用Levenberg-Marquardt算法(简称L-M算法)对MLP模型进行训练,该算法被证明因其平衡了牛顿法的速度和最快下降法的收敛性而比其他算法更近有效[40]。为了避免ANN模型过拟合,用于训练模型的数据集分为3部分: 训练集(70%)、验证集(15%)和测试集(15%)。当测试集的MSE<0.002或达到最大迭代次数5 000时停止迭代。
2.2 基于ANN的RZSM估算
由于西辽河流域位于半干旱地区,因此根系层的水分输入主要来自表层土壤水分下渗,水分输出主要为蒸散发,所以选择与RZSM关系最密切的遥感表层土壤湿度作为解释变量之一。考虑到研究区在不同时段和不同地区的气象状况不同,还选择了影响根区土壤水分和能量平衡的各种气象变量作为输入变量,包括日尺度的相对湿度、降雨量、最高温、最低温和风速。NDVI和蒸散发能够为模型提供蒸发和蒸腾作用的相关信息,因此解释变量也包括NDVI和蒸散发。RZSM作为低通过滤器,与大气具有正反馈机制[43],累积降水量和温度是用于估算RZSM的更有效的输入变量[44-45]。前13 d[45]和30 d[46]的累积降水量被认为是有效输入,研究表明采用前30 d的累积输入的模型的效果更好[47],为了较为全面地考虑降水量带来的影响,将当天的降水量、前13 d的累积降水量和前30 d的累积降水量作为模型中与降水量有关的解释变量。
综上所述,本研究以站点实测的RZSM作为目标变量,以站点所在栅格的遥感表层土壤湿度、土壤的黏粒含量、沙砾含量、粉粒含量、凋萎含水量、田间持水量、土壤容重、当天降水量、前13 d累积降水量、前30 d累积降水量、前30 d累积日最高温、前30 d累积日最低温、相对潮湿度、日照时长、风速、云量、NDVI和实际蒸散发量作为神经网络模型的输入变量,采用3层MLP模型建立RZSM估算模型。隐藏层中包括20个神经元,训练算法为L-M算法。以2013—2018年的数据训练模型,基于模型估算西辽河流域内2019—2020年的RZSM时空分布。
3 结果与分析
由ANN模拟的2019—2020年西辽河流域内每天的RZSM与站点实测RZSM之间的统计对比(表1)可知,ANN模拟RZSM与站点实测RZSM之间的平均均方根误差(root mean square error,RMSE)为0.056 7 m3/m3,平均相关系数R为0.611 7,所有R相应的p<0.01,表明以土壤质地数据、土壤水文特征、降水累积值、气温累积值、NDVI和蒸散发作为解释变量,基于ANN建立RZSM估算模型能够取得较好的效果。
表1 ANN模拟RZSM与站点实测RZSM之间的RMSE和R
Tab.1
| 站点名称 | R | RMSE |
|---|---|---|
| 巴雅尔吐胡硕 | 0.735 5 | 0.051 5 |
| 富河 | 0.696 1 | 0.030 0 |
| 扎鲁特 | 0.535 8 | 0.057 7 |
| 巴林左 | 0.614 1 | 0.041 6 |
| 舍伯吐 | 0.319 7 | 0.026 0 |
| 科左中 | 0.830 7 | 0.031 3 |
| 巴林右 | 0.634 3 | 0.090 3 |
| 林西 | 0.715 1 | 0.025 4 |
| 克什克腾 | 0.806 5 | 0.051 2 |
| 阿鲁科尔沁 | 0.841 1 | 0.037 2 |
| 开鲁 | 0.210 5 | 0.198 7 |
| 通辽 | 0.438 1 | 0.084 2 |
| 翁牛特 | 0.597 7 | 0.021 4 |
| 岗子 | 0.815 3 | 0.028 9 |
| 赤峰 | 0.330 7 | 0.033 6 |
| 奈曼 | 0.319 7 | 0.082 4 |
| 敖汉 | 0.707 2 | 0.027 7 |
| 喀喇沁 | 0.702 2 | 0.052 9 |
| 八里罕 | 0.772 6 | 0.085 7 |
图3
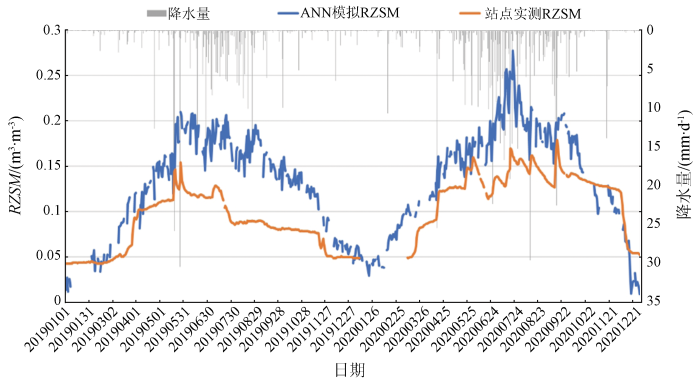
图3
2019—2020年克什克腾的ANN模拟RZSM与站点实测RZSM时间序列
Fig.3
Time series of the estimated RZSM based on ANN and the in-situ measured RZSM of 2019—2020 at Keshiketeng
图4

图4
2019—2020年岗子的ANN模拟RZSM与站点实测RZSM时间序列
Fig.4
Time series of the estimated RZSM based on ANN and the in-situ measured RZSM of 2019—2020 at Gangzi
图5
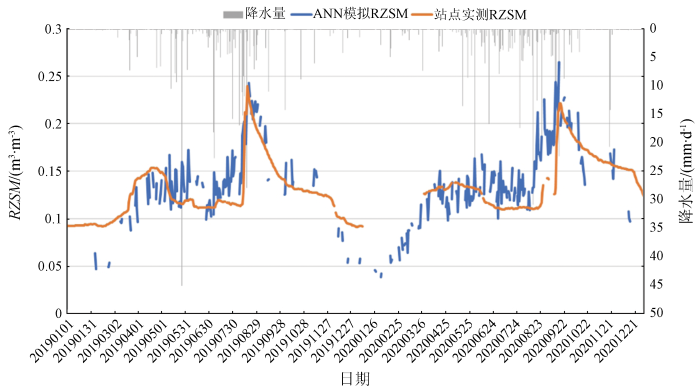
图5
2019—2020年敖汉的ANN模拟RZSM与站点实测RZSM时间序列
Fig.5
Time series of the estimated RZSM based on ANN and the in-situ measured RZSM of 2019—2020 at Aohan
对比降水量和站点实测RZSM可知,西辽河流域5—10月的降水量较为丰富,相应地,5—10月的RZSM较高,其峰值一般出现在站点所在位置降水量增加的1~2 d内,且RZSM的变化梯度不等。但并不是每次的降水量增加都必然导致RZSM的增大: 如克什克腾站点2019年8月下旬的实测RZSM、岗子站点2019年6月下旬和2020年6月中旬的实测RZSM和克什克腾站点2019年5月31日和2020年5月31日的实测RZSM,说明降水量的突然增加并不是RZSM的唯一影响因素。总的来说,RZSM的年内变化表现为1—3月数值小而平稳,5—10月随降水量等因素的变化而波动变化,11—12月急剧下降。
对比ANN模拟RZSM时间序列和站点实测RZSM时间序列可知,ANN模型模拟的RZSM时间序列比站点实测RZSM时间序列的数值波动大,但二者有着相近的时间变化趋势,表明ANN模型模拟的RZSM能够较好地捕捉根系层土壤水分的变化动态。但ANN模型估算RZSM也存在不足,具体表现为在一年中降水较丰富的5—10月份,ANN模型容易高估降水量增加后的RZSM的变化梯度,从而高估RZSM的实际值,表明采用当天的降水量、前13 d的累积降水量和前30 d的累积降水量作为与降水相关的解释变量存在局限,且模型对根系层土壤水分的水分损失相关的解释变量考虑不够。
图6
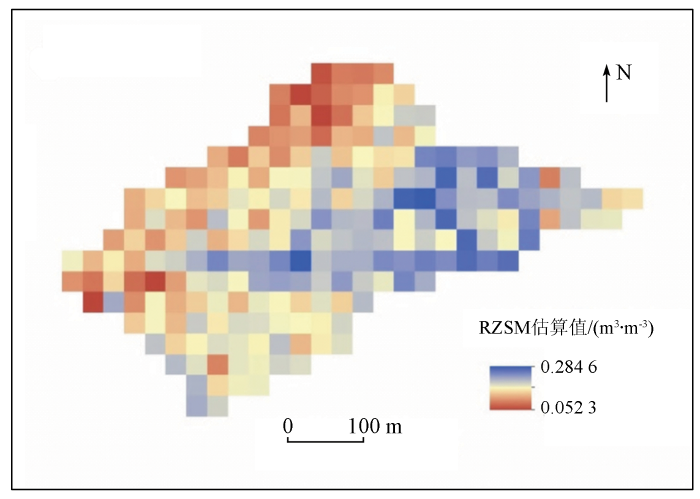
图6
2019年6月1日西辽河流域根区土壤湿度估算值
Fig.6
The estimated RZSM in the Xiliaohe River Basin on June 1, 2019
图7

图7
2020年6月1日西辽河流域根区土壤湿度估算值
Fig.7
The estimated RZSM in the Xiliaohe River Basin of on June 1, 2020
4 结论与讨论
根区土壤湿度的估算对农作物估产、水文模型构建、水资源管理等具有重要意义。本研究将2013—2018年每天的ESA CCI土壤湿度数据、风速、前30 d的累积降水量、前30 d的累积日最高温、前30 d的累积日最低温、相对潮湿度、土壤质地、土壤水文属性、NDVI和蒸散发等作为解释变量,将2013—2018年每天站点实测的RZSM作为目标变量,基于ANN算法建立RZSM估算模型,估算2019—2020年西辽河流域每天的RZSM。主要结论如下:
1)结果表明,ANN模型模拟的RZSM时间序列与站点实测RZSM时间序列之间的平均RMSE为0.056 7 m3/m3,平均R为0.611 7,表明ANN模型能够取得较为可靠的RZSM估算值。
2)ANN模型模拟的RZSM时间序列和站点实测RZSM时间序列有着相近的时间变化趋势,表明ANN模型模拟的RZSM能够较好地捕捉根系层土壤水分的动态变化,但ANN模型容易高估降水量增加后的根区土壤湿度的变化梯度,从而高估RZSM的实际峰值,可能的原因包括: 采用当天降水量、前13 d累积降水量和前30 d累积降水量作为与降水相关的解释变量存在局限; 模型对根系层土壤水分的水分损失相关的解释变量考虑不够; ANN模型的模式学习和现实状况中的不确定性之间的矛盾。
3)西辽河流域RZSM的年内变化表现为1—3月数值小而平稳,5—10月随降水量等因素的变化而波动变化,11—12月急剧下降。5—10月的RZSM较高,其峰值一般出现在站点所在位置降水量增加的1~2 d内,但并不是每次的降水量增加都必然导致RZSM的增大。流域内RZSM的数值在0.05~0.31 m3/m3之间,空间异质性较高,整体呈现出从西向东,RZSM逐渐增大的空间分布特征。
总之,将遥感表层土壤湿度数据、气象条件、土壤属性、NDVI和实际蒸散发等作为解释变量,站点实测RZSM作为目标变量,建立ANN模型来估算半干旱的西辽河流域RZSM的时空分布及其动态变化特征,为水文模型建模、干旱预报预警等提供科学依据。
然而,本研究也存在许多不足: 首先,在选择ANN模型的解释变量时,未对解释变量进行分析和筛选,而是根据RZSM的物理意义选择模型中的解释变量,且未讨论累积降水量和累积气温的天数对模型效果的影响; 其次,从结果来看,本研究建立的ANN模型容易高估降水量增加后的RZSM的变化梯度,从而高估RZSM的实际值,表明模型对根系层土壤水分的水分损失相关的解释变量考虑不够,解释变量的选择和筛选还需要进一步讨论。ANN模型的精度高度依赖于解释变量的选择和模型结构的设置,对于RZSM的估算来说,解释变量的选择对模型有效性的影响更大,未来可进一步探讨降水量累积值的天数、水分损失相关变量对RZSM估算的影响。
参考文献
Predicting root zone soil moisture with soil properties and satellite near-surface moisture data across the conterminous united states
[J].DOI:10.1016/j.jhydrol.2017.01.020 URL [本文引用: 3]
Reconstruction and analysis of temporal and spatial variations in surface soil moisture in China using remote sensing
[J].DOI:10.1007/s11434-012-5011-8 URL [本文引用: 1]
阿克苏河流域土壤湿度反演与监测研究
[J].
Soil moisture retrieval and monitoring in the Aksu River basin
[J].
退化草原土壤理化性质空间异质性及其对土壤水分的影响
[J].
Spatial heterogeneity of soil physical and chemical properties in degraded grassland and their effect on soil moisture
[J].
An analysis of the soil moisture feedback on convective and stratiform precipitation
[J].
DOI:10.1175/2007JHM863.1
URL
[本文引用: 1]

Land–atmosphere interactions in midlatitude continental regions are particularly active during the warm season. It is still unclear whether and under what circumstances these interactions may involve positive or negative feedbacks between soil moisture conditions and rainfall occurrence. Assessing such feedbacks is crucially important to a better understanding of the role of land surface conditions on the regional dynamics of the water cycle. This work investigates the relationship between soil moisture and subsequent precipitation at the daily time scale in a midlatitude continental region. Sounding data from 16 locations across the midwestern United States are used to calculate two indices of atmospheric instability—namely, the convective available potential energy (CAPE) and the convective inhibition (CIN). These indices are used to classify rainfall as convective or stratiform. Correlation analyses and uniformity tests are then carried out separately for these two rainfall categories, to assess the dependence of rainfall occurrence on antecedent soil moisture conditions, using simulated soil moisture values. The analysis suggests that most of the positive correlation observed between soil moisture and subsequent precipitation is due to the autocorrelation of long stratiform events. The authors found both areas with positive and areas with negative feedback on convective precipitation. This behavior is likely due to the contrasting effects of soil moisture conditions on convective phenomena through changes in surface temperature and the supply of water vapor to the overlying air column. No significant correlation is found between daily rainfall intensity and antecedent simulated soil moisture conditions either for convective or stratiform rainfall.
Comparing the normalized difference infrared index (NDII) with root zone storage in a lumped conceptual model
[J].
DOI:10.5194/hess-20-3361-2016
URL
[本文引用: 1]
. With remote sensing we can readily observe the Earth's surface, but direct observation of the sub-surface remains a challenge. In hydrology, but also in related disciplines such as agricultural and atmospheric sciences, knowledge of the dynamics of soil moisture in the root zone of vegetation is essential, as this part of the vadose zone is the core component controlling the partitioning of water into evaporative fluxes, drainage, recharge, and runoff. In this paper, we compared the catchment-scale soil moisture content in the root zone of vegetation, computed by a lumped conceptual model, with the remotely sensed Normalized Difference Infrared Index (NDII) in the Upper Ping River basin (UPRB) in northern Thailand. The NDII is widely used to monitor the equivalent water thickness (EWT) of leaves and canopy. Satellite data from the Moderate Resolution Imaging Spectroradiometer (MODIS) were used to determine the NDII over an 8-day period, covering the study area from 2001 to 2013. The results show that NDII values decrease sharply at the end of the wet season in October and reach lowest values near the end of the dry season in March. The values then increase abruptly after rains have started, but vary in an insignificant manner from the middle to the late rainy season. This paper investigates if the NDII can be used as a proxy for moisture deficit and hence for the amount of moisture stored in the root zone of vegetation, which is a crucial component of hydrological models. During periods of moisture stress, the 8-day average NDII values were found to correlate well with the 8-day average soil moisture content (Su) simulated by the lumped conceptual hydrological rainfall–runoff model FLEX for eight sub-catchments in the Upper Ping basin. Even the deseasonalized Su and NDII (after subtracting the dominant seasonal signal) showed good correlation during periods of moisture stress. The results illustrate the potential of the NDII as a proxy for catchment-scale root zone moisture deficit and as a potentially valuable constraint for the internal dynamics of hydrological models. In dry periods, when plants are exposed to water stress, the EWT (reflecting leaf water deficit) decreases steadily, as moisture stress in the leaves is connected to moisture deficits in the root zone. Subsequently, when the soil moisture is replenished as a result of rainfall, the EWT increases without delay. Once leaf water is close to saturation – mostly during the heart of the wet season – leaf characteristics and NDII values are not well correlated. However, for both hydrological modelling and water management, the stress periods are most important, which is why this product has the potential of becoming a highly efficient model constraint, particularly in ungauged basins.\n
China land soil moisture EnKF data assimilation based on satellite remote sensing data
[J].DOI:10.1007/s11430-010-4160-3 URL [本文引用: 1]
Evolutionary assimilation of streamflow in distributed hydrologic modeling using in-situ soil moisture data
[J].DOI:10.1016/j.advwatres.2012.07.012 URL [本文引用: 1]
From near-surface to root-zone soil moisture using an exponential filter:An assessment of the method based on in-situ observations and model simulations
[J].
DOI:10.5194/hess-12-1323-2008
URL
[本文引用: 1]
. A long term data acquisition effort of profile soil moisture is under way in southwestern France at 13 automated weather stations. This ground network was developed in order to validate remote sensing and model soil moisture estimates. In this paper, both those in situ observations and a synthetic data set covering continental France are used to test a simple method to retrieve root zone soil moisture from a time series of surface soil moisture information. A recursive exponential filter equation using a time constant, T, is used to compute a soil water index. The Nash and Sutcliff coefficient is used as a criterion to optimise the T parameter for each ground station and for each model pixel of the synthetic data set. In general, the soil water indices derived from the surface soil moisture observations and simulations agree well with the reference root-zone soil moisture. Overall, the results show the potential of the exponential filter equation and of its recursive formulation to derive a soil water index from surface soil moisture estimates. This paper further investigates the correlation of the time scale parameter T with soil properties and climate conditions. While no significant relationship could be determined between T and the main soil properties (clay and sand fractions, bulk density and organic matter content), the modelled spatial variability and the observed inter-annual variability of T suggest that a weak climate effect may exist.
Estimating root zone soil moisture using near-surface observations from SMOS
[J].
DOI:10.5194/hess-18-139-2014
URL
[本文引用: 1]
. Satellite-derived soil moisture provides more spatially and temporally extensive data than in situ observations. However, satellites can only measure water in the top few centimeters of the soil. Root zone soil moisture is more important, particularly in vegetated regions. Therefore estimates of root zone soil moisture must be inferred from near-surface soil moisture retrievals. The accuracy of this inference is contingent on the relationship between soil moisture in the near-surface and the soil moisture at greater depths. This study uses cross correlation analysis to quantify the association between near-surface and root zone soil moisture using in situ data from the United States Great Plains. Our analysis demonstrates that there is generally a strong relationship between near-surface (5–10 cm) and root zone (25–60 cm) soil moisture. An exponential decay filter is used to estimate root zone soil moisture using near-surface soil moisture derived from the Soil Moisture and Ocean Salinity (SMOS) satellite. Root zone soil moisture derived from SMOS surface retrievals is compared to in situ soil moisture observations in the United States Great Plains. The SMOS-based root zone soil moisture had a mean R2 of 0.57 and a mean Nash–Sutcliffe score of 0.61 based on 33 stations in Oklahoma. In Nebraska, the SMOS-based root zone soil moisture had a mean R2 of 0.24 and a mean Nash–Sutcliffe score of 0.22 based on 22 stations. Although the performance of the exponential filter method varies over space and time, we conclude that it is a useful approach for estimating root zone soil moisture from SMOS surface retrievals.\n
Estimation of root-zone soil moisture over gullies using an exponential filter
[J].
A modified version of the SMAR model for estimating root-zone soil moisture from time-series of surface soil moisture
[J].DOI:10.4314/wsa.v43i3.14 URL [本文引用: 1]
A physically based approach for the estimation of root-zone soil moisture from surface measurements
[J].
DOI:10.5194/hess-18-1199-2014
URL
[本文引用: 1]
. In the present work, we developed a new formulation for the estimation of the soil moisture in the root zone based on the measured value of soil moisture at the surface. It was derived from a simplified soil water balance equation for semiarid environments that provides a closed form of the relationship between the root zone and the surface soil moisture with a limited number of physically consistent parameters. The method sheds lights on the mentioned relationship with possible applications in the use of satellite remote sensing retrievals of soil moisture. The proposed approach was used on soil moisture measurements taken from the African Monsoon Multidisciplinary Analysis (AMMA) and the Soil Climate Analysis Network (SCAN) databases. The AMMA network was designed with the aim to monitor three so-called mesoscale sites (super sites) located in Benin, Mali, and Niger using point measurements at different locations. Thereafter the new formulation was tested on three additional stations of SCAN in the state of New Mexico (US). Both databases are ideal for the application of such method, because they provide a good description of the soil moisture dynamics at the surface and the root zone using probes installed at different depths. The model was first applied with parameters assigned based on the physical characteristics of several sites. These results highlighted the potential of the methodology, providing a good description of the root-zone soil moisture. In the second part of the paper, the model performances were compared with those of the well-known exponential filter. Results show that this new approach provides good performances after calibration with a set of parameters consistent with the physical characteristics of the investigated areas. The limited number of parameters and their physical interpretation makes the procedure appealing for further applications to other regions.\n
Estimation of the root-zone soil moisture using passive microwave remote sensing and SMAR model
[J].
Root-zone soil moisture estimation using data- driven methods
[J].DOI:10.1002/2013WR014127 URL [本文引用: 4]
一种基于神经网络的土壤湿度预测方法
[J].
A soil moisture prediction algorithm based on artificial neural network
[J].
西辽河流域植被NPP时空分布特征及其影响因素研究
[J].
Spatiotemporal distribution of vegetation net primary productivity(NPP) and its impact factors in the Xiliaohe basin
[J].
2000—2018年西辽河流域植被覆盖度时空变化特征及影响因素研究
[J].
Analysis on the characteristics of spatial-temporal changes and influencing factors of vagetation coverage in the Xiliao River basin from 2000 to 2018
[J].
西辽河地区植被气候生产潜力及其对气候变化的响应
[J].
DOI:10.16258/j.cnki.1674-5906.2020.05.002
[本文引用: 1]
可下载PDF全文。
Evolution of vegetation climatic potential productivity and its response to climate change in west Liao River basin
[J].
基于面向对象及光谱特征的植被信息提取与分析
[J].
Abstraction and analysis of vegetation information based on object-oriented and spectra features
[J].DOI:10.5846/stxb URL [本文引用: 1]
西辽河流域近60年来气候变化趋势分析
[J].
The climate change trend in Xiliao River basin in recent 60 years
[J].
基于遥感土壤湿度反演中尺度流域水储量季节性变化
[J].基于GRACE卫星数据反演陆地水储量变化的能力在众多大尺度流域(>15 000 km2)中得到验证,但该数据空间分辨率较低,难以应用于中尺度流域。本研究基于分辨率更高的遥感土壤湿度,通过引入转换系数Kpm,对2010年到2015年汛期、非汛期前后的中尺度流域水储量变化(dSm/dt)进行估算,并通过水量平衡方程对该方法进行验证分析。结果表明基于土壤湿度得到的dSm/dt与P-Q-E在各个中尺度流域上的相关系数均大于0.7,呈显著相关,土壤湿度能捕捉流域季节性水储量变化;相关系数和均方根偏差在南部区域偏大,说明该方法虽然在湿润区捕捉变化的能力更强,但对量级的把握能力较弱,在北部偏干区域则表现呈相反趋势。该方法为陆地水储量计算提供新途径,计算结果可为区域水资源调度管理起指导作用。
Evaluation of the seasonal water storage changes in medium-scale basins based on remotely-sensed soil moisture retrievals
[J].
Triple collocation-based merging of satellite soil moisture retrievals
[J].DOI:10.1109/TGRS.2017.2734070 URL [本文引用: 1]
Effect of subsoiling on soil water and crop yield in semi-arid area
[J].
Spatial distribution of apricot roots in a semi-arid environment
[J].DOI:10.1007/s10457-015-9869-8 URL [本文引用: 1]
Mapping high resolution national soil information grids of China
[J].
DOI:10.1016/j.scib.2021.10.013
PMID:36546081
[本文引用: 1]
Soil spatial information has traditionally been presented as polygon maps at coarse scales. Solving global and local issues, including food security, water regulation, land degradation, and climate change requires higher quality, more consistent and detailed soil information. Accurate prediction of soil variation over large and complex areas with limited samples remains a challenge, which is especially significant for China due to its vast land area which contains the most diverse soil landscapes in the world. Here, we integrated predictive soil mapping paradigm with adaptive depth function fitting, state-of-the-art ensemble machine learning and high-resolution soil-forming environment characterization in a high-performance parallel computing environment to generate 90-m resolution national gridded maps of nine soil properties (pH, organic carbon, nitrogen, phosphorus, potassium, cation exchange capacity, bulk density, coarse fragments, and thickness) at multiple depths across China. This was based on approximately 5000 representative soil profiles collected in a recent national soil survey and a suite of detailed covariates to characterize soil-forming environments. The predictive accuracy ranged from very good to moderate (Model Efficiency Coefficients from 0.71 to 0.36) at 0-5 cm. The predictive accuracy for most soil properties declined with depth. Compared with previous soil maps, we achieved significantly more detailed and accurate predictions which could well represent soil variations across the territory and are a significant contribution to the GlobalSoilMap.net project. The relative importance of soil-forming factors in the predictions varied by specific soil property and depth, suggesting the complexity and non-stationarity of comprehensive multi-factor interactions in the process of soil development.Copyright © 2021 Science China Press. Published by Elsevier B.V. All rights reserved.
基于MOD 09GA数据的新疆草地生长状况遥感监测研究
[J].
DOI:10.11686/cyxb2017232
[本文引用: 1]
以新疆全区草地为研究对象,利用2010-2014年天然草地地上生物量实测数据(above-ground biomass,AGB)和EOS Terra MODIS每日地表反射率产品MOD 09GA,采用空间分析方法分别计算了生长季(4-10月)草地NDVI<sub>max</sub>,MSAVI<sub>max</sub>,PVI<sub>max</sub>,NDVI<sub>mean</sub>,MSAVI<sub>mean</sub>和PVI<sub>mean</sub> 6种植被指数,探讨了NDVI<sub>max</sub>,MSAVI<sub>max</sub>,PVI<sub>max</sub>与草地地上生物量之间的遥感反演模型,分析了新疆草地生长季多年NDVI<sub>mean</sub>,MSAVI<sub>mean</sub>和PVI<sub>mean</sub>空间分布特征和空间变化特征。根据所选的最优模型反演了新疆2005-2014年的草地地上生物量,统计分析了地上生物量的空间变化特征。结果表明,新疆草地2010-2014年NDVI<sub>mean</sub>,MSAVI<sub>mean</sub>和PVI<sub>mean</sub>总体上均具有由北向南、由西向东逐渐递减的空间分布特点,不同草地类型的生物量差异显著。2005-2014年低地草甸类的生物量最高,高寒荒漠类最低。统计分析2010-2014年的NDVI<sub>mean</sub>,MSAVI<sub>mean</sub>和PVI<sub>mean</sub>变化趋势发现,北疆有28%以上草地处于改善状态,南疆草地则以稳定为主;全疆14个地、州、市草地以稳定为主,处于稳定比重的草地大于40%,博尔塔拉蒙古自治州、哈密地区、塔城地区、巴音郭楞蒙古自治州草地处于改善状态的草地超过15%,阿勒泰地区、博尔塔拉蒙古自治州、伊犁哈萨克自治州直属、克拉玛依市、昌吉回族自治州、克孜勒苏柯尔克孜自治州、阿克苏地区和乌鲁木齐市轻度改善的草地比重大于10%;除吐鲁番市和乌鲁木齐市外,其余地、州、市恶化草地比重低于10%,全疆草地整体改善以稳定为主,总体趋于良好。
Monitoring of grassland herbage accumulation by remote sensing MOD 09GA data in Xinjiang
[J].
2000—2012年中国北方草地NDVI和气候因子时空变化
[J].
DOI:10.7522/j.issn.1000-694X.2014.00130
[本文引用: 1]
利用2000-2012年的MODIS NDVI数据,结合中国北方187个气象基准站年均温度和年降水量资料,对2000-2012年中国北方草地NDVI的时空变化特征和同期年均温度、降水量动态变化进行了分析。结果表明:(1)草地NDVI无明显变化的区域占北方草地总面积的64.35%,以荒漠草地为主;草地退化区域的面积(占北方草地总面积的23.97%)大于改善区域的面积(占北方草地11.68%)。(2)NDVI变异系数分析结果表明,2000—2012年以来中国北方草地68.37%区域呈稳定状态。其中,荒漠草地植被变异性较小,处于相对稳定状态的草地占其总面积的79.73%;而灌丛草地和典型草地的变异性较大,变化显著的草地分别占其草地面积的41.55%和45.92%。(3)北方草地区中,54.04%的区域年均温度呈升高趋势,大于温度呈降低趋势的区域,温度升高幅度最大为0.159 ℃·a<sup>-1</sup>;年降水量呈增加趋势的面积达71.01%,远大于呈减少趋势的面积,降水量增加的最大幅度为23.29 mm·a<sup>-1</sup>。
Spatio-temporal changes of NDVI and climate factors of grassland in northern China from 2000 to 2012
[J].
基于GLEAM遥感模型的中国1980—2011年地表蒸散发时空变化
[J].
Spatio-temporal variability of terrestrial evapotranspiration in China from 1980 to 2011 based on GLEAM data
[J].
Spatio-temporal variability of terrestrial evapotranspiration in China from 1980 to 2011 based on gleam data
[J].
Magnitude and variability of land evaporation and its components at the global scale
[J].
DOI:10.5194/hess-15-967-2011
URL
[本文引用: 1]
. A process-based methodology is applied to estimate land-surface evaporation from multi-satellite information. GLEAM (Global Land-surface Evaporation: the Amsterdam Methodology) combines a wide range of remotely-sensed observations to derive daily actual evaporation and its different components. Soil water stress conditions are defined from a root-zone profile of soil moisture and used to estimate transpiration based on a Priestley and Taylor equation. The methodology also derives evaporationfrom bare soil and snow sublimation. Tall vegetation rainfall interception is independently estimated by means of the Gash analytical model. Here, GLEAM is applied daily, at global scale and a quarter degree resolution. Triple collocation is used to calculate the error structure of the evaporation estimates and test the relative merits of two different precipitation inputs. The spatial distribution of evaporation – and its different components – is analysed to understand the relative importance of each component over different ecosystems. Annual land evaporation is estimated as 67.9 × 10³ km3, 80% corresponding to transpiration, 11% to interception loss, 7% to bare soil evaporation and 2% snow sublimation. Results show that rainfall interception plays an important role in the partition of precipitation into evaporation and water available for runoff at a continental scale. This study gives insights into the relative importance of precipitation and net radiation in driving evaporation, and how the seasonal influence of these controls varies over different regions. Precipitation is recognised as an important factor driving evaporation, not only in areas that have limited soil water availability, but also in areas of high rainfall interception and low available energy.\n
Multi-scale validation of gleam evapotranspiration products over china via chinaflux et measurements
[J].DOI:10.1080/01431161.2017.1346400 URL [本文引用: 1]
Two decades of anarchy? Emerging themes and outstanding challenges for neural network river forecasting
[J].
DOI:10.1177/0309133312444943
URL
[本文引用: 1]
This paper traces two decades of neural network rainfall-runoff and streamflow modelling, collectively termed ‘river forecasting’. The field is now firmly established and the research community involved has much to offer hydrological science. First, however, it will be necessary to converge on more objective and consistent protocols for: selecting and treating inputs prior to model development; extracting physically meaningful insights from each proposed solution; and improving transparency in the benchmarking and reporting of experimental case studies. It is also clear that neural network river forecasting solutions will have limited appeal for operational purposes until confidence intervals can be attached to forecasts. Modular design, ensemble experiments, and hybridization with conventional hydrological models are yielding new tools for decision-making. The full potential for modelling complex hydrological systems, and for characterizing uncertainty, has yet to be realized. Further gains could also emerge from the provision of an agreed set of benchmark data sets and associated development of superior diagnostics for more rigorous intermodel evaluation. To achieve these goals will require a paradigm shift, such that the mass of individual isolated activities, focused on incremental technical refinement, is replaced by a more coordinated, problem-solving international research body.
Feed-forward vs recurrent neural network models for non-stationarity modelling using data assimilation and adaptivity
[J].DOI:10.1080/02626667.2014.967696 URL [本文引用: 1]
A comparison between wavelet based static and dynamic neural network approaches for runoff prediction
[J].DOI:10.1016/j.jhydrol.2016.01.076 URL [本文引用: 1]
安徽省土壤湿度时空变化规律分析及遥感反演
[J].
Spatiotemporal analysis and remote sensing retrieval of soil moisture across Anhui Province,China
[J].
Neural networks:A comprehensive foundation-Haykin,S
[J].DOI:10.1006/jmps.1997.1164 URL [本文引用: 2]
Comparing sigmoid transfer functions for neural network multistep ahead streamflow forecasting
[J].DOI:10.1061/(ASCE)HE.1943-5584.0000188 URL [本文引用: 2]
Linear relationships between root-zone soil moisture and atmospheric processes in the planetary boundary layer
[J].
The soil moisture active passive (SMAP) mission
[J].DOI:10.1109/JPROC.2010.2043918 URL [本文引用: 1]
Investigating the capabilities of evolutionary data-driven techniques using the challenging estimation of soil moisture content
[J].
DOI:10.2166/hydro.2009.032
URL
[本文引用: 1]
Soil moisture has a crucial role in both the global energy and hydrological cycles; it affects different ecosystem processes. Spatial and temporal variability of soil moisture add to its complex behaviour, which undermines the reliability of most current measurement methods. In this paper, two promising evolutionary data-driven techniques, namely (i) Evolutionary Polynomial Regression and (ii) Genetic Programming, are challenged with modelling the soil moisture response to the near surface atmospheric conditions. The utility of the proposed models is demonstrated through the prediction of the soil moisture response of three experimental soil covers, used for the restoration of watersheds that were disturbed by the mining industry. The results showed that the storage effect of the soil moisture response is the major challenging factor; it can be quantified using cumulative inputs better than time-lag inputs, which can be attributed to the effect of the soil layer moisture-holding capacity. This effect increases with the increase in the soil layer thickness. Three different modelling tools are tested to investigate the tool effect in data-driven modelling. Despite the promising results with regard to the prediction accuracy, the study demonstrates the need for adopting multiple data-driven modelling techniques and tools (modelling environments) to obtain reliable predictions.
On the relevance of using artificial neural networks for estimating soil moisture content
[J].DOI:10.1016/j.jhydrol.2008.08.012 URL [本文引用: 2]
Soil moisture estimation using an artificial neural network:A feasibility study
[J].DOI:10.5589/m04-041 URL [本文引用: 1]
Estimating root zone soil moisture at continental scale using neural networks
[J].DOI:10.1111/jawr.2017.53.issue-1 URL [本文引用: 1]
