Use of NDVI and land surface temperature for drought assessment:Merits and limitations
1
2010
... 日平均气温作为气象站测定的关键要素之一,是反映气候特征的重要指标,同时也是城市热岛效应、农业生态环境等众多研究领域的重要指标.温度异常会导致低温冷害、高温热害、森林火灾以及干旱等农业灾害频发[1⇓⇓-4]; 甚至会影响病虫害、流行病菌等的繁殖和传染[5-6],对粮食安全和人民健康造成严重危害. ...
Application of remote sensing technology in crop chilling injury monitoring
1
2010
... 日平均气温作为气象站测定的关键要素之一,是反映气候特征的重要指标,同时也是城市热岛效应、农业生态环境等众多研究领域的重要指标.温度异常会导致低温冷害、高温热害、森林火灾以及干旱等农业灾害频发[1⇓⇓-4]; 甚至会影响病虫害、流行病菌等的繁殖和传染[5-6],对粮食安全和人民健康造成严重危害. ...
利用MODIS数据反演气温监测夏季高温热害
1
2012
... 日平均气温作为气象站测定的关键要素之一,是反映气候特征的重要指标,同时也是城市热岛效应、农业生态环境等众多研究领域的重要指标.温度异常会导致低温冷害、高温热害、森林火灾以及干旱等农业灾害频发[1⇓⇓-4]; 甚至会影响病虫害、流行病菌等的繁殖和传染[5-6],对粮食安全和人民健康造成严重危害. ...
利用MODIS数据反演气温监测夏季高温热害
1
2012
... 日平均气温作为气象站测定的关键要素之一,是反映气候特征的重要指标,同时也是城市热岛效应、农业生态环境等众多研究领域的重要指标.温度异常会导致低温冷害、高温热害、森林火灾以及干旱等农业灾害频发[1⇓⇓-4]; 甚至会影响病虫害、流行病菌等的繁殖和传染[5-6],对粮食安全和人民健康造成严重危害. ...
Progress in monitoring high-temperature damage to rice through satellite and ground-based optical remote sensing
1
2011
... 日平均气温作为气象站测定的关键要素之一,是反映气候特征的重要指标,同时也是城市热岛效应、农业生态环境等众多研究领域的重要指标.温度异常会导致低温冷害、高温热害、森林火灾以及干旱等农业灾害频发[1⇓⇓-4]; 甚至会影响病虫害、流行病菌等的繁殖和传染[5-6],对粮食安全和人民健康造成严重危害. ...
The potential of pathfinder AVHRR data for providing surrogate climatic variables across Africa and Europe for epidemiological applications
1
2002
... 日平均气温作为气象站测定的关键要素之一,是反映气候特征的重要指标,同时也是城市热岛效应、农业生态环境等众多研究领域的重要指标.温度异常会导致低温冷害、高温热害、森林火灾以及干旱等农业灾害频发[1⇓⇓-4]; 甚至会影响病虫害、流行病菌等的繁殖和传染[5-6],对粮食安全和人民健康造成严重危害. ...
Temporal and spatial assessments of minimum air temperature using satellite surface temperature measurements in Massachusetts,USA
1
2012
... 日平均气温作为气象站测定的关键要素之一,是反映气候特征的重要指标,同时也是城市热岛效应、农业生态环境等众多研究领域的重要指标.温度异常会导致低温冷害、高温热害、森林火灾以及干旱等农业灾害频发[1⇓⇓-4]; 甚至会影响病虫害、流行病菌等的繁殖和传染[5-6],对粮食安全和人民健康造成严重危害. ...
东北地区大豆冷害指标构建及变化特征
2
2021
... 日平均气温作为衡量大气温度的关键指标,一直广泛应用在农学、生态学等众多领域.学者们经常用日平均气温的累积值,定量地描述植物生长所需的热量[7-8].目前大多都是以日为研究单位,构建作物生长模型,以日平均气温为衡量作物生长状况的变量,来研究土壤水分、植被覆盖等分布状况和变化趋势[9⇓-11]; 以日平均气温的累积值作为判断作物不同生育期界限的积温指标[7]、作为衡量作物生长状况的重要指标.气象学中将每日2时、8时、14时、20时4个时刻气温的平均值作为每日平均气温[12].目前,遍布在全球的气象站点能够不间断地提供较为准确的气温数据,这也为日平均气温的获取提供了可靠的数据支持,但是所有站点并不是均匀排列的,导致在空间上很难描述日平均气温的异质性.空间插值作为研究者们常用的日平均气温估算方法,能够实现数据由点向面尺度的转换.尽管空间插值的精度不断改进提高[13-14],但是利用有限的台站数据进行日平均气温反演精度仍然满足不了区域尺度研究需要. ...
... [7]、作为衡量作物生长状况的重要指标.气象学中将每日2时、8时、14时、20时4个时刻气温的平均值作为每日平均气温[12].目前,遍布在全球的气象站点能够不间断地提供较为准确的气温数据,这也为日平均气温的获取提供了可靠的数据支持,但是所有站点并不是均匀排列的,导致在空间上很难描述日平均气温的异质性.空间插值作为研究者们常用的日平均气温估算方法,能够实现数据由点向面尺度的转换.尽管空间插值的精度不断改进提高[13-14],但是利用有限的台站数据进行日平均气温反演精度仍然满足不了区域尺度研究需要. ...
东北地区春玉米不同发育阶段热量指数时空特征
1
2018
... 日平均气温作为衡量大气温度的关键指标,一直广泛应用在农学、生态学等众多领域.学者们经常用日平均气温的累积值,定量地描述植物生长所需的热量[7-8].目前大多都是以日为研究单位,构建作物生长模型,以日平均气温为衡量作物生长状况的变量,来研究土壤水分、植被覆盖等分布状况和变化趋势[9⇓-11]; 以日平均气温的累积值作为判断作物不同生育期界限的积温指标[7]、作为衡量作物生长状况的重要指标.气象学中将每日2时、8时、14时、20时4个时刻气温的平均值作为每日平均气温[12].目前,遍布在全球的气象站点能够不间断地提供较为准确的气温数据,这也为日平均气温的获取提供了可靠的数据支持,但是所有站点并不是均匀排列的,导致在空间上很难描述日平均气温的异质性.空间插值作为研究者们常用的日平均气温估算方法,能够实现数据由点向面尺度的转换.尽管空间插值的精度不断改进提高[13-14],但是利用有限的台站数据进行日平均气温反演精度仍然满足不了区域尺度研究需要. ...
Development and evaluation of the MTVDI for soil moisture monitoring
1
2017
... 日平均气温作为衡量大气温度的关键指标,一直广泛应用在农学、生态学等众多领域.学者们经常用日平均气温的累积值,定量地描述植物生长所需的热量[7-8].目前大多都是以日为研究单位,构建作物生长模型,以日平均气温为衡量作物生长状况的变量,来研究土壤水分、植被覆盖等分布状况和变化趋势[9⇓-11]; 以日平均气温的累积值作为判断作物不同生育期界限的积温指标[7]、作为衡量作物生长状况的重要指标.气象学中将每日2时、8时、14时、20时4个时刻气温的平均值作为每日平均气温[12].目前,遍布在全球的气象站点能够不间断地提供较为准确的气温数据,这也为日平均气温的获取提供了可靠的数据支持,但是所有站点并不是均匀排列的,导致在空间上很难描述日平均气温的异质性.空间插值作为研究者们常用的日平均气温估算方法,能够实现数据由点向面尺度的转换.尽管空间插值的精度不断改进提高[13-14],但是利用有限的台站数据进行日平均气温反演精度仍然满足不了区域尺度研究需要. ...
Modeling air temperature through a combination of remote sensing and GIS data
1
2008
... 日平均气温作为衡量大气温度的关键指标,一直广泛应用在农学、生态学等众多领域.学者们经常用日平均气温的累积值,定量地描述植物生长所需的热量[7-8].目前大多都是以日为研究单位,构建作物生长模型,以日平均气温为衡量作物生长状况的变量,来研究土壤水分、植被覆盖等分布状况和变化趋势[9⇓-11]; 以日平均气温的累积值作为判断作物不同生育期界限的积温指标[7]、作为衡量作物生长状况的重要指标.气象学中将每日2时、8时、14时、20时4个时刻气温的平均值作为每日平均气温[12].目前,遍布在全球的气象站点能够不间断地提供较为准确的气温数据,这也为日平均气温的获取提供了可靠的数据支持,但是所有站点并不是均匀排列的,导致在空间上很难描述日平均气温的异质性.空间插值作为研究者们常用的日平均气温估算方法,能够实现数据由点向面尺度的转换.尽管空间插值的精度不断改进提高[13-14],但是利用有限的台站数据进行日平均气温反演精度仍然满足不了区域尺度研究需要. ...
基于Google Earth Engine和作物模型快速评估低温冷害对大豆生产的影响
1
2020
... 日平均气温作为衡量大气温度的关键指标,一直广泛应用在农学、生态学等众多领域.学者们经常用日平均气温的累积值,定量地描述植物生长所需的热量[7-8].目前大多都是以日为研究单位,构建作物生长模型,以日平均气温为衡量作物生长状况的变量,来研究土壤水分、植被覆盖等分布状况和变化趋势[9⇓-11]; 以日平均气温的累积值作为判断作物不同生育期界限的积温指标[7]、作为衡量作物生长状况的重要指标.气象学中将每日2时、8时、14时、20时4个时刻气温的平均值作为每日平均气温[12].目前,遍布在全球的气象站点能够不间断地提供较为准确的气温数据,这也为日平均气温的获取提供了可靠的数据支持,但是所有站点并不是均匀排列的,导致在空间上很难描述日平均气温的异质性.空间插值作为研究者们常用的日平均气温估算方法,能够实现数据由点向面尺度的转换.尽管空间插值的精度不断改进提高[13-14],但是利用有限的台站数据进行日平均气温反演精度仍然满足不了区域尺度研究需要. ...
日平均气温的两种计算方法比较
1
2002
... 日平均气温作为衡量大气温度的关键指标,一直广泛应用在农学、生态学等众多领域.学者们经常用日平均气温的累积值,定量地描述植物生长所需的热量[7-8].目前大多都是以日为研究单位,构建作物生长模型,以日平均气温为衡量作物生长状况的变量,来研究土壤水分、植被覆盖等分布状况和变化趋势[9⇓-11]; 以日平均气温的累积值作为判断作物不同生育期界限的积温指标[7]、作为衡量作物生长状况的重要指标.气象学中将每日2时、8时、14时、20时4个时刻气温的平均值作为每日平均气温[12].目前,遍布在全球的气象站点能够不间断地提供较为准确的气温数据,这也为日平均气温的获取提供了可靠的数据支持,但是所有站点并不是均匀排列的,导致在空间上很难描述日平均气温的异质性.空间插值作为研究者们常用的日平均气温估算方法,能够实现数据由点向面尺度的转换.尽管空间插值的精度不断改进提高[13-14],但是利用有限的台站数据进行日平均气温反演精度仍然满足不了区域尺度研究需要. ...
基于ANUSPLIN软件的逐日气象要素插值方法应用与评估
1
2010
... 日平均气温作为衡量大气温度的关键指标,一直广泛应用在农学、生态学等众多领域.学者们经常用日平均气温的累积值,定量地描述植物生长所需的热量[7-8].目前大多都是以日为研究单位,构建作物生长模型,以日平均气温为衡量作物生长状况的变量,来研究土壤水分、植被覆盖等分布状况和变化趋势[9⇓-11]; 以日平均气温的累积值作为判断作物不同生育期界限的积温指标[7]、作为衡量作物生长状况的重要指标.气象学中将每日2时、8时、14时、20时4个时刻气温的平均值作为每日平均气温[12].目前,遍布在全球的气象站点能够不间断地提供较为准确的气温数据,这也为日平均气温的获取提供了可靠的数据支持,但是所有站点并不是均匀排列的,导致在空间上很难描述日平均气温的异质性.空间插值作为研究者们常用的日平均气温估算方法,能够实现数据由点向面尺度的转换.尽管空间插值的精度不断改进提高[13-14],但是利用有限的台站数据进行日平均气温反演精度仍然满足不了区域尺度研究需要. ...
Estimating daily land surface temperatures in mountainous environments by reconstructed MODIS LST data
1
2010
... 日平均气温作为衡量大气温度的关键指标,一直广泛应用在农学、生态学等众多领域.学者们经常用日平均气温的累积值,定量地描述植物生长所需的热量[7-8].目前大多都是以日为研究单位,构建作物生长模型,以日平均气温为衡量作物生长状况的变量,来研究土壤水分、植被覆盖等分布状况和变化趋势[9⇓-11]; 以日平均气温的累积值作为判断作物不同生育期界限的积温指标[7]、作为衡量作物生长状况的重要指标.气象学中将每日2时、8时、14时、20时4个时刻气温的平均值作为每日平均气温[12].目前,遍布在全球的气象站点能够不间断地提供较为准确的气温数据,这也为日平均气温的获取提供了可靠的数据支持,但是所有站点并不是均匀排列的,导致在空间上很难描述日平均气温的异质性.空间插值作为研究者们常用的日平均气温估算方法,能够实现数据由点向面尺度的转换.尽管空间插值的精度不断改进提高[13-14],但是利用有限的台站数据进行日平均气温反演精度仍然满足不了区域尺度研究需要. ...
Validation of Landsat land surface temperature product in the conterminous United States using in situ measurements from SURFRAD,ARM,and NDBC sites
1
2021
... 随着卫星遥感领域的高速发展,遥感技术可以实时、动态、宏观监测大区域尺度地理状况的特点,已在霜冻、高温热害等农业灾害空间监测研究中得到充分体现[15⇓-17].近年来,随着基于遥感数据反演地表温度(land surface temperature,LST)算法的精度不断提高[18⇓-20],通过研究日平均气温和LST之间的相关特性来估算日平均气温成为目前研究的新方向.本文通过文献综述,总结了近年来国内外日平均气温所存在的问题和具体的解决方案,最后论述了各种日平均气温遥感估算方法的优缺点,并对未来发展方向和内容进行了展望. ...
黑龙江省冷害对水稻产量的影响
1
2012
... 随着卫星遥感领域的高速发展,遥感技术可以实时、动态、宏观监测大区域尺度地理状况的特点,已在霜冻、高温热害等农业灾害空间监测研究中得到充分体现[15⇓-17].近年来,随着基于遥感数据反演地表温度(land surface temperature,LST)算法的精度不断提高[18⇓-20],通过研究日平均气温和LST之间的相关特性来估算日平均气温成为目前研究的新方向.本文通过文献综述,总结了近年来国内外日平均气温所存在的问题和具体的解决方案,最后论述了各种日平均气温遥感估算方法的优缺点,并对未来发展方向和内容进行了展望. ...
黑龙江省冷害对水稻产量的影响
1
2012
... 随着卫星遥感领域的高速发展,遥感技术可以实时、动态、宏观监测大区域尺度地理状况的特点,已在霜冻、高温热害等农业灾害空间监测研究中得到充分体现[15⇓-17].近年来,随着基于遥感数据反演地表温度(land surface temperature,LST)算法的精度不断提高[18⇓-20],通过研究日平均气温和LST之间的相关特性来估算日平均气温成为目前研究的新方向.本文通过文献综述,总结了近年来国内外日平均气温所存在的问题和具体的解决方案,最后论述了各种日平均气温遥感估算方法的优缺点,并对未来发展方向和内容进行了展望. ...
基于ETM+影像的棉花低温冷害遥感监测方法研究
1
2011
... 随着卫星遥感领域的高速发展,遥感技术可以实时、动态、宏观监测大区域尺度地理状况的特点,已在霜冻、高温热害等农业灾害空间监测研究中得到充分体现[15⇓-17].近年来,随着基于遥感数据反演地表温度(land surface temperature,LST)算法的精度不断提高[18⇓-20],通过研究日平均气温和LST之间的相关特性来估算日平均气温成为目前研究的新方向.本文通过文献综述,总结了近年来国内外日平均气温所存在的问题和具体的解决方案,最后论述了各种日平均气温遥感估算方法的优缺点,并对未来发展方向和内容进行了展望. ...
用NOAA-AVHRR热通道数据演算地表温度的劈窗算法
1
2001
... 随着卫星遥感领域的高速发展,遥感技术可以实时、动态、宏观监测大区域尺度地理状况的特点,已在霜冻、高温热害等农业灾害空间监测研究中得到充分体现[15⇓-17].近年来,随着基于遥感数据反演地表温度(land surface temperature,LST)算法的精度不断提高[18⇓-20],通过研究日平均气温和LST之间的相关特性来估算日平均气温成为目前研究的新方向.本文通过文献综述,总结了近年来国内外日平均气温所存在的问题和具体的解决方案,最后论述了各种日平均气温遥感估算方法的优缺点,并对未来发展方向和内容进行了展望. ...
Validation of the land-surface temperature products retrieved from Terra Moderate Resolution Imaging Spectroradiometer data
1
2002
... 随着卫星遥感领域的高速发展,遥感技术可以实时、动态、宏观监测大区域尺度地理状况的特点,已在霜冻、高温热害等农业灾害空间监测研究中得到充分体现[15⇓-17].近年来,随着基于遥感数据反演地表温度(land surface temperature,LST)算法的精度不断提高[18⇓-20],通过研究日平均气温和LST之间的相关特性来估算日平均气温成为目前研究的新方向.本文通过文献综述,总结了近年来国内外日平均气温所存在的问题和具体的解决方案,最后论述了各种日平均气温遥感估算方法的优缺点,并对未来发展方向和内容进行了展望. ...
FY-3D MERSI-Ⅱ地表温度遥感反演与验证
1
2021
... 随着卫星遥感领域的高速发展,遥感技术可以实时、动态、宏观监测大区域尺度地理状况的特点,已在霜冻、高温热害等农业灾害空间监测研究中得到充分体现[15⇓-17].近年来,随着基于遥感数据反演地表温度(land surface temperature,LST)算法的精度不断提高[18⇓-20],通过研究日平均气温和LST之间的相关特性来估算日平均气温成为目前研究的新方向.本文通过文献综述,总结了近年来国内外日平均气温所存在的问题和具体的解决方案,最后论述了各种日平均气温遥感估算方法的优缺点,并对未来发展方向和内容进行了展望. ...
基于Modis地表温度的横断山区气温估算及其时空规律分析
2
2011
... List of methods for estimating daily mean temperature by remote sensing
Tab.1 | 模型类型 | 算法类型 | 适用范围 | 文献来源 |
| 多元线性回归法 | 全子集回归方法 | 适合平原地区的日平均气温的估算,山区估算误差较大 | 姚永慧等[21];
Colombi等[22];
Zhang等[23];
Benali等[24];
Yang等[25];
Golkar等[26] |
| 标准化回归系数方法 |
| 机器学习方法 | 随机森林 | 适用于山区,地形起伏大,复杂的地区日平均气温估算 | Agathangelidis等[27]; Li等[28]; Moser等[29];
Zhang等[30]; Ho等[31] |
| 支持向量机 |
| 神经网络 |
| 特征空间外推法 | NDVI-LST梯形空间外推法 | 适用于中、高植被覆盖区域的日平均气温的估算 | Sun等[32]; Zhu等[33];侯英雨等[34] |
| NDVI-LST三角形特征空间外推法 |
1.1 多元线性回归法随着对地气温热交换原理的不断探究[35],许多研究者通过开发不同的统计模型来提高日平均气温估算精度,其中最主要的就是多元线性回归模型,即 ...
... 为了进一步降低日平均气温遥感估算误差,研究者们进行了多次模型算法的改进.姚永慧等[21]先估算日间和夜间LST的平均值,再将平均值作为输入参数代入多元线性回归模型中,日平均气温估算的标准误差在2.22~3.05 ℃之间; Colombi等[22]基于LST数据求出卫星过境时刻的瞬时气温,然后依据瞬时气温与日平均气温之间的相关关系推出日平均气温,估算的均方根误差RMSE为1.89 ℃; Zhang等[23]通过实验也证明耦合日间和夜间的LST进行平均气温的估算结果更加准确(残差标准偏差小于3.22 ℃),但会导致可利用的像素大大降低,并提出利用夜间LST进行平均气温的估算适用性更好; Benali等[24]将夜间LST数据作为唯一变量输入日平均气温估算模型中,日平均气温估算误差RMSE为1.5 ℃,相比单独使用日间LST估算的结果(RMSE为2.4 ℃)更精确; Yang等[25]和Golkar等[26]同样证明了利用夜间LST数据进行日平均气温的估算结果更加准确. ...
Estimation of daily mean air temperature from modis lst in alpine areas
3
2007
... List of methods for estimating daily mean temperature by remote sensing
Tab.1 | 模型类型 | 算法类型 | 适用范围 | 文献来源 |
| 多元线性回归法 | 全子集回归方法 | 适合平原地区的日平均气温的估算,山区估算误差较大 | 姚永慧等[21];
Colombi等[22];
Zhang等[23];
Benali等[24];
Yang等[25];
Golkar等[26] |
| 标准化回归系数方法 |
| 机器学习方法 | 随机森林 | 适用于山区,地形起伏大,复杂的地区日平均气温估算 | Agathangelidis等[27]; Li等[28]; Moser等[29];
Zhang等[30]; Ho等[31] |
| 支持向量机 |
| 神经网络 |
| 特征空间外推法 | NDVI-LST梯形空间外推法 | 适用于中、高植被覆盖区域的日平均气温的估算 | Sun等[32]; Zhu等[33];侯英雨等[34] |
| NDVI-LST三角形特征空间外推法 |
1.1 多元线性回归法随着对地气温热交换原理的不断探究[35],许多研究者通过开发不同的统计模型来提高日平均气温估算精度,其中最主要的就是多元线性回归模型,即 ...
... 为了进一步降低日平均气温遥感估算误差,研究者们进行了多次模型算法的改进.姚永慧等[21]先估算日间和夜间LST的平均值,再将平均值作为输入参数代入多元线性回归模型中,日平均气温估算的标准误差在2.22~3.05 ℃之间; Colombi等[22]基于LST数据求出卫星过境时刻的瞬时气温,然后依据瞬时气温与日平均气温之间的相关关系推出日平均气温,估算的均方根误差RMSE为1.89 ℃; Zhang等[23]通过实验也证明耦合日间和夜间的LST进行平均气温的估算结果更加准确(残差标准偏差小于3.22 ℃),但会导致可利用的像素大大降低,并提出利用夜间LST进行平均气温的估算适用性更好; Benali等[24]将夜间LST数据作为唯一变量输入日平均气温估算模型中,日平均气温估算误差RMSE为1.5 ℃,相比单独使用日间LST估算的结果(RMSE为2.4 ℃)更精确; Yang等[25]和Golkar等[26]同样证明了利用夜间LST数据进行日平均气温的估算结果更加准确. ...
... 通过建立LST和植被指数之间的三角形或梯形特征空间关系,达到LST向瞬时气温空间转换的目的,而瞬时气温又与日平均气温高度相关,所以学者们在瞬时气温向日平均气温的时间转换上也做了很多研究,Colombi等[22]基于日间和夜间LST数据求出卫星过境时刻瞬时气温,然后利用正弦曲线近似拟合气温日变化规律,最后通过模拟的气温日变化曲线,估算日平均气温,但是卫星的过境时刻和日最高最低气温出现的时刻常常是不重叠的,日变化曲线拟合误差较大; Zhu等[42]考虑了日长和最低最高气温出现时间的滞后性等,对简单的正弦拟合曲线做了调整,气温估算误差MAE为2.54 ℃.除了依赖于正弦曲线拟合,Sun等[44]提出了一种结合昼夜LST数据和EVI数据估算日平均气温的方法,该方法摆脱了TVX法的局限性,完全独立于辅助数据,分别对平原、山区和高山区3个不同区域进行日平均气温的估算,RMSE分别为1.84 ℃,2.34 ℃和2.45 ℃,具体算法如表2所示. ...
Empirical models for estimating daily maximum,minimum and mean air temperatures with MODIS land surface temperatures
2
2011
... List of methods for estimating daily mean temperature by remote sensing
Tab.1 | 模型类型 | 算法类型 | 适用范围 | 文献来源 |
| 多元线性回归法 | 全子集回归方法 | 适合平原地区的日平均气温的估算,山区估算误差较大 | 姚永慧等[21];
Colombi等[22];
Zhang等[23];
Benali等[24];
Yang等[25];
Golkar等[26] |
| 标准化回归系数方法 |
| 机器学习方法 | 随机森林 | 适用于山区,地形起伏大,复杂的地区日平均气温估算 | Agathangelidis等[27]; Li等[28]; Moser等[29];
Zhang等[30]; Ho等[31] |
| 支持向量机 |
| 神经网络 |
| 特征空间外推法 | NDVI-LST梯形空间外推法 | 适用于中、高植被覆盖区域的日平均气温的估算 | Sun等[32]; Zhu等[33];侯英雨等[34] |
| NDVI-LST三角形特征空间外推法 |
1.1 多元线性回归法随着对地气温热交换原理的不断探究[35],许多研究者通过开发不同的统计模型来提高日平均气温估算精度,其中最主要的就是多元线性回归模型,即 ...
... 为了进一步降低日平均气温遥感估算误差,研究者们进行了多次模型算法的改进.姚永慧等[21]先估算日间和夜间LST的平均值,再将平均值作为输入参数代入多元线性回归模型中,日平均气温估算的标准误差在2.22~3.05 ℃之间; Colombi等[22]基于LST数据求出卫星过境时刻的瞬时气温,然后依据瞬时气温与日平均气温之间的相关关系推出日平均气温,估算的均方根误差RMSE为1.89 ℃; Zhang等[23]通过实验也证明耦合日间和夜间的LST进行平均气温的估算结果更加准确(残差标准偏差小于3.22 ℃),但会导致可利用的像素大大降低,并提出利用夜间LST进行平均气温的估算适用性更好; Benali等[24]将夜间LST数据作为唯一变量输入日平均气温估算模型中,日平均气温估算误差RMSE为1.5 ℃,相比单独使用日间LST估算的结果(RMSE为2.4 ℃)更精确; Yang等[25]和Golkar等[26]同样证明了利用夜间LST数据进行日平均气温的估算结果更加准确. ...
Estimating air surface temperature in Portugal using MODIS LST data
2
2012
... List of methods for estimating daily mean temperature by remote sensing
Tab.1 | 模型类型 | 算法类型 | 适用范围 | 文献来源 |
| 多元线性回归法 | 全子集回归方法 | 适合平原地区的日平均气温的估算,山区估算误差较大 | 姚永慧等[21];
Colombi等[22];
Zhang等[23];
Benali等[24];
Yang等[25];
Golkar等[26] |
| 标准化回归系数方法 |
| 机器学习方法 | 随机森林 | 适用于山区,地形起伏大,复杂的地区日平均气温估算 | Agathangelidis等[27]; Li等[28]; Moser等[29];
Zhang等[30]; Ho等[31] |
| 支持向量机 |
| 神经网络 |
| 特征空间外推法 | NDVI-LST梯形空间外推法 | 适用于中、高植被覆盖区域的日平均气温的估算 | Sun等[32]; Zhu等[33];侯英雨等[34] |
| NDVI-LST三角形特征空间外推法 |
1.1 多元线性回归法随着对地气温热交换原理的不断探究[35],许多研究者通过开发不同的统计模型来提高日平均气温估算精度,其中最主要的就是多元线性回归模型,即 ...
... 为了进一步降低日平均气温遥感估算误差,研究者们进行了多次模型算法的改进.姚永慧等[21]先估算日间和夜间LST的平均值,再将平均值作为输入参数代入多元线性回归模型中,日平均气温估算的标准误差在2.22~3.05 ℃之间; Colombi等[22]基于LST数据求出卫星过境时刻的瞬时气温,然后依据瞬时气温与日平均气温之间的相关关系推出日平均气温,估算的均方根误差RMSE为1.89 ℃; Zhang等[23]通过实验也证明耦合日间和夜间的LST进行平均气温的估算结果更加准确(残差标准偏差小于3.22 ℃),但会导致可利用的像素大大降低,并提出利用夜间LST进行平均气温的估算适用性更好; Benali等[24]将夜间LST数据作为唯一变量输入日平均气温估算模型中,日平均气温估算误差RMSE为1.5 ℃,相比单独使用日间LST估算的结果(RMSE为2.4 ℃)更精确; Yang等[25]和Golkar等[26]同样证明了利用夜间LST数据进行日平均气温的估算结果更加准确. ...
Evaluation of MODIS land surface temperature data to estimate near-surface air temperature in Northeast China
2
2017
... List of methods for estimating daily mean temperature by remote sensing
Tab.1 | 模型类型 | 算法类型 | 适用范围 | 文献来源 |
| 多元线性回归法 | 全子集回归方法 | 适合平原地区的日平均气温的估算,山区估算误差较大 | 姚永慧等[21];
Colombi等[22];
Zhang等[23];
Benali等[24];
Yang等[25];
Golkar等[26] |
| 标准化回归系数方法 |
| 机器学习方法 | 随机森林 | 适用于山区,地形起伏大,复杂的地区日平均气温估算 | Agathangelidis等[27]; Li等[28]; Moser等[29];
Zhang等[30]; Ho等[31] |
| 支持向量机 |
| 神经网络 |
| 特征空间外推法 | NDVI-LST梯形空间外推法 | 适用于中、高植被覆盖区域的日平均气温的估算 | Sun等[32]; Zhu等[33];侯英雨等[34] |
| NDVI-LST三角形特征空间外推法 |
1.1 多元线性回归法随着对地气温热交换原理的不断探究[35],许多研究者通过开发不同的统计模型来提高日平均气温估算精度,其中最主要的就是多元线性回归模型,即 ...
... 为了进一步降低日平均气温遥感估算误差,研究者们进行了多次模型算法的改进.姚永慧等[21]先估算日间和夜间LST的平均值,再将平均值作为输入参数代入多元线性回归模型中,日平均气温估算的标准误差在2.22~3.05 ℃之间; Colombi等[22]基于LST数据求出卫星过境时刻的瞬时气温,然后依据瞬时气温与日平均气温之间的相关关系推出日平均气温,估算的均方根误差RMSE为1.89 ℃; Zhang等[23]通过实验也证明耦合日间和夜间的LST进行平均气温的估算结果更加准确(残差标准偏差小于3.22 ℃),但会导致可利用的像素大大降低,并提出利用夜间LST进行平均气温的估算适用性更好; Benali等[24]将夜间LST数据作为唯一变量输入日平均气温估算模型中,日平均气温估算误差RMSE为1.5 ℃,相比单独使用日间LST估算的结果(RMSE为2.4 ℃)更精确; Yang等[25]和Golkar等[26]同样证明了利用夜间LST数据进行日平均气温的估算结果更加准确. ...
Estimation of instantaneous air temperature using remote sensing data
2
2018
... List of methods for estimating daily mean temperature by remote sensing
Tab.1 | 模型类型 | 算法类型 | 适用范围 | 文献来源 |
| 多元线性回归法 | 全子集回归方法 | 适合平原地区的日平均气温的估算,山区估算误差较大 | 姚永慧等[21];
Colombi等[22];
Zhang等[23];
Benali等[24];
Yang等[25];
Golkar等[26] |
| 标准化回归系数方法 |
| 机器学习方法 | 随机森林 | 适用于山区,地形起伏大,复杂的地区日平均气温估算 | Agathangelidis等[27]; Li等[28]; Moser等[29];
Zhang等[30]; Ho等[31] |
| 支持向量机 |
| 神经网络 |
| 特征空间外推法 | NDVI-LST梯形空间外推法 | 适用于中、高植被覆盖区域的日平均气温的估算 | Sun等[32]; Zhu等[33];侯英雨等[34] |
| NDVI-LST三角形特征空间外推法 |
1.1 多元线性回归法随着对地气温热交换原理的不断探究[35],许多研究者通过开发不同的统计模型来提高日平均气温估算精度,其中最主要的就是多元线性回归模型,即 ...
... 为了进一步降低日平均气温遥感估算误差,研究者们进行了多次模型算法的改进.姚永慧等[21]先估算日间和夜间LST的平均值,再将平均值作为输入参数代入多元线性回归模型中,日平均气温估算的标准误差在2.22~3.05 ℃之间; Colombi等[22]基于LST数据求出卫星过境时刻的瞬时气温,然后依据瞬时气温与日平均气温之间的相关关系推出日平均气温,估算的均方根误差RMSE为1.89 ℃; Zhang等[23]通过实验也证明耦合日间和夜间的LST进行平均气温的估算结果更加准确(残差标准偏差小于3.22 ℃),但会导致可利用的像素大大降低,并提出利用夜间LST进行平均气温的估算适用性更好; Benali等[24]将夜间LST数据作为唯一变量输入日平均气温估算模型中,日平均气温估算误差RMSE为1.5 ℃,相比单独使用日间LST估算的结果(RMSE为2.4 ℃)更精确; Yang等[25]和Golkar等[26]同样证明了利用夜间LST数据进行日平均气温的估算结果更加准确. ...
Estimation of air temperatures for the urban agglomeration of Athens with the use of satellite data
2
2016
... List of methods for estimating daily mean temperature by remote sensing
Tab.1 | 模型类型 | 算法类型 | 适用范围 | 文献来源 |
| 多元线性回归法 | 全子集回归方法 | 适合平原地区的日平均气温的估算,山区估算误差较大 | 姚永慧等[21];
Colombi等[22];
Zhang等[23];
Benali等[24];
Yang等[25];
Golkar等[26] |
| 标准化回归系数方法 |
| 机器学习方法 | 随机森林 | 适用于山区,地形起伏大,复杂的地区日平均气温估算 | Agathangelidis等[27]; Li等[28]; Moser等[29];
Zhang等[30]; Ho等[31] |
| 支持向量机 |
| 神经网络 |
| 特征空间外推法 | NDVI-LST梯形空间外推法 | 适用于中、高植被覆盖区域的日平均气温的估算 | Sun等[32]; Zhu等[33];侯英雨等[34] |
| NDVI-LST三角形特征空间外推法 |
1.1 多元线性回归法随着对地气温热交换原理的不断探究[35],许多研究者通过开发不同的统计模型来提高日平均气温估算精度,其中最主要的就是多元线性回归模型,即 ...
... 神经网络是一个不断学习的系统,根据逻辑规则进行信息的推理,通过调节系统内部节点与节点之间的关联关系,进行信息的高效处理.在气温遥感估算的研究中通常需要考虑众多影响因子,神经网络学习方法具备处理复杂问题的能力,近年在气温估算中被广为使用.Agathangelidis等[27]利用多时相MSG-SEVIRI遥感数据,采用多项式回归和人工神经网络的方法,将LST和气温观测值相结合估算希腊雅典的气温,RMSE为1.0~2.0 ℃. ...
Machine learning approaches for forest classification and change analysis using multi-temporal Landsat TM images over Huntington Wildlife Forest
2
2013
... List of methods for estimating daily mean temperature by remote sensing
Tab.1 | 模型类型 | 算法类型 | 适用范围 | 文献来源 |
| 多元线性回归法 | 全子集回归方法 | 适合平原地区的日平均气温的估算,山区估算误差较大 | 姚永慧等[21];
Colombi等[22];
Zhang等[23];
Benali等[24];
Yang等[25];
Golkar等[26] |
| 标准化回归系数方法 |
| 机器学习方法 | 随机森林 | 适用于山区,地形起伏大,复杂的地区日平均气温估算 | Agathangelidis等[27]; Li等[28]; Moser等[29];
Zhang等[30]; Ho等[31] |
| 支持向量机 |
| 神经网络 |
| 特征空间外推法 | NDVI-LST梯形空间外推法 | 适用于中、高植被覆盖区域的日平均气温的估算 | Sun等[32]; Zhu等[33];侯英雨等[34] |
| NDVI-LST三角形特征空间外推法 |
1.1 多元线性回归法随着对地气温热交换原理的不断探究[35],许多研究者通过开发不同的统计模型来提高日平均气温估算精度,其中最主要的就是多元线性回归模型,即 ...
... 支持向量机是机器学习的一种,具有很强的稀疏性和稳健性.近年来,被广泛用在气温遥感估算相关研究中.使用支持向量机来模拟卫星遥感数据与气象台站观测数据之间的关系,基于支持向量机的监督模式识别方法,进行气温反演.Li等[28]使用随机森林和支持向量机 2种机器学习方法,基于MODIS LST数据进行气温动态估算的算法精度比较,实验证明这2种机器学习算法都能够提供很好的结果.与支持向量机相比,随机森林在很少的参数设置和可变性下具有更大的优势; 相反,支持向量机具有更大的机动性来调整核函数,以更好地处理多种复杂的数据集.Moser等[29]将基于支持向量机监测陆地和海洋表面温度的方法推广到气温估算上,提出了基于支持向量机的卫星影像周期气温估算新方法.气温估算平均绝对误差MAE为2.37 ℃. ...
Estimation of air surface temperature from remote sensing images and pixelwise modeling of the estimation uncertainty through support vector machines
2
2015
... List of methods for estimating daily mean temperature by remote sensing
Tab.1 | 模型类型 | 算法类型 | 适用范围 | 文献来源 |
| 多元线性回归法 | 全子集回归方法 | 适合平原地区的日平均气温的估算,山区估算误差较大 | 姚永慧等[21];
Colombi等[22];
Zhang等[23];
Benali等[24];
Yang等[25];
Golkar等[26] |
| 标准化回归系数方法 |
| 机器学习方法 | 随机森林 | 适用于山区,地形起伏大,复杂的地区日平均气温估算 | Agathangelidis等[27]; Li等[28]; Moser等[29];
Zhang等[30]; Ho等[31] |
| 支持向量机 |
| 神经网络 |
| 特征空间外推法 | NDVI-LST梯形空间外推法 | 适用于中、高植被覆盖区域的日平均气温的估算 | Sun等[32]; Zhu等[33];侯英雨等[34] |
| NDVI-LST三角形特征空间外推法 |
1.1 多元线性回归法随着对地气温热交换原理的不断探究[35],许多研究者通过开发不同的统计模型来提高日平均气温估算精度,其中最主要的就是多元线性回归模型,即 ...
... 支持向量机是机器学习的一种,具有很强的稀疏性和稳健性.近年来,被广泛用在气温遥感估算相关研究中.使用支持向量机来模拟卫星遥感数据与气象台站观测数据之间的关系,基于支持向量机的监督模式识别方法,进行气温反演.Li等[28]使用随机森林和支持向量机 2种机器学习方法,基于MODIS LST数据进行气温动态估算的算法精度比较,实验证明这2种机器学习算法都能够提供很好的结果.与支持向量机相比,随机森林在很少的参数设置和可变性下具有更大的优势; 相反,支持向量机具有更大的机动性来调整核函数,以更好地处理多种复杂的数据集.Moser等[29]将基于支持向量机监测陆地和海洋表面温度的方法推广到气温估算上,提出了基于支持向量机的卫星影像周期气温估算新方法.气温估算平均绝对误差MAE为2.37 ℃. ...
Estimating daily air temperatures over the Tibetan Plateau by dynamically integrating MODIS LST data
3
2016
... List of methods for estimating daily mean temperature by remote sensing
Tab.1 | 模型类型 | 算法类型 | 适用范围 | 文献来源 |
| 多元线性回归法 | 全子集回归方法 | 适合平原地区的日平均气温的估算,山区估算误差较大 | 姚永慧等[21];
Colombi等[22];
Zhang等[23];
Benali等[24];
Yang等[25];
Golkar等[26] |
| 标准化回归系数方法 |
| 机器学习方法 | 随机森林 | 适用于山区,地形起伏大,复杂的地区日平均气温估算 | Agathangelidis等[27]; Li等[28]; Moser等[29];
Zhang等[30]; Ho等[31] |
| 支持向量机 |
| 神经网络 |
| 特征空间外推法 | NDVI-LST梯形空间外推法 | 适用于中、高植被覆盖区域的日平均气温的估算 | Sun等[32]; Zhu等[33];侯英雨等[34] |
| NDVI-LST三角形特征空间外推法 |
1.1 多元线性回归法随着对地气温热交换原理的不断探究[35],许多研究者通过开发不同的统计模型来提高日平均气温估算精度,其中最主要的就是多元线性回归模型,即 ...
... 随机森林是由多个决策树共同构成的分类器,是目前最盛行的回归算法之一,已经在遥感信息处理中得到广泛的使用.近年来,随着对气温估算结果的精度要求越来越高,随机森林已经开始用于气温的遥感估算当中.随机森林方法最早是由Zhang等[30]和Ho等[31]用于气温估算,Ho等[31]使用2种机器学习方法支持向量机和随机森林以及普通最小二乘回归,根据陆地卫星数据绘制温哥华的城市气温变化图,RMSE为2.31 ℃; Zhang等[30]根据气温估算精度随着MODIS LST项和其他项之间的组合不同、数据质量差异不同而不断变化的规律,利用随机森林机器学习方法动态整合可用的LST项来估算青藏高原的日平均气温,有效地提高了青藏高原低云干扰下气温遥感估算的准确性,日平均气温遥感估算误差RMSE为2.0 ℃; Xu等[39]采用多元线性回归和随机森林2种统计方法,根据MODIS数据估算哥伦比亚省2003—2012年夏季日最高气温,结果显示这2种方法都适用于复杂地形山区的气温估算,RMSE分别为2.41 ℃和2.02 ℃; 邢立亭等[40]基于随机森林算法,利用MODIS LST数据估算兰州市日最高和最低气温,估算误差MAE分别为1.344 ℃和1.218 ℃. ...
... [30]根据气温估算精度随着MODIS LST项和其他项之间的组合不同、数据质量差异不同而不断变化的规律,利用随机森林机器学习方法动态整合可用的LST项来估算青藏高原的日平均气温,有效地提高了青藏高原低云干扰下气温遥感估算的准确性,日平均气温遥感估算误差RMSE为2.0 ℃; Xu等[39]采用多元线性回归和随机森林2种统计方法,根据MODIS数据估算哥伦比亚省2003—2012年夏季日最高气温,结果显示这2种方法都适用于复杂地形山区的气温估算,RMSE分别为2.41 ℃和2.02 ℃; 邢立亭等[40]基于随机森林算法,利用MODIS LST数据估算兰州市日最高和最低气温,估算误差MAE分别为1.344 ℃和1.218 ℃. ...
Mapping maximum urban air temperature on hot summer days
3
2014
... List of methods for estimating daily mean temperature by remote sensing
Tab.1 | 模型类型 | 算法类型 | 适用范围 | 文献来源 |
| 多元线性回归法 | 全子集回归方法 | 适合平原地区的日平均气温的估算,山区估算误差较大 | 姚永慧等[21];
Colombi等[22];
Zhang等[23];
Benali等[24];
Yang等[25];
Golkar等[26] |
| 标准化回归系数方法 |
| 机器学习方法 | 随机森林 | 适用于山区,地形起伏大,复杂的地区日平均气温估算 | Agathangelidis等[27]; Li等[28]; Moser等[29];
Zhang等[30]; Ho等[31] |
| 支持向量机 |
| 神经网络 |
| 特征空间外推法 | NDVI-LST梯形空间外推法 | 适用于中、高植被覆盖区域的日平均气温的估算 | Sun等[32]; Zhu等[33];侯英雨等[34] |
| NDVI-LST三角形特征空间外推法 |
1.1 多元线性回归法随着对地气温热交换原理的不断探究[35],许多研究者通过开发不同的统计模型来提高日平均气温估算精度,其中最主要的就是多元线性回归模型,即 ...
... 随机森林是由多个决策树共同构成的分类器,是目前最盛行的回归算法之一,已经在遥感信息处理中得到广泛的使用.近年来,随着对气温估算结果的精度要求越来越高,随机森林已经开始用于气温的遥感估算当中.随机森林方法最早是由Zhang等[30]和Ho等[31]用于气温估算,Ho等[31]使用2种机器学习方法支持向量机和随机森林以及普通最小二乘回归,根据陆地卫星数据绘制温哥华的城市气温变化图,RMSE为2.31 ℃; Zhang等[30]根据气温估算精度随着MODIS LST项和其他项之间的组合不同、数据质量差异不同而不断变化的规律,利用随机森林机器学习方法动态整合可用的LST项来估算青藏高原的日平均气温,有效地提高了青藏高原低云干扰下气温遥感估算的准确性,日平均气温遥感估算误差RMSE为2.0 ℃; Xu等[39]采用多元线性回归和随机森林2种统计方法,根据MODIS数据估算哥伦比亚省2003—2012年夏季日最高气温,结果显示这2种方法都适用于复杂地形山区的气温估算,RMSE分别为2.41 ℃和2.02 ℃; 邢立亭等[40]基于随机森林算法,利用MODIS LST数据估算兰州市日最高和最低气温,估算误差MAE分别为1.344 ℃和1.218 ℃. ...
... [31]使用2种机器学习方法支持向量机和随机森林以及普通最小二乘回归,根据陆地卫星数据绘制温哥华的城市气温变化图,RMSE为2.31 ℃; Zhang等[30]根据气温估算精度随着MODIS LST项和其他项之间的组合不同、数据质量差异不同而不断变化的规律,利用随机森林机器学习方法动态整合可用的LST项来估算青藏高原的日平均气温,有效地提高了青藏高原低云干扰下气温遥感估算的准确性,日平均气温遥感估算误差RMSE为2.0 ℃; Xu等[39]采用多元线性回归和随机森林2种统计方法,根据MODIS数据估算哥伦比亚省2003—2012年夏季日最高气温,结果显示这2种方法都适用于复杂地形山区的气温估算,RMSE分别为2.41 ℃和2.02 ℃; 邢立亭等[40]基于随机森林算法,利用MODIS LST数据估算兰州市日最高和最低气温,估算误差MAE分别为1.344 ℃和1.218 ℃. ...
Estimating mean air temperature using MODIS day and night land surface temperatures
1
2014
... List of methods for estimating daily mean temperature by remote sensing
Tab.1 | 模型类型 | 算法类型 | 适用范围 | 文献来源 |
| 多元线性回归法 | 全子集回归方法 | 适合平原地区的日平均气温的估算,山区估算误差较大 | 姚永慧等[21];
Colombi等[22];
Zhang等[23];
Benali等[24];
Yang等[25];
Golkar等[26] |
| 标准化回归系数方法 |
| 机器学习方法 | 随机森林 | 适用于山区,地形起伏大,复杂的地区日平均气温估算 | Agathangelidis等[27]; Li等[28]; Moser等[29];
Zhang等[30]; Ho等[31] |
| 支持向量机 |
| 神经网络 |
| 特征空间外推法 | NDVI-LST梯形空间外推法 | 适用于中、高植被覆盖区域的日平均气温的估算 | Sun等[32]; Zhu等[33];侯英雨等[34] |
| NDVI-LST三角形特征空间外推法 |
1.1 多元线性回归法随着对地气温热交换原理的不断探究[35],许多研究者通过开发不同的统计模型来提高日平均气温估算精度,其中最主要的就是多元线性回归模型,即 ...
A time domain solution of the modified temperature vegetation dryness index (MTVDI) for continuous soil moisture monitoring
3
2017
... List of methods for estimating daily mean temperature by remote sensing
Tab.1 | 模型类型 | 算法类型 | 适用范围 | 文献来源 |
| 多元线性回归法 | 全子集回归方法 | 适合平原地区的日平均气温的估算,山区估算误差较大 | 姚永慧等[21];
Colombi等[22];
Zhang等[23];
Benali等[24];
Yang等[25];
Golkar等[26] |
| 标准化回归系数方法 |
| 机器学习方法 | 随机森林 | 适用于山区,地形起伏大,复杂的地区日平均气温估算 | Agathangelidis等[27]; Li等[28]; Moser等[29];
Zhang等[30]; Ho等[31] |
| 支持向量机 |
| 神经网络 |
| 特征空间外推法 | NDVI-LST梯形空间外推法 | 适用于中、高植被覆盖区域的日平均气温的估算 | Sun等[32]; Zhu等[33];侯英雨等[34] |
| NDVI-LST三角形特征空间外推法 |
1.1 多元线性回归法随着对地气温热交换原理的不断探究[35],许多研究者通过开发不同的统计模型来提高日平均气温估算精度,其中最主要的就是多元线性回归模型,即 ...
... Zhu等[42]采用温度植被指数分析法(temperature vegetation indes,TVX),将LST和植被指数之间的负相关系阈值降至0.1后,成功利用TVX方法基于MODIS陆地卫星估算了日最高和最低气温,估算误差MAE分别为3.03 ℃和2.37 ℃.Nemani等[43]研究认为LST随着NDVI的增大而降低,在全覆盖条件下,植被冠层的温度和空气温度几乎相等,因此基于NDVI和LST两者的空间特征关系估算近地表气温; 侯英雨等[34]通过分析NDVI和LST之间的相关关系,建立了梯形空间特征模型,对中、高植被区域的近地表气温进行了估算,稀疏植被区域和中高植被区域的近地表气温反演绝对误差分别为1.5~1.8 ℃和1.61 ℃,但随着NDVI的不断变化,地表水分的易变性增强,NDVI和LST之间的三角形或梯形关系不明确,这种情况下很难保证TVX关系的准确性; Sun等[44]提出了利用MODIS昼夜LST数据和增强植被指数(enhanced vegetation index,EVI),从昼夜LST差值和光谱植被指数特征空间改进TVX方法估算气温,结果表明该方法在EVI和昼夜LST差值较大的地区适用性相对来说较高,估算误差RMSE为2.38 ℃左右.另外,在研究特征空间的干边时,通常都是通过回归等经验方案直接从遥感散点图中得到,所以研究结果通常具有一定的主观性和不确定性.为了克服这些缺点,Sun等[44]开发了一种高级温度干燥指数,通过表面能量平衡原理确定理论干边,但是该方法需要输入大量参数,结果的误差来源较多,难以控制; Zhu等[42]针对这个问题提出了一种新的指数——修正温度植被干度指数,以减少参数化方案对干边的依赖,气温估算误差RMSE 为2.28 K,与Zhu等[33]和Sun等[44]反演精度相当. ...
... List of methods for air temperature estimation extrapolated from characteristic space
Tab.2 | 特征空间模型 | 模型算法① | 算法精度 | 文献来源 |
| TVX | | RMSE为3.43 ℃
MAE为2.54 ℃ | Zhu等[33] |
| NDVI-LST空间三角形和梯形 | | 稀疏植被覆盖区
MAE为1.5~1.8 ℃
中高植被覆盖区MAE为1.61 ℃ | 侯英雨等[34] |
| EVI-LST空间三角形和梯形 | | 平原区RMSE为1.84 K
山区RMSE为2.34 K
高山区RMSE为2.45 K | Sun等[44] |
①式中: Ts为地表温度; NDVI为归一化植被指数; NDVImax为区域最大归一化植被指数值; at,i和bt,i分别为系统常量; Tmax和Tmin分别为最高温度和最低温度; t为具体时刻,h; Ta,t为t时刻对应的空气温度; tdl为日间时长; 为太阳正午和最高气温之间的滞后时间; 当NDVIi为区域最大归一化植被指数值时,TLSTNDVIi,max和TLSTNDVIi,min分别对应最大和最小空气温度; 当NDVIi为区域最小归一化植被指数值时,TLSTNDVIi,max和TLSTNDVIi,min分别对应最大和最小裸土地表温度; b1,b2,c1和c2分别为常量; TLSTNDVIi为某一区域对应的地表温度; Ta为NDVIi下的空气温度; Ta,max和Ta,min分别为最大和最小空气温度; 为日平均气温; EVI为增强植被指数; EVIc为多年浓密冠层EVI平均值; 和 分别为日间和夜间的LST. ...
利用卫星遥感资料估算区域尺度空气温度
3
2010
... List of methods for estimating daily mean temperature by remote sensing
Tab.1 | 模型类型 | 算法类型 | 适用范围 | 文献来源 |
| 多元线性回归法 | 全子集回归方法 | 适合平原地区的日平均气温的估算,山区估算误差较大 | 姚永慧等[21];
Colombi等[22];
Zhang等[23];
Benali等[24];
Yang等[25];
Golkar等[26] |
| 标准化回归系数方法 |
| 机器学习方法 | 随机森林 | 适用于山区,地形起伏大,复杂的地区日平均气温估算 | Agathangelidis等[27]; Li等[28]; Moser等[29];
Zhang等[30]; Ho等[31] |
| 支持向量机 |
| 神经网络 |
| 特征空间外推法 | NDVI-LST梯形空间外推法 | 适用于中、高植被覆盖区域的日平均气温的估算 | Sun等[32]; Zhu等[33];侯英雨等[34] |
| NDVI-LST三角形特征空间外推法 |
1.1 多元线性回归法随着对地气温热交换原理的不断探究[35],许多研究者通过开发不同的统计模型来提高日平均气温估算精度,其中最主要的就是多元线性回归模型,即 ...
... Zhu等[42]采用温度植被指数分析法(temperature vegetation indes,TVX),将LST和植被指数之间的负相关系阈值降至0.1后,成功利用TVX方法基于MODIS陆地卫星估算了日最高和最低气温,估算误差MAE分别为3.03 ℃和2.37 ℃.Nemani等[43]研究认为LST随着NDVI的增大而降低,在全覆盖条件下,植被冠层的温度和空气温度几乎相等,因此基于NDVI和LST两者的空间特征关系估算近地表气温; 侯英雨等[34]通过分析NDVI和LST之间的相关关系,建立了梯形空间特征模型,对中、高植被区域的近地表气温进行了估算,稀疏植被区域和中高植被区域的近地表气温反演绝对误差分别为1.5~1.8 ℃和1.61 ℃,但随着NDVI的不断变化,地表水分的易变性增强,NDVI和LST之间的三角形或梯形关系不明确,这种情况下很难保证TVX关系的准确性; Sun等[44]提出了利用MODIS昼夜LST数据和增强植被指数(enhanced vegetation index,EVI),从昼夜LST差值和光谱植被指数特征空间改进TVX方法估算气温,结果表明该方法在EVI和昼夜LST差值较大的地区适用性相对来说较高,估算误差RMSE为2.38 ℃左右.另外,在研究特征空间的干边时,通常都是通过回归等经验方案直接从遥感散点图中得到,所以研究结果通常具有一定的主观性和不确定性.为了克服这些缺点,Sun等[44]开发了一种高级温度干燥指数,通过表面能量平衡原理确定理论干边,但是该方法需要输入大量参数,结果的误差来源较多,难以控制; Zhu等[42]针对这个问题提出了一种新的指数——修正温度植被干度指数,以减少参数化方案对干边的依赖,气温估算误差RMSE 为2.28 K,与Zhu等[33]和Sun等[44]反演精度相当. ...
... List of methods for air temperature estimation extrapolated from characteristic space
Tab.2 | 特征空间模型 | 模型算法① | 算法精度 | 文献来源 |
| TVX | | RMSE为3.43 ℃
MAE为2.54 ℃ | Zhu等[33] |
| NDVI-LST空间三角形和梯形 | | 稀疏植被覆盖区
MAE为1.5~1.8 ℃
中高植被覆盖区MAE为1.61 ℃ | 侯英雨等[34] |
| EVI-LST空间三角形和梯形 | | 平原区RMSE为1.84 K
山区RMSE为2.34 K
高山区RMSE为2.45 K | Sun等[44] |
①式中: Ts为地表温度; NDVI为归一化植被指数; NDVImax为区域最大归一化植被指数值; at,i和bt,i分别为系统常量; Tmax和Tmin分别为最高温度和最低温度; t为具体时刻,h; Ta,t为t时刻对应的空气温度; tdl为日间时长; 为太阳正午和最高气温之间的滞后时间; 当NDVIi为区域最大归一化植被指数值时,TLSTNDVIi,max和TLSTNDVIi,min分别对应最大和最小空气温度; 当NDVIi为区域最小归一化植被指数值时,TLSTNDVIi,max和TLSTNDVIi,min分别对应最大和最小裸土地表温度; b1,b2,c1和c2分别为常量; TLSTNDVIi为某一区域对应的地表温度; Ta为NDVIi下的空气温度; Ta,max和Ta,min分别为最大和最小空气温度; 为日平均气温; EVI为增强植被指数; EVIc为多年浓密冠层EVI平均值; 和 分别为日间和夜间的LST. ...
气温遥感估算方法研究综述
1
2014
... 随着对地气温热交换原理的不断探究[35],许多研究者通过开发不同的统计模型来提高日平均气温估算精度,其中最主要的就是多元线性回归模型,即 ...
气温遥感估算方法研究综述
1
2014
... 随着对地气温热交换原理的不断探究[35],许多研究者通过开发不同的统计模型来提高日平均气温估算精度,其中最主要的就是多元线性回归模型,即 ...
Evaluation of MODIS land surface temperature data to estimate air temperature in different ecosystems over Africa
2
2010
... 式中: T为平均气温; a0,a1,a2,a3,…,an分别为模型回归系数; x1,x2,x3,…,xn分别为影响日平均气温的变量因子,如LST、经纬度、高程、下垫面类型(植被指数)、太阳天顶角等[36-37]; 为扰动项.随着研究不断深入,发现儒略日、夜间LST等在日平均气温估算中的重要性相比纬度、太阳天顶角等辅助数据要略高一些.Janatian等[37]利用中分辨率成像光谱仪(MODIS)日间和夜间时间产品和儒略日、海拔和波段反射率等共11个影响因子建立统计模型,进行气温的估算,实验结果证明,夜间产品数据、海拔和儒略日是研究气温变化最有效的变量.为了处理单时相遥感数据与对应的日平均气温地面监测数据构建的反演模型估算结果无法大范围使用且估算误差较大等问题,研究者们提出了分季度、分时相建模,以满足不同情况下的日平均气温反演需求.Vancutsem等[36]将日间MODIS LST数据与日最高气温实测值进行相关性分析,结果表明,随着季节性的变化,太阳辐射和云量等不断变化,两者的差异也不断变化,表明了地区不同或季节发生改变都会使LST和气温之间的相关性发生显著变化; 祝善友等[38]将极轨气象卫星热红外数据和对应的气象台站监测数据进行耦合,创建分季度和分时相的2种气温估算模型,最后综合两者的优势,建立较为稳定和适用的模型. ...
... [36]将日间MODIS LST数据与日最高气温实测值进行相关性分析,结果表明,随着季节性的变化,太阳辐射和云量等不断变化,两者的差异也不断变化,表明了地区不同或季节发生改变都会使LST和气温之间的相关性发生显著变化; 祝善友等[38]将极轨气象卫星热红外数据和对应的气象台站监测数据进行耦合,创建分季度和分时相的2种气温估算模型,最后综合两者的优势,建立较为稳定和适用的模型. ...
A statistical framework for estimating air temperature using MODIS land surface temperature data
2
2017
... 式中: T为平均气温; a0,a1,a2,a3,…,an分别为模型回归系数; x1,x2,x3,…,xn分别为影响日平均气温的变量因子,如LST、经纬度、高程、下垫面类型(植被指数)、太阳天顶角等[36-37]; 为扰动项.随着研究不断深入,发现儒略日、夜间LST等在日平均气温估算中的重要性相比纬度、太阳天顶角等辅助数据要略高一些.Janatian等[37]利用中分辨率成像光谱仪(MODIS)日间和夜间时间产品和儒略日、海拔和波段反射率等共11个影响因子建立统计模型,进行气温的估算,实验结果证明,夜间产品数据、海拔和儒略日是研究气温变化最有效的变量.为了处理单时相遥感数据与对应的日平均气温地面监测数据构建的反演模型估算结果无法大范围使用且估算误差较大等问题,研究者们提出了分季度、分时相建模,以满足不同情况下的日平均气温反演需求.Vancutsem等[36]将日间MODIS LST数据与日最高气温实测值进行相关性分析,结果表明,随着季节性的变化,太阳辐射和云量等不断变化,两者的差异也不断变化,表明了地区不同或季节发生改变都会使LST和气温之间的相关性发生显著变化; 祝善友等[38]将极轨气象卫星热红外数据和对应的气象台站监测数据进行耦合,创建分季度和分时相的2种气温估算模型,最后综合两者的优势,建立较为稳定和适用的模型. ...
... [37]利用中分辨率成像光谱仪(MODIS)日间和夜间时间产品和儒略日、海拔和波段反射率等共11个影响因子建立统计模型,进行气温的估算,实验结果证明,夜间产品数据、海拔和儒略日是研究气温变化最有效的变量.为了处理单时相遥感数据与对应的日平均气温地面监测数据构建的反演模型估算结果无法大范围使用且估算误差较大等问题,研究者们提出了分季度、分时相建模,以满足不同情况下的日平均气温反演需求.Vancutsem等[36]将日间MODIS LST数据与日最高气温实测值进行相关性分析,结果表明,随着季节性的变化,太阳辐射和云量等不断变化,两者的差异也不断变化,表明了地区不同或季节发生改变都会使LST和气温之间的相关性发生显著变化; 祝善友等[38]将极轨气象卫星热红外数据和对应的气象台站监测数据进行耦合,创建分季度和分时相的2种气温估算模型,最后综合两者的优势,建立较为稳定和适用的模型. ...
基于多源极轨气象卫星热红外数据的近地表气温反演研究
1
2009
... 式中: T为平均气温; a0,a1,a2,a3,…,an分别为模型回归系数; x1,x2,x3,…,xn分别为影响日平均气温的变量因子,如LST、经纬度、高程、下垫面类型(植被指数)、太阳天顶角等[36-37]; 为扰动项.随着研究不断深入,发现儒略日、夜间LST等在日平均气温估算中的重要性相比纬度、太阳天顶角等辅助数据要略高一些.Janatian等[37]利用中分辨率成像光谱仪(MODIS)日间和夜间时间产品和儒略日、海拔和波段反射率等共11个影响因子建立统计模型,进行气温的估算,实验结果证明,夜间产品数据、海拔和儒略日是研究气温变化最有效的变量.为了处理单时相遥感数据与对应的日平均气温地面监测数据构建的反演模型估算结果无法大范围使用且估算误差较大等问题,研究者们提出了分季度、分时相建模,以满足不同情况下的日平均气温反演需求.Vancutsem等[36]将日间MODIS LST数据与日最高气温实测值进行相关性分析,结果表明,随着季节性的变化,太阳辐射和云量等不断变化,两者的差异也不断变化,表明了地区不同或季节发生改变都会使LST和气温之间的相关性发生显著变化; 祝善友等[38]将极轨气象卫星热红外数据和对应的气象台站监测数据进行耦合,创建分季度和分时相的2种气温估算模型,最后综合两者的优势,建立较为稳定和适用的模型. ...
Estimating daily maximum air temperature from MODIS in British Columbia,Canada
1
2014
... 随机森林是由多个决策树共同构成的分类器,是目前最盛行的回归算法之一,已经在遥感信息处理中得到广泛的使用.近年来,随着对气温估算结果的精度要求越来越高,随机森林已经开始用于气温的遥感估算当中.随机森林方法最早是由Zhang等[30]和Ho等[31]用于气温估算,Ho等[31]使用2种机器学习方法支持向量机和随机森林以及普通最小二乘回归,根据陆地卫星数据绘制温哥华的城市气温变化图,RMSE为2.31 ℃; Zhang等[30]根据气温估算精度随着MODIS LST项和其他项之间的组合不同、数据质量差异不同而不断变化的规律,利用随机森林机器学习方法动态整合可用的LST项来估算青藏高原的日平均气温,有效地提高了青藏高原低云干扰下气温遥感估算的准确性,日平均气温遥感估算误差RMSE为2.0 ℃; Xu等[39]采用多元线性回归和随机森林2种统计方法,根据MODIS数据估算哥伦比亚省2003—2012年夏季日最高气温,结果显示这2种方法都适用于复杂地形山区的气温估算,RMSE分别为2.41 ℃和2.02 ℃; 邢立亭等[40]基于随机森林算法,利用MODIS LST数据估算兰州市日最高和最低气温,估算误差MAE分别为1.344 ℃和1.218 ℃. ...
基于MODIS和随机森林的兰州市日最高气温和最低气温估算
1
2020
... 随机森林是由多个决策树共同构成的分类器,是目前最盛行的回归算法之一,已经在遥感信息处理中得到广泛的使用.近年来,随着对气温估算结果的精度要求越来越高,随机森林已经开始用于气温的遥感估算当中.随机森林方法最早是由Zhang等[30]和Ho等[31]用于气温估算,Ho等[31]使用2种机器学习方法支持向量机和随机森林以及普通最小二乘回归,根据陆地卫星数据绘制温哥华的城市气温变化图,RMSE为2.31 ℃; Zhang等[30]根据气温估算精度随着MODIS LST项和其他项之间的组合不同、数据质量差异不同而不断变化的规律,利用随机森林机器学习方法动态整合可用的LST项来估算青藏高原的日平均气温,有效地提高了青藏高原低云干扰下气温遥感估算的准确性,日平均气温遥感估算误差RMSE为2.0 ℃; Xu等[39]采用多元线性回归和随机森林2种统计方法,根据MODIS数据估算哥伦比亚省2003—2012年夏季日最高气温,结果显示这2种方法都适用于复杂地形山区的气温估算,RMSE分别为2.41 ℃和2.02 ℃; 邢立亭等[40]基于随机森林算法,利用MODIS LST数据估算兰州市日最高和最低气温,估算误差MAE分别为1.344 ℃和1.218 ℃. ...
Inference of surface and air temperature,atmospheric precipitable water and vapor pressure deficit using Advanced Very High-Resolution Radiometer satellite observations:Comparison with field observations
3
1998
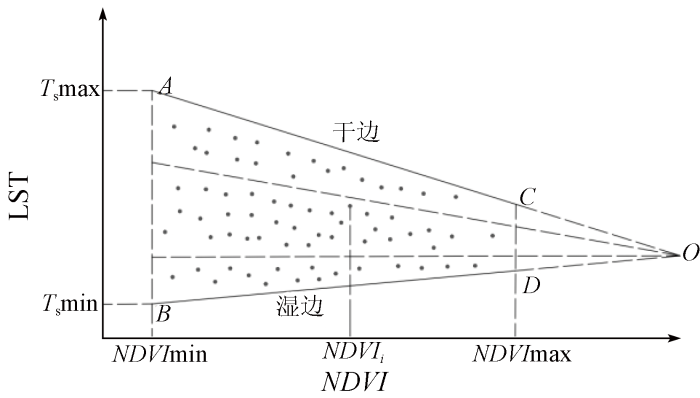
... 日平均气温遥感估算通常有2种形式,一种是利用热红外数据反演的LST与日平均气温之间的相关性推算出来; 另一种则是利用Prince等[41]最早提出的三角形或梯形特征空间,将LST变化与归一化植被指数(normalized difference vegetation index,NDVI)联系起来估算日平均气温.由于LST对植被覆盖区土壤含水量的敏感程度远远低于裸土区,所以LST与NDVI在空间上呈三角形或梯形关系.如图1所示,其中横轴代表NDVI,纵轴代表LST,AB对应植被指数较低的裸土情况,CD则对应浓密植被冠层下的情况,AC和BD相交于O点,OA称为干边,OB称为湿边,两线之间的斜线代表土壤的不同植被状态. ...
... [
41]
Schematic diagram of <i>NDVI-T<sub>s</sub></i> characteristic space<sup>[<xref ref-type="bibr" rid="b41">41</xref>]</sup>Fig.1![]() 1.3.1 瞬时气温的估算
1.3.1 瞬时气温的估算Zhu等[42]采用温度植被指数分析法(temperature vegetation indes,TVX),将LST和植被指数之间的负相关系阈值降至0.1后,成功利用TVX方法基于MODIS陆地卫星估算了日最高和最低气温,估算误差MAE分别为3.03 ℃和2.37 ℃.Nemani等[43]研究认为LST随着NDVI的增大而降低,在全覆盖条件下,植被冠层的温度和空气温度几乎相等,因此基于NDVI和LST两者的空间特征关系估算近地表气温; 侯英雨等[34]通过分析NDVI和LST之间的相关关系,建立了梯形空间特征模型,对中、高植被区域的近地表气温进行了估算,稀疏植被区域和中高植被区域的近地表气温反演绝对误差分别为1.5~1.8 ℃和1.61 ℃,但随着NDVI的不断变化,地表水分的易变性增强,NDVI和LST之间的三角形或梯形关系不明确,这种情况下很难保证TVX关系的准确性; Sun等[44]提出了利用MODIS昼夜LST数据和增强植被指数(enhanced vegetation index,EVI),从昼夜LST差值和光谱植被指数特征空间改进TVX方法估算气温,结果表明该方法在EVI和昼夜LST差值较大的地区适用性相对来说较高,估算误差RMSE为2.38 ℃左右.另外,在研究特征空间的干边时,通常都是通过回归等经验方案直接从遥感散点图中得到,所以研究结果通常具有一定的主观性和不确定性.为了克服这些缺点,Sun等[44]开发了一种高级温度干燥指数,通过表面能量平衡原理确定理论干边,但是该方法需要输入大量参数,结果的误差来源较多,难以控制; Zhu等[42]针对这个问题提出了一种新的指数——修正温度植被干度指数,以减少参数化方案对干边的依赖,气温估算误差RMSE 为2.28 K,与Zhu等[33]和Sun等[44]反演精度相当. ...
... [
41]
Fig.1![]() 1.3.1 瞬时气温的估算
1.3.1 瞬时气温的估算Zhu等[42]采用温度植被指数分析法(temperature vegetation indes,TVX),将LST和植被指数之间的负相关系阈值降至0.1后,成功利用TVX方法基于MODIS陆地卫星估算了日最高和最低气温,估算误差MAE分别为3.03 ℃和2.37 ℃.Nemani等[43]研究认为LST随着NDVI的增大而降低,在全覆盖条件下,植被冠层的温度和空气温度几乎相等,因此基于NDVI和LST两者的空间特征关系估算近地表气温; 侯英雨等[34]通过分析NDVI和LST之间的相关关系,建立了梯形空间特征模型,对中、高植被区域的近地表气温进行了估算,稀疏植被区域和中高植被区域的近地表气温反演绝对误差分别为1.5~1.8 ℃和1.61 ℃,但随着NDVI的不断变化,地表水分的易变性增强,NDVI和LST之间的三角形或梯形关系不明确,这种情况下很难保证TVX关系的准确性; Sun等[44]提出了利用MODIS昼夜LST数据和增强植被指数(enhanced vegetation index,EVI),从昼夜LST差值和光谱植被指数特征空间改进TVX方法估算气温,结果表明该方法在EVI和昼夜LST差值较大的地区适用性相对来说较高,估算误差RMSE为2.38 ℃左右.另外,在研究特征空间的干边时,通常都是通过回归等经验方案直接从遥感散点图中得到,所以研究结果通常具有一定的主观性和不确定性.为了克服这些缺点,Sun等[44]开发了一种高级温度干燥指数,通过表面能量平衡原理确定理论干边,但是该方法需要输入大量参数,结果的误差来源较多,难以控制; Zhu等[42]针对这个问题提出了一种新的指数——修正温度植被干度指数,以减少参数化方案对干边的依赖,气温估算误差RMSE 为2.28 K,与Zhu等[33]和Sun等[44]反演精度相当. ...
Estimation of daily maximum and minimum air temperature using MODIS land surface temperature products
4
2013
... Zhu等[42]采用温度植被指数分析法(temperature vegetation indes,TVX),将LST和植被指数之间的负相关系阈值降至0.1后,成功利用TVX方法基于MODIS陆地卫星估算了日最高和最低气温,估算误差MAE分别为3.03 ℃和2.37 ℃.Nemani等[43]研究认为LST随着NDVI的增大而降低,在全覆盖条件下,植被冠层的温度和空气温度几乎相等,因此基于NDVI和LST两者的空间特征关系估算近地表气温; 侯英雨等[34]通过分析NDVI和LST之间的相关关系,建立了梯形空间特征模型,对中、高植被区域的近地表气温进行了估算,稀疏植被区域和中高植被区域的近地表气温反演绝对误差分别为1.5~1.8 ℃和1.61 ℃,但随着NDVI的不断变化,地表水分的易变性增强,NDVI和LST之间的三角形或梯形关系不明确,这种情况下很难保证TVX关系的准确性; Sun等[44]提出了利用MODIS昼夜LST数据和增强植被指数(enhanced vegetation index,EVI),从昼夜LST差值和光谱植被指数特征空间改进TVX方法估算气温,结果表明该方法在EVI和昼夜LST差值较大的地区适用性相对来说较高,估算误差RMSE为2.38 ℃左右.另外,在研究特征空间的干边时,通常都是通过回归等经验方案直接从遥感散点图中得到,所以研究结果通常具有一定的主观性和不确定性.为了克服这些缺点,Sun等[44]开发了一种高级温度干燥指数,通过表面能量平衡原理确定理论干边,但是该方法需要输入大量参数,结果的误差来源较多,难以控制; Zhu等[42]针对这个问题提出了一种新的指数——修正温度植被干度指数,以减少参数化方案对干边的依赖,气温估算误差RMSE 为2.28 K,与Zhu等[33]和Sun等[44]反演精度相当. ...
... [42]针对这个问题提出了一种新的指数——修正温度植被干度指数,以减少参数化方案对干边的依赖,气温估算误差RMSE 为2.28 K,与Zhu等[33]和Sun等[44]反演精度相当. ...
... 通过建立LST和植被指数之间的三角形或梯形特征空间关系,达到LST向瞬时气温空间转换的目的,而瞬时气温又与日平均气温高度相关,所以学者们在瞬时气温向日平均气温的时间转换上也做了很多研究,Colombi等[22]基于日间和夜间LST数据求出卫星过境时刻瞬时气温,然后利用正弦曲线近似拟合气温日变化规律,最后通过模拟的气温日变化曲线,估算日平均气温,但是卫星的过境时刻和日最高最低气温出现的时刻常常是不重叠的,日变化曲线拟合误差较大; Zhu等[42]考虑了日长和最低最高气温出现时间的滞后性等,对简单的正弦拟合曲线做了调整,气温估算误差MAE为2.54 ℃.除了依赖于正弦曲线拟合,Sun等[44]提出了一种结合昼夜LST数据和EVI数据估算日平均气温的方法,该方法摆脱了TVX法的局限性,完全独立于辅助数据,分别对平原、山区和高山区3个不同区域进行日平均气温的估算,RMSE分别为1.84 ℃,2.34 ℃和2.45 ℃,具体算法如表2所示. ...
... 利用LST数据估算日平均气温时,仅使用晴空像元可以得到较高的估算精度,但会造成像元的大量缺失,对数据连续性造成很大影响,需要对云干扰像元进行空间插值,直接利用气象台站观测值进行插值误差较大,Zhu等[42]基于MODIS数据产品,对中国柴达木盆地东部和美国南部大平原2个气候条件完全不同地区的晴空和多元条件下的气温进行估算,结果表明,晴空条件下的估算误差RMSE分别为1.95 ℃和2.5 ℃; 多云条件下的估算误差RMSE分别为3.42 ℃和2.91 ℃.特别是多云条件下的估算精度已达到了与传统利用气象站数据进行空间插补方法相当的水平,有很大的应用前景. ...
Estimation of regional surface resistance to evapotranspiration from NDVI and thermal-IR AVHRR data
1
1989
... Zhu等[42]采用温度植被指数分析法(temperature vegetation indes,TVX),将LST和植被指数之间的负相关系阈值降至0.1后,成功利用TVX方法基于MODIS陆地卫星估算了日最高和最低气温,估算误差MAE分别为3.03 ℃和2.37 ℃.Nemani等[43]研究认为LST随着NDVI的增大而降低,在全覆盖条件下,植被冠层的温度和空气温度几乎相等,因此基于NDVI和LST两者的空间特征关系估算近地表气温; 侯英雨等[34]通过分析NDVI和LST之间的相关关系,建立了梯形空间特征模型,对中、高植被区域的近地表气温进行了估算,稀疏植被区域和中高植被区域的近地表气温反演绝对误差分别为1.5~1.8 ℃和1.61 ℃,但随着NDVI的不断变化,地表水分的易变性增强,NDVI和LST之间的三角形或梯形关系不明确,这种情况下很难保证TVX关系的准确性; Sun等[44]提出了利用MODIS昼夜LST数据和增强植被指数(enhanced vegetation index,EVI),从昼夜LST差值和光谱植被指数特征空间改进TVX方法估算气温,结果表明该方法在EVI和昼夜LST差值较大的地区适用性相对来说较高,估算误差RMSE为2.38 ℃左右.另外,在研究特征空间的干边时,通常都是通过回归等经验方案直接从遥感散点图中得到,所以研究结果通常具有一定的主观性和不确定性.为了克服这些缺点,Sun等[44]开发了一种高级温度干燥指数,通过表面能量平衡原理确定理论干边,但是该方法需要输入大量参数,结果的误差来源较多,难以控制; Zhu等[42]针对这个问题提出了一种新的指数——修正温度植被干度指数,以减少参数化方案对干边的依赖,气温估算误差RMSE 为2.28 K,与Zhu等[33]和Sun等[44]反演精度相当. ...
Monitoring surface soil moisture status based on remotely sensed surface temperature and vegetation index information
5
2012
... Zhu等[42]采用温度植被指数分析法(temperature vegetation indes,TVX),将LST和植被指数之间的负相关系阈值降至0.1后,成功利用TVX方法基于MODIS陆地卫星估算了日最高和最低气温,估算误差MAE分别为3.03 ℃和2.37 ℃.Nemani等[43]研究认为LST随着NDVI的增大而降低,在全覆盖条件下,植被冠层的温度和空气温度几乎相等,因此基于NDVI和LST两者的空间特征关系估算近地表气温; 侯英雨等[34]通过分析NDVI和LST之间的相关关系,建立了梯形空间特征模型,对中、高植被区域的近地表气温进行了估算,稀疏植被区域和中高植被区域的近地表气温反演绝对误差分别为1.5~1.8 ℃和1.61 ℃,但随着NDVI的不断变化,地表水分的易变性增强,NDVI和LST之间的三角形或梯形关系不明确,这种情况下很难保证TVX关系的准确性; Sun等[44]提出了利用MODIS昼夜LST数据和增强植被指数(enhanced vegetation index,EVI),从昼夜LST差值和光谱植被指数特征空间改进TVX方法估算气温,结果表明该方法在EVI和昼夜LST差值较大的地区适用性相对来说较高,估算误差RMSE为2.38 ℃左右.另外,在研究特征空间的干边时,通常都是通过回归等经验方案直接从遥感散点图中得到,所以研究结果通常具有一定的主观性和不确定性.为了克服这些缺点,Sun等[44]开发了一种高级温度干燥指数,通过表面能量平衡原理确定理论干边,但是该方法需要输入大量参数,结果的误差来源较多,难以控制; Zhu等[42]针对这个问题提出了一种新的指数——修正温度植被干度指数,以减少参数化方案对干边的依赖,气温估算误差RMSE 为2.28 K,与Zhu等[33]和Sun等[44]反演精度相当. ...
... [44]开发了一种高级温度干燥指数,通过表面能量平衡原理确定理论干边,但是该方法需要输入大量参数,结果的误差来源较多,难以控制; Zhu等[42]针对这个问题提出了一种新的指数——修正温度植被干度指数,以减少参数化方案对干边的依赖,气温估算误差RMSE 为2.28 K,与Zhu等[33]和Sun等[44]反演精度相当. ...
... [44]反演精度相当. ...
... 通过建立LST和植被指数之间的三角形或梯形特征空间关系,达到LST向瞬时气温空间转换的目的,而瞬时气温又与日平均气温高度相关,所以学者们在瞬时气温向日平均气温的时间转换上也做了很多研究,Colombi等[22]基于日间和夜间LST数据求出卫星过境时刻瞬时气温,然后利用正弦曲线近似拟合气温日变化规律,最后通过模拟的气温日变化曲线,估算日平均气温,但是卫星的过境时刻和日最高最低气温出现的时刻常常是不重叠的,日变化曲线拟合误差较大; Zhu等[42]考虑了日长和最低最高气温出现时间的滞后性等,对简单的正弦拟合曲线做了调整,气温估算误差MAE为2.54 ℃.除了依赖于正弦曲线拟合,Sun等[44]提出了一种结合昼夜LST数据和EVI数据估算日平均气温的方法,该方法摆脱了TVX法的局限性,完全独立于辅助数据,分别对平原、山区和高山区3个不同区域进行日平均气温的估算,RMSE分别为1.84 ℃,2.34 ℃和2.45 ℃,具体算法如表2所示. ...
... List of methods for air temperature estimation extrapolated from characteristic space
Tab.2 | 特征空间模型 | 模型算法① | 算法精度 | 文献来源 |
| TVX | | RMSE为3.43 ℃
MAE为2.54 ℃ | Zhu等[33] |
| NDVI-LST空间三角形和梯形 | | 稀疏植被覆盖区
MAE为1.5~1.8 ℃
中高植被覆盖区MAE为1.61 ℃ | 侯英雨等[34] |
| EVI-LST空间三角形和梯形 | | 平原区RMSE为1.84 K
山区RMSE为2.34 K
高山区RMSE为2.45 K | Sun等[44] |
①式中: Ts为地表温度; NDVI为归一化植被指数; NDVImax为区域最大归一化植被指数值; at,i和bt,i分别为系统常量; Tmax和Tmin分别为最高温度和最低温度; t为具体时刻,h; Ta,t为t时刻对应的空气温度; tdl为日间时长; 为太阳正午和最高气温之间的滞后时间; 当NDVIi为区域最大归一化植被指数值时,TLSTNDVIi,max和TLSTNDVIi,min分别对应最大和最小空气温度; 当NDVIi为区域最小归一化植被指数值时,TLSTNDVIi,max和TLSTNDVIi,min分别对应最大和最小裸土地表温度; b1,b2,c1和c2分别为常量; TLSTNDVIi为某一区域对应的地表温度; Ta为NDVIi下的空气温度; Ta,max和Ta,min分别为最大和最小空气温度; 为日平均气温; EVI为增强植被指数; EVIc为多年浓密冠层EVI平均值; 和 分别为日间和夜间的LST. ...
Estimation of net radiation from the MODIS data under all sky conditions:Southern Great Plains case study
1
2010
... LST数据产品的质量不仅跟反演的精度有关,而且跟云干扰的程度和范围有很大关系.Bisht等[45]使用MODIS云产品为MODIS卫星过境时刻内的云覆盖区域提供有关云顶温度、云分数、云发射率和云光学厚度等信息,结合地面测量数据进行统计回归,估算近地表气温,全覆盖范围近地表气温估算误差RMSE为2.76 ℃,整体上基本实现了只利用遥感数据就能获取较为精确的全覆盖近地表气温. ...
Retrievals of all-weather daytime air temperature from MODIS products
1
2017
... 云干扰导致数据的大量缺失,限制了很多温度相关的应用研究,特别是积温的计算方法,从而限制了以积温作为评价指标的作物农业灾害监测方法的研究.针对云干扰下的气温遥感估算,研究者们尝试利用微波遥感进行研究[46⇓-48],但是微波遥感空间分辨率较低、时间连续性较差,这些都严重阻碍了微波遥感在气温估算研究中的进展.针对这些问题,学者们也提出了综合微波和热红外数据进行LST的估算[49],但是时空差异极大地限制了两者在LST估算中的应用,如何降低两者LST反演的差异是提高最后气温估算精度的关键.所以,如何提高云干扰下的日平均气温遥感估算精度仍然值得进一步的探究. ...
Retrieving high-resolution surface soil moisture by downscaling AMSR-E brightness temperature using MODIS LST and NDVI data
1
2014
... 云干扰导致数据的大量缺失,限制了很多温度相关的应用研究,特别是积温的计算方法,从而限制了以积温作为评价指标的作物农业灾害监测方法的研究.针对云干扰下的气温遥感估算,研究者们尝试利用微波遥感进行研究[46⇓-48],但是微波遥感空间分辨率较低、时间连续性较差,这些都严重阻碍了微波遥感在气温估算研究中的进展.针对这些问题,学者们也提出了综合微波和热红外数据进行LST的估算[49],但是时空差异极大地限制了两者在LST估算中的应用,如何降低两者LST反演的差异是提高最后气温估算精度的关键.所以,如何提高云干扰下的日平均气温遥感估算精度仍然值得进一步的探究. ...
Retrieving K-band instantaneous microwave land surface emissivity based on passive microwave brightness temperature and atmospheric precipitable water vapor data
1
2017
... 云干扰导致数据的大量缺失,限制了很多温度相关的应用研究,特别是积温的计算方法,从而限制了以积温作为评价指标的作物农业灾害监测方法的研究.针对云干扰下的气温遥感估算,研究者们尝试利用微波遥感进行研究[46⇓-48],但是微波遥感空间分辨率较低、时间连续性较差,这些都严重阻碍了微波遥感在气温估算研究中的进展.针对这些问题,学者们也提出了综合微波和热红外数据进行LST的估算[49],但是时空差异极大地限制了两者在LST估算中的应用,如何降低两者LST反演的差异是提高最后气温估算精度的关键.所以,如何提高云干扰下的日平均气温遥感估算精度仍然值得进一步的探究. ...
Estimation of 1-km all-weather remotely sensed land surface temperature based on reconstructed spatial-seamless satellite passive microwave brightness temperature and thermal infrared data
1
2020
... 云干扰导致数据的大量缺失,限制了很多温度相关的应用研究,特别是积温的计算方法,从而限制了以积温作为评价指标的作物农业灾害监测方法的研究.针对云干扰下的气温遥感估算,研究者们尝试利用微波遥感进行研究[46⇓-48],但是微波遥感空间分辨率较低、时间连续性较差,这些都严重阻碍了微波遥感在气温估算研究中的进展.针对这些问题,学者们也提出了综合微波和热红外数据进行LST的估算[49],但是时空差异极大地限制了两者在LST估算中的应用,如何降低两者LST反演的差异是提高最后气温估算精度的关键.所以,如何提高云干扰下的日平均气温遥感估算精度仍然值得进一步的探究. ...
Land surface temperature retrieval from Landsat8 TIRS:Comparison between radiative transfer equation-based method,split window algorithm and single channel method
1
2014
... LST遥感估算的准确性直接影响到日平均气温估算的精度,多通道算法是目前应用最广泛的LST遥感估算方法之一,该算法对传感器限制条件少且不依赖于大气廓线数据,所以一直被广泛使用[50⇓-52].多通道算法是基于不同通道对水汽吸收具有不同的特性,利用相近或相邻热红外通道信息线性化处理辐射传输方程.但是,季节和区域的变化会对该方法的处理结果精度造成很大的影响.相比其他季节,夏季的校正精度较高一些; 与低纬度地区的亮度温度与水汽之间的函数关系相比,中、高纬度地区要稳定一点.因此,在实际的LST反演时,根据区域和季节的不同,建立不同的模型,以保证大气校正的准确性. ...
Landsat8数据地表温度反演算法对比
1
2015
... LST遥感估算的准确性直接影响到日平均气温估算的精度,多通道算法是目前应用最广泛的LST遥感估算方法之一,该算法对传感器限制条件少且不依赖于大气廓线数据,所以一直被广泛使用[50⇓-52].多通道算法是基于不同通道对水汽吸收具有不同的特性,利用相近或相邻热红外通道信息线性化处理辐射传输方程.但是,季节和区域的变化会对该方法的处理结果精度造成很大的影响.相比其他季节,夏季的校正精度较高一些; 与低纬度地区的亮度温度与水汽之间的函数关系相比,中、高纬度地区要稳定一点.因此,在实际的LST反演时,根据区域和季节的不同,建立不同的模型,以保证大气校正的准确性. ...
Himawari8 AHI数据地表温度反演的实用劈窗算法
1
2017
... LST遥感估算的准确性直接影响到日平均气温估算的精度,多通道算法是目前应用最广泛的LST遥感估算方法之一,该算法对传感器限制条件少且不依赖于大气廓线数据,所以一直被广泛使用[50⇓-52].多通道算法是基于不同通道对水汽吸收具有不同的特性,利用相近或相邻热红外通道信息线性化处理辐射传输方程.但是,季节和区域的变化会对该方法的处理结果精度造成很大的影响.相比其他季节,夏季的校正精度较高一些; 与低纬度地区的亮度温度与水汽之间的函数关系相比,中、高纬度地区要稳定一点.因此,在实际的LST反演时,根据区域和季节的不同,建立不同的模型,以保证大气校正的准确性. ...
1
2016
... 多通道算法在校正大气水汽吸收时,对于气溶胶的影响基本都是忽略不计的,但大气气溶胶对辐射传输过程会造成很大的影响: 太阳总辐射量减少、LST降低等.随着城市工业化发展进程不断加快,大气气溶胶含量不断升高,气溶胶对LST反演算法性能影响不容忽视.近年来,研究者们也不断尝试各种算法来降低LST反演时气溶胶的影响[53⇓-55]. ...
1
2016
... 多通道算法在校正大气水汽吸收时,对于气溶胶的影响基本都是忽略不计的,但大气气溶胶对辐射传输过程会造成很大的影响: 太阳总辐射量减少、LST降低等.随着城市工业化发展进程不断加快,大气气溶胶含量不断升高,气溶胶对LST反演算法性能影响不容忽视.近年来,研究者们也不断尝试各种算法来降低LST反演时气溶胶的影响[53⇓-55]. ...
Influence of aerosol radiative effects on surface temperature and snow melt in the Himalayan region
1
2022
... 多通道算法在校正大气水汽吸收时,对于气溶胶的影响基本都是忽略不计的,但大气气溶胶对辐射传输过程会造成很大的影响: 太阳总辐射量减少、LST降低等.随着城市工业化发展进程不断加快,大气气溶胶含量不断升高,气溶胶对LST反演算法性能影响不容忽视.近年来,研究者们也不断尝试各种算法来降低LST反演时气溶胶的影响[53⇓-55]. ...
Investigation of aerosol effects on the Arctic surface temperature during the diurnal cycle:Part 2-Separating aerosol effects
1
2017
... 多通道算法在校正大气水汽吸收时,对于气溶胶的影响基本都是忽略不计的,但大气气溶胶对辐射传输过程会造成很大的影响: 太阳总辐射量减少、LST降低等.随着城市工业化发展进程不断加快,大气气溶胶含量不断升高,气溶胶对LST反演算法性能影响不容忽视.近年来,研究者们也不断尝试各种算法来降低LST反演时气溶胶的影响[53⇓-55]. ...
A remote sensing method for estimating surface air temperature and surface vapor pressure on a regional scale
1
2015
... 太阳辐射、下垫面性质和大气环流是空气温度的3大驱动因子.研究区的气象条件和地表性质是决定近地表气温的主要因素,而大气环流下的水平平流是决定它们的外来因素.在太阳辐射和下垫面2个驱动因子影响下得到的空气温度仅具有局地代表性,想要获取区域尺度上真实的空气温度还必须加权计算大气环流下的水平平流驱动因子形成的外来空气温度.Zhang等[56]考虑局部驱动力和水平平流的影响,利用遥感数据和气象数据估算地面气温,发现估计值与气象站测量值有很强的相关性,实验3 d气温估算RMSE分别为0.42 K,0.35 K和0.20 K.如何充分认识和利用大气环流驱动力实现气温数据的高精度估算很值得做进一步的探究. ...


