

0 引言
耕地资源是人类赖以生存的重要物质基础和生产资料,土壤pH值作为耕地土壤关键属性之一,不仅是影响农作物生长发育的重要因素,也是影响土壤养分有效性和土壤重金属元素迁移转换的关键因子[1]。但是,随着人类社会工业化进程加快,酸性气体(SO2)、颗粒污染物排放以及氮肥的大量施用等,使得土壤酸化在许多地方成为一个普遍的趋势[2⇓-4]。张福锁院士团队在Science上发表的研究结果表明,从20世纪80年代—21世纪初,中国主要农作物产区土壤pH值明显下降[5]。土壤酸化会增加土壤重金属的活性,不利于农作物健康生长,进而威胁中国的粮食生产安全,这一问题在中国南方地区尤为突出[6-7]。因此,获得准确的土壤pH值空间分布信息对于遏制土壤酸化趋势、保护土壤环境质量和保障粮食生产安全具有十分重要的意义和价值。
国内外许多研究学者使用地统计学等空间插值方法用于土壤属性空间信息的预测,主要有普通克里格插值法(ordinary Kriging,OK)、反距离权重插值法(inverse distance weighted,IDW)、普通最小二乘法(ordinary least squares,OLS)、地理加权回归(geographically weighted regression,GWR)等[6,8⇓⇓⇓-12]。近年来,随着计算机技术、卫星遥感和土壤近地传感器等技术的快速发展,机器学习算法应用于数字土壤制图(digital soil mapping,DSM)成为一个新的研究热点[13⇓⇓⇓⇓⇓⇓⇓-21]。张甘霖等[22]指出: DSM未来有从地统计学走向机器学习为主导模型的趋势。随机森林(random forest,RF)作为一种以数据为驱动的机器学习方法[23],具有训练速度快、对多元线性不敏感、易于处理缺失数据等优点,还可避免对模型的过度拟合[24⇓-26]。RF能够获取和表达土壤属性空间变化与环境变量的复杂非线性关系,并根据这种关系推测土壤属性空间分布,还能以相对较少的样本量取得较好的预测精度[27]。目前已有研究将RF模型用于土壤有机碳、土壤类型和土壤质地等属性空间预测和制图[28⇓⇓-31,26]。但是目前将RF应用于土壤pH值空间预测制图的研究还较为少见,尤其是国内运用RF模型开展大尺度耕地pH值空间预测分析的研究鲜有报道。
因此,本文以土壤酸化现象显著的江西省为例,使用RF算法和环境协变量信息开展耕地土壤pH值的预测研究。同时将预测结果与使用OK方法插值结果进行对比,验证使用RF算法开展大尺度耕地土壤pH值预测研究的可行性和可靠性,为江西省土壤酸化问题的治理和农业生产管理提供数据基础和依据。
1 研究区概况及数据源
1.1 研究区概况
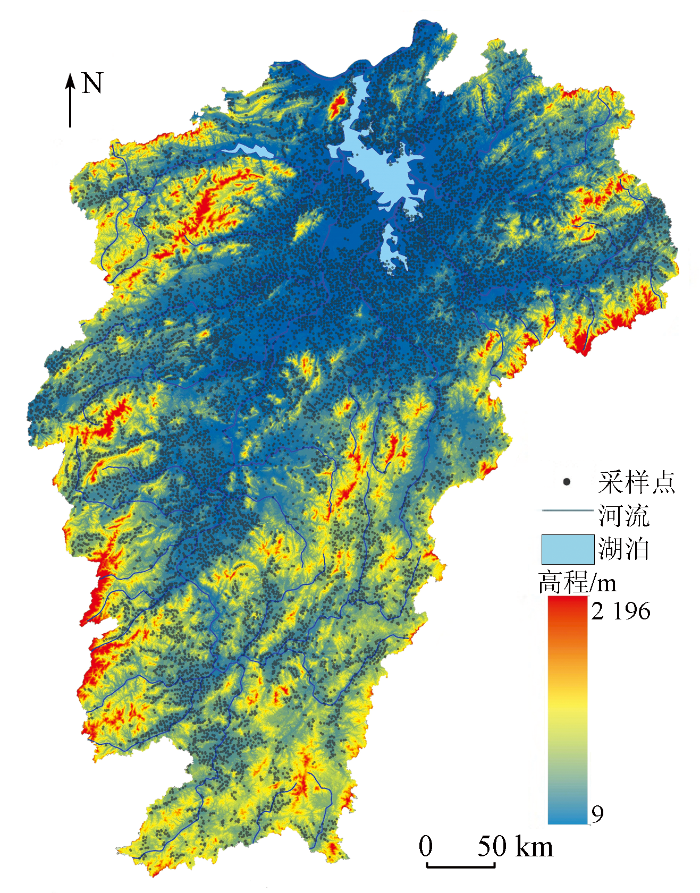
江西省位于中国东南部,长江中下游南岸,位于E113°34'36″~118°28'58″,N24°29'14″~30°04'41″之间(图1),属于亚热带季风性湿润气候,是我国重要的粮食、油料、棉花、蔬菜和水果生产基地。江西地貌类型以山地、丘陵为主,山地占全省面积的36%,丘陵占42%,平原占12%,水域占10%。主要土壤类型为偏酸性的红壤,面积达93 111.32 km2,约占全省总面积的56%,具有较为明显的地带性和地域分布规律。
图1
1.2 数据源及预处理
采集土壤样点16 582个,同时选取样点的土壤属性以及植被指数、地形变量、气候变量和耕地利用条件作为耕地土壤pH值空间预测的环境变量。其中土壤属性包括土壤类型、有机质、有效磷、速效钾、全氮、全磷、全钾、阳离子交换量、成土母质和耕层质地,数据来源于2018年江西省耕地质量等别数据库、1980年和2010年江西省农业测土配方项目数据。归一化植被指数、地形变量的地貌类型和高程以及气象因子的年均气温和年降水量均通过资源环境科学数据中心(
表1 土壤pH值空间预测的环境变量及数据来源
Tab.1
| 变量类别 | 具体指标 | 数据来源 |
|---|---|---|
| 地形变量 | 地貌类型、高程、坡度、坡向、剖面曲率、平面曲率、沟谷深度、地形湿度指数、垂直到沟谷距离和多分辨率谷底平坦度 | 中国科学院资源环境科学数据中心( |
| 气候变量 | 年均气温、年降水量 | 中国科学院资源环境科学数据中心( |
| 植被指数 | 归一化植被指数 | 中国科学院资源环境科学数据中心( |
| 土壤属性 | 土壤类型、有机质、有效磷、速效钾、全氮、全磷、全钾、阳离子交换量、成土母质和耕层质地 | 2018年江西省耕地质量等别数据库、1980年和2010年江西省农业测土配方项目实测数据 |
| 耕地利用条件 | 灌溉保证率、排水条件、氮肥用量、磷肥P2O5用量、钾肥K2O用量、秸秆还田比例和秸秆还田量 | 2018年江西省耕地质量等别数据库 |
2 研究方法
2.1 环境变量的组合和筛选
为全面分析土壤pH值空间变异规律以及探索不同环境变量对模型预测精度的贡献程度,将表1中30个环境变量分成2种不同的组合: ①以地形变量、气候变量和植被指数等遥感数据为基础,增加土壤属性和耕地利用条件等实测数据进行模型训练(RF-A); ②采用传统的地形变量、气候变量和植被指数等遥感数据训练模型(RF-B)。
2.2 RF模型构建
基于采集到的16 582个土壤样点数据,按照8∶2,7∶3和6∶4的比例分为训练集和验证集。RF模型采用bootstrap方法对样本进行放回抽样,没有被抽取的样本会自动生成一个对照集,因此不需要进行交叉验证。RF模型中2个可调参数决策树数量ntree和节点分裂次数mtry决定了模型的配置。
2.3 精度分析与比较
RF模型精度评价选用皮尔逊相关系数r、平均误差ME、绝对平均误差MAE和均方根误差RMSE等4个统计指标,其计算公式分别为:
式中:
3 结果与分析
3.1 土壤pH值的描述性统计分析
通过江西省耕地土壤pH值描述性统计结果可知,土壤pH值范围在4.00~8.30之间,平均值为5.20,中位数为5.10,标准差为4.91,变异系数为9.43%,表明江西省耕地土壤pH值呈弱变异。参考通用标准将江西省土壤pH值划分为7个等级: 极强酸性(pH<4.5)、强酸性[4.5,5.5)、酸性[5.5,6.5)、中性[6.5,7.5)、碱性[7.5,8.5)、强碱性[8.5,9.5)和极强碱性(pH≥9.5)。结果显示,江西省耕地土壤pH值样点中,极强酸性样本数67个,占比0.43%; 强酸性样本数12 718个,占比76.69%; 酸性样本数3 301个,占比19.90%; 中性样本数435个,占比2.62%; 碱性样本数61个,占比0.36%; 没有强碱性样本。综上可知,江西省耕地土壤总体呈现明显的酸性特征。
3.2 RF模型最优参数分析
通过逐次试验,确定RF模型中mtry和ntree参数的最优值。固定mtry(分别设为2,4,6和8),逐次调整ntree(分别设为300,600,900,1 200和1 500),进行4组20次试验。为避免过拟合问题,通过比较训练集和验证集的相关系数(r值),根据两者最为接近的结果确定最优预测模型的参数。结果表明(表2): 当mtry=8,ntree=900时,pH值预测模型的训练集和验证集r值最为接近,表明此时的模型稳定性最佳。
表2 RF模型中节点分裂次数和决策树数量的筛选
Tab.2
| 组别 | mtry | ntree | 训练集r | 验证集r |
|---|---|---|---|---|
| 1组 | 2 | 300 | 0.969 | 0.551 |
| 600 | 0.970 | 0.558 | ||
| 900 | 0.970 | 0.556 | ||
| 1 200 | 0.970 | 0.559 | ||
| 1 500 | 0.970 | 0.555 | ||
| 2组 | 4 | 300 | 0.970 | 0.567 |
| 600 | 0.970 | 0.574 | ||
| 900 | 0.970 | 0.573 | ||
| 1 200 | 0.971 | 0.573 | ||
| 1 500 | 0.971 | 0.572 | ||
| 3组 | 6 | 300 | 0.969 | 0.579 |
| 600 | 0.969 | 0.578 | ||
| 900 | 0.970 | 0.579 | ||
| 1 200 | 0.970 | 0.580 | ||
| 1 500 | 0.970 | 0.580 | ||
| 4组 | 8 | 300 | 0.969 | 0.582 |
| 600 | 0.970 | 0.582 | ||
| 900 | 0.970 | 0.583 | ||
| 1 200 | 0.970 | 0.582 | ||
| 1 500 | 0.969 | 0.581 |
3.3 不同训练集的RF和OK模型预测精度比较
基于不同训练集运行模型所获得的预测结果有所不同(表3)。从相关系数r看,不同训练集的RF-A和RF-B模型预测的土壤pH值与实测值的r较高(均大于0.96)且差别不大,而OK模型r处于0.65左右,预测精度明显低于RF模型; 从误差看,RF-A模型的ME,MAE和RMSE值最小,而OK模型的误差明显更高。3种模型的拟合能力随训练样本量呈现不同的变化趋势。总体上看,RF-A模型略微优于RF-B模型,OK模型明显弱于前2个模型,并且训练集和验证集抽样比在7∶3时RF-A模型精度最佳。在验证数据集中,除了抽样比7∶3时,OK模型比RF-A模型精度高外,其他情况下RF-A模型的r更高。这表明环境变量增加耕地土壤实测数据有利于提高模型预测精度。因此在土壤样点数据充足的情况下,应优先选择RF-A模型用于土壤pH值的建模预测制图。
表3 使用不同训练集时RF和OK模型预测精度比较
Tab.3
| 预测模型 | 抽样比 | 训练集 | 验证集 | ||||||
|---|---|---|---|---|---|---|---|---|---|
| r | ME | MAE | RMSE | r | ME | MAE | RMSE | ||
| RF-A | 8∶2 | 0.970 | -0.004 | 0.121 | 0.167 | 0.599 | -0.009 | 0.291 | 0.392 |
| 7∶3 | 0.970 | -0.004 | 0.121 | 0.167 | 0.567 | -0.014 | 0.299 | 0.401 | |
| 6∶4 | 0.970 | -0.004 | 0.122 | 0.168 | 0.566 | -0.018 | 0.302 | 0.406 | |
| RF-B | 8∶2 | 0.966 | -0.005 | 0.127 | 0.175 | 0.548 | -0.023 | 0.307 | 0.413 |
| 7∶3 | 0.967 | -0.005 | 0.127 | 0.175 | 0.525 | -0.019 | 0.308 | 0.418 | |
| 6∶4 | 0.967 | -0.005 | 0.127 | 0.174 | 0.504 | -0.014 | 0.314 | 0.425 | |
| OK | 8∶2 | 0.679 | 0.002 | 0.261 | 0.364 | 0.559 | 0.009 | 0.311 | 0.409 |
| 7∶3 | 0.683 | 0.001 | 0.259 | 0.357 | 0.588 | 0.007 | 0.289 | 0.394 | |
| 6∶4 | 0.652 | 0.002 | 0.278 | 0.379 | 0.541 | 0.010 | 0.328 | 0.414 | |
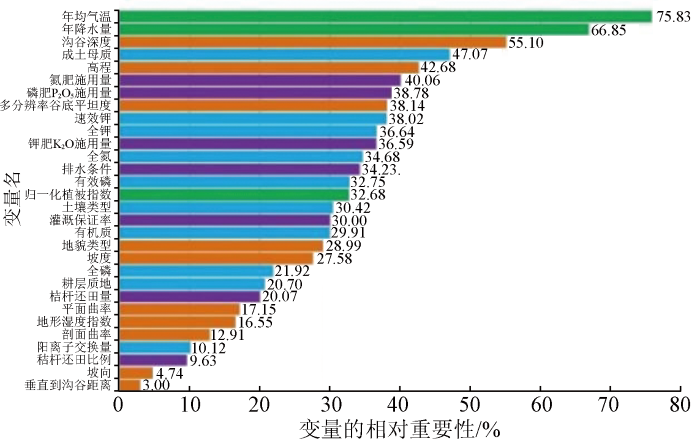
3.4 环境变量重要性分析
图2
3.5 耕地土壤pH值空间预测制图
图3
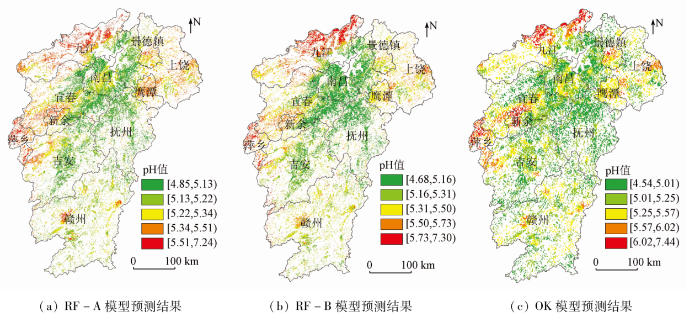
图3
基于RF-A,RF-B和OK模型的耕地pH值空间分布
Fig.3
Distribution of soil pH produced by RF-A, RF-B and OK model
4 讨论
4.1 模型精度分析
图4
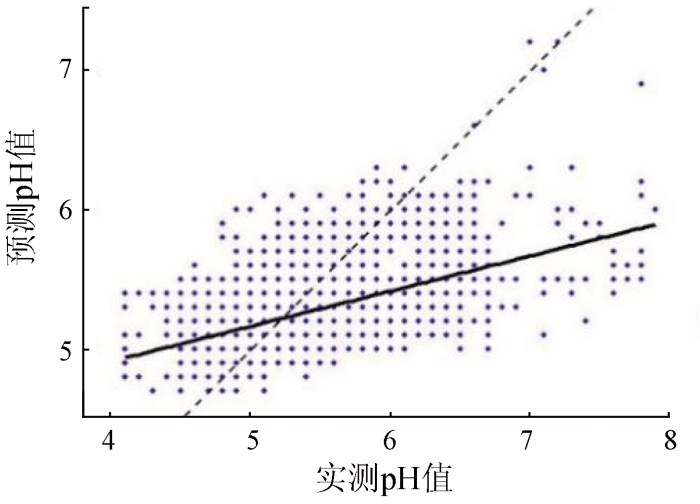
图4
RF-A模型预测值与实测值散点图
Fig.4
Scatter plot of soil pH predicted and measured by RF-A model
4.2 pH值空间变异的影响因素分析
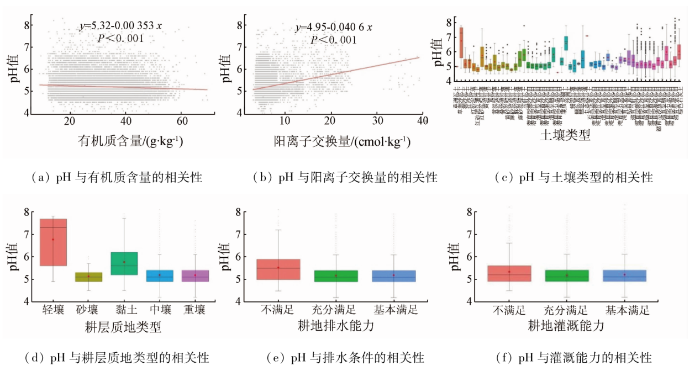
通过运用R Studio软件开展pH值空间变异的影响因素分析,结果显示江西省耕地土壤pH值与年均气温和年降水量关系密切(图2),这一结论与Chen等[32]、卢宏亮等[33]和王世航等[34]的研究结果基本一致。此外,沟谷深度、多分辨率谷底平坦度、高程、坡度和坡向等地形地貌因子也可以通过影响温度、光照、水分和热量的再分配以及母岩形成分布等影响土壤的发育,从而间接影响土壤pH值[38]。因此,地形因子对于预测土壤pH值也具有很高的重要性(图2)。土壤pH值与土壤有机质含量呈现极其显著负相关关系,而土壤pH值与阳离子交换量呈现极其显著的正相关关系,这一结果与戴万宏等[39]、许亚琪[40]、康婷等[41]和王晖等[42]的研究结果一致。耕层质地和土壤类型对于土壤pH值也有明显的影响,轻壤pH值明显高于其他耕层质地类型,黏土次之,不同土壤类型pH值差异也十分显著,其中草洲沙泥土、鳝泥棕红壤和棕色石灰土土壤pH值相对最高,这一结果与前人研究基本一致[32]。需要注意的是,排水条件和灌溉保证率对于耕地土壤pH值也有不可忽视的影响,本研究结果表明,耕地排水能力不满足的情况下耕地土壤pH值最高,在排水能力充分满足和基本满足的耕地土壤pH值相对较低。同时灌溉能力不满足的耕地土壤pH值也高于灌溉能力基本满足和充分满足的耕地土壤,这一结果与朱丹妹等[43]和Ding等[44]的研究结果较为相符(图5)。
图5
5 结论
综合使用地形、气候、植被指数、土壤属性和耕地利用条件等自然环境协变量和人为管理因素数据,基于大量土壤实测样点,分别训练使用2种不同变量组合、不同模型参数设置和不同训练抽样比数据集合的随机森林模型,并预测江西省耕地土壤pH值,再将预测结果与普通克里格方法进行对比。得到如下结论:
1)增加土壤属性和耕地利用条件作为环境变量的RF-A模型预测耕地土壤pH值的精度优于以地形、气候、植被属性作为环境变量的RF-B模型和普通克里格的预测结果。
2)环境变量重要性分析结果显示,气候因素如年均气温和年降水量是决定土壤pH的最重要因素,地形因子、化肥施用量、排水和灌溉条件对土壤pH值变异的影响次之,分析结果与前人研究基本一致,表明相关结论较为可靠,对开展大尺度耕地土壤pH值预测具有一定的理论借鉴和实际应用价值。
但是,对于土壤pH值空间预测精度仍有待提高,今后将考虑增加环境协变量因子,提高基础数据空间分辨率等,进一步提高随机森林模型预测土壤pH值的精度。
参考文献
扬州市耕地土壤pH值30年演变及其驱动因子
[J].
pH variation and the driving factors of farmlands in Yangzhou for 30 years
[J].
Soil acidification induced by elevated atmospheric CO2
[J].DOI:10.1111/gcb.2004.10.issue-11 URL [本文引用: 1]
Changes in soil pH across England and Wales in response to decreased acid deposition
[J].DOI:10.1111/gcb.2010.16.issue-11 URL [本文引用: 1]
A global analysis of soil acidification caused by nitrogen addition
[J].DOI:10.1088/1748-9326/10/2/024019 URL [本文引用: 1]
Significant acidification in major Chinese croplands
[J].
DOI:10.1126/science.1182570
PMID:20150447
[本文引用: 1]

Soil acidification is a major problem in soils of intensive Chinese agricultural systems. We used two nationwide surveys, paired comparisons in numerous individual sites, and several long-term monitoring-field data sets to evaluate changes in soil acidity. Soil pH declined significantly (P < 0.001) from the 1980s to the 2000s in the major Chinese crop-production areas. Processes related to nitrogen cycling released 20 to 221 kilomoles of hydrogen ion (H+) per hectare per year, and base cations uptake contributed a further 15 to 20 kilomoles of H+ per hectare per year to soil acidification in four widespread cropping systems. In comparison, acid deposition (0.4 to 2.0 kilomoles of H+ per hectare per year) made a small contribution to the acidification of agricultural soils across China.
Assessment of heavy metal pollution and health risks in the soil-plant-human system in the Yangtze River Delta,China
[J].DOI:10.3390/ijerph14091042 URL [本文引用: 2]
Identifying heavy metal pollution hot spots in soil-rice systems:A case study in South of Yangtze River Delta,China
[J].DOI:10.1016/j.scitotenv.2018.12.150 URL [本文引用: 1]
基于GIS和地统计学的稻田土壤养分与重金属空间变异
[J].
DOI:10.13287/j.1001-9332.201806.036
[本文引用: 1]
以湖南省长沙县北山镇3.56 hm<sup>2</sup>的水稻田为研究区域,基于网格法(25 m×25 m)等距离取样,采用GIS和地统计学相结合的方法,对研究区土壤耕作层(0~20 cm)的pH值、有机质、全氮、速效磷、阳离子交换量(CEC)与3种典型重金属元素Cd、As、Pb的空间变异特征进行了定量分析.结果表明: 研究区内土壤pH值和Pb含量表现为弱变异,其他各项指标均表现出中等强度变异,变异顺序的大小为:速效磷>Cd>全氮>有机质>CEC>As>Pb>pH.半方差检验结果表明,有机质、速效磷、As的半方差函数的最佳拟合模型为指数模型;pH、全氮、CEC、Cd和Pb的最佳拟合模型为球状模型;除CEC呈中等空间相关外,其余指标均表现出强烈的空间相关.克里格插值分析表明: pH、全氮、CEC、Pb呈斑块状分布;有机质、速效磷、Cd、As呈块状和带状分布.植被、地形和人类活动是造成研究区土壤养分与重金属格局差异的主要因素.相关性分析表明,部分土壤养分与重金属含量的相关性达到显著水平,其中pH与有机质、Cd与Pb的相关性达到了极显著相关水平.
Spatial variability of nutrients and heavy metals in paddy field soils based on GIS and geostatistics
[J].
Improved mapping of potentially toxic elements in soil via integration of multiple data sources and various geostatistical methods
[J].
DOI:10.3390/rs12223775
URL
[本文引用: 1]
Soil pollution by potentially toxic elements (PTEs) has become a core issue around the world. Knowledge of the spatial distribution of PTEs in soil is crucial for soil remediation. Portable X-ray fluorescence spectroscopy (p-XRF) provides a cost-saving alternative to the traditional laboratory analysis of soil PTEs. In this study, we collected 293 soil samples from Fuyang County in Southeast China. Subsequently, we used several geostatistical methods, such as inverse distance weighting (IDW), ordinary kriging (OK), and empirical Bayesian kriging (EBK), to estimate the spatial variability of soil PTEs measured by the laboratory and p-XRF methods. The final maps of soil PTEs were outputted by the model averaging method, which combines multiple maps previously created by IDW, OK, and EBK, using both lab and p-XRF data. The study results revealed that the mean PTE content measured by the laboratory methods was as follows: Zn (127.43 mg kg−1) > Cu (31.34 mg kg−1) > Ni (20.79 mg kg−1) > As (10.65 mg kg−1) > Cd (0.33 mg kg−1). p-XRF measurements showed a spatial prediction accuracy of soil PTEs similar to that of laboratory analysis measurements. The spatial prediction accuracy of different PTEs outputted by the model averaging method was as follows: Zn (R2 = 0.71) > Cd (R2 = 0.68) > Ni (R2 = 0.67) > Cu (R2 = 0.62) > As (R2 = 0.50). The prediction accuracy of the model averaging method for five PTEs studied herein was improved compared with that of the laboratory and p-XRF methods, which utilized individual geostatistical methods (e.g., IDW, OK, EBK). Our results proved that p-XRF was a reliable alternative to the traditional laboratory analysis methods for mapping soil PTEs. The model averaging approach improved the prediction accuracy of the soil PTE spatial distribution and reduced the time and cost of monitoring and mapping PTE soil contamination.
Spatio-temporal variation and source changes of potentially toxic elements in soil on a typical plain of the Yangtze River Delta,China (2002—2012)
[J].DOI:10.1016/j.jenvman.2020.110943 URL [本文引用: 1]
基于GWR模型的伊河流域土壤有机碳空间分布特征及影响因素分析
[J].
Spatial distribution characteristics and influencing factors of soil organic carbon in Yihe River basin based on GWR model
[J].
茶陵县烟稻复种区土壤养分时空变异特征
[J].
Spatial and temporal variation of soil nutrients in tobacco-rice multiple-cropping area of Chaling
[J].
DOI:10.1046/j.1365-2389.2001.00380.x
URL
[本文引用: 1]
A new sampling technique for measuring the concentrations of trace gases (CH4, CO2 and N2O) in the soil atmosphere from well‐defined depths is described. Probes are constructed from silicone tubing closed with silicone septa on both ends, thereby dividing an inner air space from the outer soil atmosphere without a direct contact. The gas exchanges between the inner and outer atmosphere only by diffusion through the walls of the silicone tube. Tests revealed that the gases N2O, CO2 and CH4 in the enclosed space reached 95% equilibrium with the surrounding atmosphere at 20°C within 7 h or faster. The probe measurements are reproducible: the standard deviation of samples taken from 26 probes stored in the laboratory atmosphere equalled that of a standard gas. The probes can easily be constructed and installed at specified depths in the soil.
On digital soil mapping
[J].DOI:10.1016/S0016-7061(03)00223-4 URL [本文引用: 1]
Updating a national soil classification with spectroscopic predictions and digital soil mapping
[J].DOI:10.1016/j.catena.2018.01.015 URL [本文引用: 1]
Estimating soil salinity from remote sensing and terrain data in southern Xinjiang Province,China
[J].
DOI:10.1016/j.geoderma.2018.08.006
[本文引用: 1]
Soil salinization is one of the main reasons for soil health and ecosystem deterioration in most degraded arid and semiarid areas. To monitor its spatial variation as precise as possible over a large area, we collected 225 samples using traditional field experiment and laboratory analysis method from the southern part of the Xinjiang Province, China, affected by soil salinity under strong arid climate. Then, we constructed both Cubist and partial least square regression (PLSR) models on electrical conductivity (EC) (150 ground-based measurements as calibration set) using various related covariates (e.g. terrain attributes, remotely sensed spectral indices of vegetation and salinity from landsat8 OLI satellite) that are at the same time period corresponding to soil sampling. Two models were validated using remaining 75 independent ground based measurements and were then used to map the soil salinity over the study area. Finally, the validation results of two models were compared under different intervals of EC, soil moisture content and vegetation coverage. The results indicated that Cubist model could predict EC value with better accuracy and stability under variable environment than PLSR. The R-2, RMSE, MAE and RPD of the Cubist model were 0.91, 5.18 dS m(-1), 3.76 dS m(-1) and 3.15 while corresponding values of the PLSR model were 0.66, 10.46 dS m(-1), 8.21 dS m(-1) and 1.56 in validation dataset, respectively. Additionally, the map derived from Cubist model revealed more detailed variation information of the spatial distribution of EC than that from PLSR model across the study area. Thus, Cubist model was recommended for mapping soil salinity using indices derived from satellite and terrain in other arid areas.
青海省表层土壤属性数字制图
[J].
Digital mapping of topsoil attributes in Qinghai Province
[J].
DOI:10.1046/j.1365-2389.1999.00245.x
URL
[本文引用: 1]
In the range of volumetric water content, θ, from about 0.12 cm3 cm–3 to saturation the relation between bulk electrical conductivity, Cb, and bulk electrical permittivity, ε, of mineral soils was observed to be linear. The partial derivative ∂Cb/∂ε appeared independent of the moisture content and directly proportional to soil salinity. We found that the variable Xs = ∂Cb/∂ε determined from in situ measurements of Cb(θ > 0.2) and ε(θ > 0.2) can be considered as an index of soil salinity, and we call it the ‘salinity index’. Knowing the index and sand content for a given soil we could calculate the electrical conductivity of the soil water, Cw, which is a widely accepted measure of soil salinity. The two variables from which the salinity index can be calculated, i.e. Cb and ε, can be read simultaneously from the same sensor by time‐domain reflectometry.
Digital soil mapping and GlobalSoilMap.Main advances and ways forward
[J].DOI:10.1016/j.geodrs.2020.e00265 URL [本文引用: 1]
Field-scale characterization of spatio-temporal variability of soil salinity in three dimensions
[J].
DOI:10.3390/rs12244043
URL
[本文引用: 1]
Information on spatial, temporal, and depth variability of soil salinity at field and landscape scales is important for a variety of agronomic and environment concerns including irrigation in arid and semi-arid areas. However, challenges remain in characterizing and monitoring soil secondary salinity as it can largely be impacted by managements including irrigation and mulching in addition to natural factors. The objective of this study is to evaluate apparent electrical conductivity (ECa)-directed soil sampling as a basis for monitoring management-induced spatio-temporal change in soil salinity in three dimensions. A field experiment was conducted on an 18-ha saline-sodic field from Alar’s Agricultural Science and Technology Park, China between March, and November 2018. Soil ECa was measured using an electromagnetic induction (EMI) sensor for four times over the growing season and soil core samples were collected from 18 locations (each time) selected using EMI survey data as a-priori information. A multi-variate regression-based predictive relationship between ECa and laboratory-measured electrical conductivity (ECe) was used to predict EC with confidence (R2 between 0.82 and 0.99). A three-dimensional inverse distance weighing (3D-IDW) interpolation clearly showed a strong variability in space and time and with depths within the study field which were mainly attributed to the human management factors including irrigation, mulching, and uncovering of soils and natural factors including air temperature, evaporation, and groundwater level. This study lays a foundation of characterizing secondary salinity at a field scale for precision and sustainable management of agricultural lands in arid and semi-arid areas.
Depth-to-bedrock map of China at a spatial resolution of 100 meters
[J].
DOI:10.1038/s41597-019-0340-y
[本文引用: 1]
The dataset presented here was collected by the GenTree project (EU-Horizon 2020), which aims to improve the use of forest genetic resources across Europe by better understanding how trees adapt to their local environment. This dataset of individual tree-core characteristics including ring-width series and whole-core wood density was collected for seven ecologically and economically important European tree species: silver birch (Betula pendula), European beech (Fagus sylvatica), Norway spruce (Picea abies), European black poplar (Populus nigra), maritime pine (Pinus pinaster), Scots pine (Pinus sylvestris), and sessile oak (Quercus petraea). Tree-ring width measurements were obtained from 3600 trees in 142 populations and whole-core wood density was measured for 3098 trees in 125 populations. This dataset covers most of the geographical and climatic range occupied by the selected species. The potential use of it will be highly valuable for assessing ecological and evolutionary responses to environmental conditions as well as for model development and parameterization, to predict adaptability under climate change scenarios.
Novel framework for modelling the cadmium balance and accumulation in farmland soil in Zhejiang Province,east China:Sensitivity analysis,parameter optimisation,and forecast for 2050
[J].DOI:10.1016/j.jclepro.2020.123674 URL [本文引用: 1]
基于数字土壤制图技术的土壤有机碳储量估算
[J].
DOI:10.13287/j.1001-9332.202102.014
[本文引用: 1]
精准的土壤属性空间分布信息有助于提升土壤有机碳储量估算的精度。本研究以河南省济源市南山林场为研究区,以地形因子为预测因子,利用模糊C均值(FCM)聚类方法对土壤有机碳含量、土壤容重、土壤厚度和土壤砾石含量进行数字土壤预测制图,基于数字制图结果实现土壤有机碳密度预测制图和土壤有机碳储量估算。结果表明: 基于数字土壤制图方法得到的研究区土壤有机碳密度平均值为4.24 kg·m<sup>-2</sup>,其预测图的平均误差(ME)为0.08 kg·m<sup>-2</sup>,平均绝对误差(MAE)为2.80 kg·m<sup>-2</sup>,均方根误差(RMSE)为5.03 kg·m<sup>-2</sup>,与传统类型方法相比,预测结果的精度和稳定性更高,具有较高的可信度,最终估算得到研究区土壤有机碳储量为3.08×10<sup>8</sup> kg。基于数字土壤制图技术仅采用少量土壤样点即可实现较高精度的土壤有机碳密度制图和储量估算,且能表征土壤有机碳密度空间分布特征。本研究为土壤有机碳储量估算提供了新途径,有助于提升土壤有机碳储量估算的精度和效率。
Estimation of soil organic carbon storage based on digital soil mapping technique
[J].
土壤地理学的进展与展望
[J].
DOI:10.18306/dlkxjz.2018.01.007
[本文引用: 1]
作为土壤学和地理学学科的分支,土壤地理学是地球表层系统科学的重要组成部分,其核心研究内容是土壤的时空变化。土壤地理学研究对象从传统的土体向地球表层系统视角下的关键带转变,研究方法上全面走向数字化。本文综述了近20年来土壤地理学分支学科包括土壤发生、土壤形态、土壤分类、土壤调查与数字土壤制图等领域的研究进展,指出其发展趋势为:基础理论研究不断拓展、调查技术正经历变革、时空演变从过程观测走向模拟,同时探讨了土壤地理学的未来发展契机与面临的挑战。
Progress and future prospect of soil geography
[J].
DOI:10.18306/dlkxjz.2018.01.007
[本文引用: 1]
Soil geography is the sub-discipline of soil science and geography dealing with the spatiotemporal changes of soil, and is a part of the earth surface system science. The research topic of soil geography is gradually changing from soil body to critical zone from the perspective of the earth surface system, meanwhile the research methodology develops toward "digital". Based on an introduction of the theoretical and technical backgrounds, this article reviewed the recent progress of soil geography including on soil genesis, soil morphology, soil classification, soil survey, and digital soil mapping. Future development of soil geography needs to expand the theoretical research, innovate the investigation technology, and simulate the spatiotemporal variations of soil. Furthermore, the main opportunities, trends, and challenges in the future were discussed.
Random forests
[J].DOI:10.1023/A:1010933404324 URL [本文引用: 1]
基于随机森林的苹果区土壤有机质空间预测
[J].
Spatial prediction of soil organic matter in apple region based on random forest
[J].
A random forests quantile classifier for class imbalanced data
[J].
DOI:10.1016/j.patcog.2019.01.036
PMID:30765897
[本文引用: 1]
Extending previous work on quantile classifiers (-classifiers) we propose the *-classifier for the class imbalance problem. The classifier assigns a sample to the minority class if the minority class conditional probability exceeds 0 * 1, where * equals the unconditional probability of observing a minority class sample. The motivation for *-classification stems from a density-based approach and leads to the useful property that the *-classifier maximizes the sum of the true positive and true negative rates. Moreover, because the procedure can be equivalently expressed as a cost-weighted Bayes classifier, it also minimizes weighted risk. Because of this dual optimization, the *-classifier can achieve near zero risk in imbalance problems, while simultaneously optimizing true positive and true negative rates. We use random forests to apply *-classification. This new method which we call RFQ is shown to outperform or is competitive with existing techniques with respect to -mean performance and variable selection. Extensions to the multiclass imbalanced setting are also considered.
Mapping soil organic matter contents at field level with Cubist,random forest and Kriging
[J].DOI:10.1016/j.geoderma.2019.02.019 URL [本文引用: 2]
Using quantile regression forest to estimate uncertainty of digital soil mapping products
[J].DOI:10.1016/j.geoderma.2016.12.017 URL [本文引用: 1]
Digital mapping of soil organic matter for rubber plantation at regional scale:An application of random forest plus residuals Kriging approach
[J].
Spatial prediction of soil surface texture in a semiarid region using random forest and multiple linear regressions
[J].DOI:10.1016/j.catena.2016.01.001 URL [本文引用: 1]
A high resolution map of soil types and physical properties for Cyprus:A digital soil mapping optimization
[J].DOI:10.1016/j.geoderma.2016.09.019 URL [本文引用: 1]
Some practical aspects of predicting texture data in digital soil mapping
[J].DOI:10.1016/j.still.2019.06.006 URL [本文引用: 1]
A high-resolution map of soil pH in China made by hybrid modelling of sparse soil data and environmental covariates and its implications for pollution
[J].DOI:10.1016/j.scitotenv.2018.11.230 URL [本文引用: 3]
基于随机森林模型的安徽省土壤属性空间分布预测
[J].
Spatial prediction of soil properties based on random forest model in Anhui Province
[J].
基于不同特征挖掘方法结合广义提升回归模型估测安徽省土壤pH
[J].
DOI:10.13287/j.1001-9332.202010.018
[本文引用: 2]
为探讨不同特征挖掘方法与广义提升回归模型相结合在数字土壤制图中的应用,本研究首先使用递归特征消除和过滤式两种特征筛选方法对环境协变量进行筛选,再分别使用原始环境协变量、筛选后的最优变量组合作为自变量,建立基于广义提升回归模型和随机森林模型的安徽省土壤pH预测模型并进行制图。结果表明: 引入两种特征挖掘方法均可有效提高广义提升回归模型和随机森林模型预测土壤pH的精度,并且可以起到降维的作用;相较于随机森林模型,广义提升回归模型的验证集预测精度略低,在训练集中,广义提升回归模型的精度却远高于随机森林模型,模型解释度高,整体效果较好;随机森林模型的主要参数ntree和mtry对于模型的影响程度较低,而不同参数对于广义提升回归模型的预测精度影响较大,不同参数组合模型精度不同,建模前需要进行调参。空间制图结果表明,安徽省土壤pH呈“南酸北碱”趋势。
Assessing soil pH in Anhui Province based on different features mining methods combined with generalized boosted regression models
[J].
基于遥感与随机森林算法的陕西省土壤有机质空间预测
[J].
DOI:10.11849/zrzyxb.20160623
[本文引用: 1]
遥感数据作为反映土壤组成结构及植被生长状况的数据源,借助辅助环境因子的土壤属性预测在数字土壤制图中日益受到重视。论文运用随机森林(Random Forest,RF)算法,基于AWIFS(分辨率56 m)和MODIS(分辨率250 m)遥感数据及501个实测样点数据对陕西省土壤有机质空间分布状况进行预测,并对预测精度进行估算。结果表明陕西省土壤有机质含量以南部的秦岭山地区和大巴山区为最高,土壤有机质含量大于25 g·kg<sup>-1</sup>,黄土高原南部处于中等水平,大部分在16~25 g·kg<sup>-1</sup>之间,关中平原和汉中低山丘陵区含量偏低,大部分在13~25 g·kg<sup>-1</sup>,而黄土高原北部和风沙滩区含量大部分低于10 g·kg<sup>-1</sup>。基于AWIFS影像的预测效果要优于MODIS影像,成像日期对有机质预测的影响不大。基于RF模型的土壤有机质预测精度在设定的不同抽样百分比条件下,独立验证数据集的平均误差大部分不超过3 g·kg<sup>-1</sup>,预测值与实测值的相关系数在0.7以上。高程是影响土壤有机质预测的最重要因子,当影像的分辨率降低时,样点分布的地理经纬度和坡度对土壤有机质预测的影响上升,植被因子的影响程度下降。
Soil organic matter prediction based on remote sensing data and random forest model in Shaanxi Province
[J].
基于多变量与RF算法的耕地土壤有机碳空间预测研究——以福建亚热带复杂地貌区为例
[J].
Prediction of spatial distribution of soil organic carbon in farmland based on multi-variables and random forest algorithm: A case study of a subtropical complex geomorphic region in Fujian as an example
[J].
近40年来陕西省耕层土壤pH的时空变化特征
[J].
Spatial and temporal variability in soil pH of Shaanxi Province over the last 40 years
[J].
中国地带性土壤有机质含量与酸碱度的关系
[J].
Relationships between soil organic matter content(SOM) and pH in topsoil of zonal soils in China
[J].
土壤阳离子交换量的分析结果研究
[J].
Study on the analytical results of soil cationic exchange capacity
[J].
江西省土壤阳离子交换量区域分布特征及其影响因素
[J].
DOI:10.11924/j.issn.1000-6850.casb2020-0486
[本文引用: 1]
研究江西省土壤阳离子交换量区域分布特征及其影响因素,为今后江西省土壤地力提升采取合理的培肥措施提供理论依据。采用乙酸铵交换法测定江西省土壤耕层367个土样的阳离子交换量,分析其区域分布特征。结果表明:(1)江西省旱地和稻田土壤阳离子交换量(CEC)含量变幅较大,土壤CEC含量小于10.5 cmol(+)/kg的占比高达82.02%,保肥性弱的稻田土壤比旱地高2.46%。(2)从各区域保肥力中等的土壤占比来看,江西省各区域旱地土壤和稻田土壤CEC含量分布高度一致,表现为赣西>赣中>赣北>赣东北>赣南。(3)江西省土壤阳离子交换量主要受有机质、全N显著(P<0.05)影响,其次是土壤pH、速效N、速效K、全P、全K的影响,而有效P的影响力最小。江西省耕地土壤保肥能力弱,旱地保肥能力略强于稻田。
Regional distribution characteristics and influencing factors of soil cation exchange capacity in Jiangxi
[J].
DOI:10.11924/j.issn.1000-6850.casb2020-0486
[本文引用: 1]
To improve soil fertility in Jiangxi Province, the regional distribution characteristics of soil cation exchange capacity and the influencing factors were studied. The ammonium acetate exchange method was used to determine the cation exchange capacity of 367 soil samples in surface soil and analyzed their regional distribution characteristics. The results showed that: (1) the content of soil cation exchange capacity in dry soil and paddy soil had a large variation, and the proportion of soil CEC content less than 10.5 cmol (+)/kg was as high as 82.02%, the paddy soil with low capability of conserving fertilizer was 2.46% higher than that of dry soil; (2) according to the proportion of soil with medium capability of conserving fertilizer, the distribution of CEC content in dry soil and paddy soil in Jiangxi was highly consistent, with the order of west Jiangxi >central Jiangxi > north Jiangxi > northeast Jiangxi > south Jiangxi; (3) the soil cation exchange capacity in Jiangxi was mainly affected by organic matter and total N (P<0.05), followed by soil pH, available N, available K, total P and total K, while available P had the least influence. In Jiangxi Province, the capability of conserving fertilizer of cultivated land is weak, and the capability of conserving fertilizer of dry soil is slightly stronger than that of paddy soil.
攀西烟区紫色土pH值与土壤养分的相关分析
[J].
Relationship between pH value and available nutrients of purple soil in panxi tobacco-growing areas
[J].
不同类型土壤淹水对pH、Eh、Fe及有效态Cd含量的影响
[J].
Effects of pH,Eh,Fe,and flooded time on available-Cd content after flooding of different kinds of soil
[J].
Changes in the pH of paddy soils after flooding and drainage:Modeling and validation
[J].DOI:10.1016/j.geoderma.2018.10.012 URL [本文引用: 1]
