

0 引言
地面观测可以获得准确和连续的气溶胶信息,但由于站点分布稀疏,无法从细节上展现气溶胶的空间分布信息,而卫星遥感在大气环境质量变化的连续性、空间性和趋势性监测方面具有明显优势。气溶胶反演算法有MODIS的暗目标(dark target algorithm,DT)算法[4-5]和深蓝(deep blue algorithm, DB)算法[6-7]等。2022年,Chen等[8]统计了2012—2019年MODIS DT与地基AOD的相关系数R和均方根误差(root mean square error,RMSE),分别为0.820和0.157,MODIS DB的R和RMSE分别为0.827和0.134,MODIS DT与DB的融合产品DTB的R和RMSE分别为0.853和0.125。日本Himawari-8/AHI提供了东亚上空AOD产品(V2.1版本)与AERONET站点观测值的R达到0.67,平均绝对误差(mean absolute error,MAE)为0.19,RMSE为0.37[9]。我国风云系列卫星中,多个搭载探测气溶胶传感器的卫星成功发射,推动了基于风云气象卫星数据反演气溶胶的研究发展。研究人员先后尝试利用FY-1C/1D数据(极轨卫星)[10]、FY-2C/VISSR数据(静止卫星)[11]、FY-3A/B MERSI数据(极轨卫星)[12]进行AOD反演算法构建,其中刘智超等[12]研究发现FY-3A的反演结果与太阳光度计观测值的R高于0.96,仅有20%的样本表现出较大的偏差,FY-3B的R最高为0.77,RMSE最大为0.35。2016年,中国第二代地球静止气象卫星FY-4A成功发射。FY-4A上搭载的先进静止轨道辐射成像仪(advanced geostationary radiation imager,AGRI)可实现分钟级的区域快速扫描,高频次获取14波段的地球云图,因此FY-4A/AGRI在大气污染监测和建模方面具有很大的潜力[13]。许梦婕[14]基于FY-4A/AGRI数据,采用DT和DB 2种传统算法反演京津冀地区AOD,R2分别为0.755和0.607; Jiang等[15]针对FY-4A数据提出一种新的陆地AOD反演算法——BRL算法,FY-4A AOD,MODIS DT AOD和MODIS DB AOD与地基观测值的R均为0.84,FY-4A AOD的RMSE(0.16)低于MODIS DT AOD(0.20),高于MODIS DB AOD(0.12),说明反演结果优于MODIS DT AOD产品,略差于MODIS DB AOD产品。近年来,随着机器学习的广泛应用,为气溶胶遥感带来了新的研究和应用手段[16]。Ristovski等[17]利用AERONET地基气溶胶观测的AOD和MODIS卫星遥感数据样本训练神经网络模型,AOD测试精度(R2=0.819,RMSE=0.100)优于当时的DT方法C005版本产品(R2=0.786,RMSE=0.108)[18]; Ding等[19]利用全卷积神经网络反演的FY-4A AOD与地面观测值的MAE和RMSE分别达到0.145和0.237。机器学习是通过学习样本数据获得复杂方程精确解的有力工具[20],具有强大的非线性拟合能力,对于定量机理难以精确描述的定量化参数反演问题,可以作为一种统计方法实现遥感信息提取。
本文选用2021年FY-4A上搭载的AGRI 中的4 km光谱通道和产品集,经过波长插值与时间匹配,构建样本数据集。基于机器学习算法构建随机森林(random forest,RF)、梯度增强回归(gradient boosting regression tree,GBRT)、极端梯度增强(extrme gradient boosting,XGBoost)和反向传播神经网络(back propagation neural network,BPNN)4种算法反演模型。模型的反演结果与全球地基气溶胶自动观测网络系统(aerosol robotic network,AERONET)站点观测的AOD进行检验,对比各方法之间的准确性和稳定性,选择出较优的机器学习模型。将较优的机器学习模型反演所得的AOD结果与相近时刻的MODIS气溶胶数据进行对比,探讨机器学习方法用于气溶胶动态监测的可行性与准确性。
1 研究区概况及数据源
1.1 研究区概况
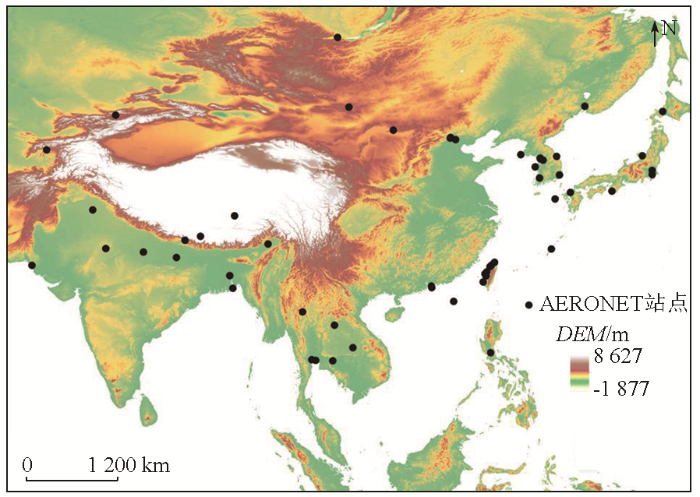
研究区范围为E65°~145°,N0°~55°(图1)。该研究区具有复杂的地理环境和差异化的气象气候条件。由于东亚及东南亚地区经济发展迅速和人口密集,空气污染严重,气溶胶对空气质量的影响备受关注。
图1
1.2 数据源及其预处理
1.2.1 FY-4A/AGRI遥感数据
本文选取AGRI中12个表观反射率数据(表1),成像时刻的太阳天顶角(solar zenith angle, SOZ)、太阳方位角(solar azimuth angle,SOA)、太阳耀斑角(solar flare angle,SGA)和卫星天顶角(satellite zenith angle,SAZ)以及选取晴朗像元的云检测产品值用于建立训练模型。
表1 AGRI数据波段
Tab.1
| 通道序号 | 通道类型 | 中心波长/μm | 光谱带宽/μm | 主要用途 |
|---|---|---|---|---|
| B1 | 可见光与近红外 | 0.47 | 0.45~0.49 | 气溶胶 |
| B2 | 0.65 | 0.55~0.75 | 植被 | |
| B3 | 0.825 | 0.75~0.90 | 植被 | |
| B4 | 短波红外 | 1.375 | 1.36~1.39 | 卷云 |
| B5 | 1.61 | 1.58~1.64 | 云、雪 | |
| B6 | 2.25 | 2.1~2.35 | 卷云、气溶胶 | |
| B7 | 中波红外 | 3.75 | 3.5~4.0(高) | 火点 |
| B8 | 3.75 | 3.5~4.0(低) | 地表 | |
| B9 | 水汽 | 6.25 | 5.8~6.7 | 云导风 |
| B10 | 7.1 | 6.9~7.3 | 云导风 | |
| B11 | 长波红外 | 8.5 | 8.0~9.0 | 云导风、云 |
| B12 | 13.5 | 13.2~13.8 | 云顶高度 |
1.2.2 MODIS产品
本文选取MOD09A1第3波段(蓝光)地表反射率参与模型的训练,空间分辨率为500 m,时间分辨率为8 d。使用MODIS DT和DB算法融合0.55 μm处的AOD产品(MODIS DTB),空间分辨率为10 km,时间分辨率为0.5~1 d,该数据集精度优于前一代的C5产品且优于DT或DB产品[8]。
1.2.3 AERONET地基观测数据及处理
选取研究区内的67个AERONET站点实测数据(Level1.5和Level2.0),为训练样本集提供精确AOD信息,并应用于AOD反演的训练与验证。站点分布如图1所示。由于AGRI的扫描周期为15 min,因此本文对AERONET 每个站点在相应15 min内的数据作平均,与AGRI数据对应,建立训练集。
AERONET AOD产品包含1.02,0.87,0.675,0.5,0.44,0.38和0.34 μm波段的AOD,而MODIS只包含0.47,0.55和0.66 μm波段的AOD产品,以及AGRI反演结果为0.55 μm波段的AOD。因此,需要对AERONET数据进行波长插值,得到与卫星产品波段一致的AOD。相对于Angstrom波长指数插值方法,二次多项式插值法可插值出精度较高、更可靠的0.55 μm通道处AOD值[21]。本研究采用二次多项式插值法进行波段插值,选取AERONET的0.675,0.5和0.44 μm 3个波段,进行插值获取0.55 μm的AOD。插值公式为:
式中:
1.2.4 高程数据
高程数据为通过地理空间数据云(https://www.gscloud.cn/)获取到的90 m空间分辨率的SRTM3数据。
2 研究方法
2.1 机器学习建模
本文使用基于Bagging方法的RF模型、基于Boosting方法的XGBoost和GBRT模型,以及基于深度学习的BPNN模型4种机器学习方法反演AOD。
将67个站点2021年1—12月的数据作为训练集,2022年7月、10月和2023年1月、4月作为验证集。训练集参与反演模型建立、训练以及采用五折交叉验证方法进行参数调优,共匹配到69 723组样本。验证集不参与训练,作为独立样本(18 300组)对经过参数调优后的模型进行稳定性检验。
RF,XGBoost和GBRT的调参过程是通过网格搜索(GridSearchCV)对不同的参数选择和不同参数取值的组合进行尝试,调整的参数主要包括决策树个数(n_estimators)和决策树最大深度(max_depth)等超参数。如n_estimators从0~2 000,max_depth从0~100分别间隔20进行迭代,也就是1 000种参数组合。BPNN模型的调参过程是不断调整隐含层层数、神经元数、迭代次数等,隐含层的最佳神经元数可在
2.2 重要性方法
计算特征重要性主要是计算每一个特征贡献的平均值,然后将其特征做对比[23]。通常采用袋外数据(out of bag,OOB)的错误率来辅助筛选,计算公式为:
式中
2.3 验证指标
式中
3 结果与分析
3.1 特征重要性
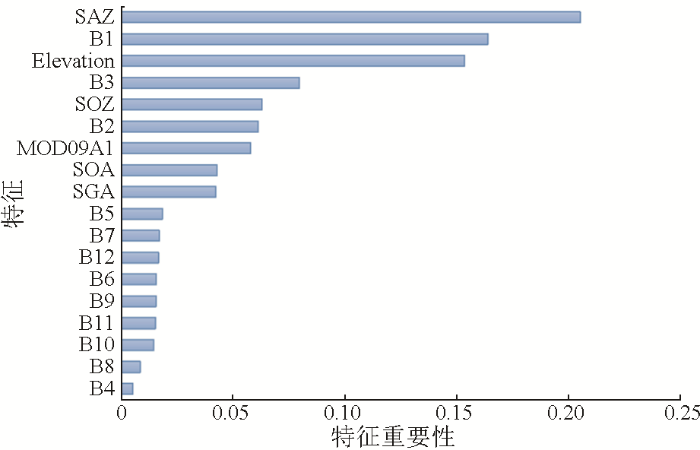
特征选择是构建机器学习模型的重要步骤之一,旨在通过使用相关特征来减少机器学习模型的输入特征,并去除数据集中的噪声。在模型构建中选择相关特征的因子会直接影响模型的准确性和复杂性[27]。本文将FY-4A/AGRI 12个波段(B1—B12)的表观反射率,地表反射率(MOD09A1),SOZ,SOA,SGA,SAZ和高程(Elevation)作为18个输入变量,分析特征重要性(图2)。由图2可知,模型变量的排序从大到小前5位为: SAZ,B1,Elevation,B3和SOZ,其中前3个变量对AOD估计值的贡献约52%。SAZ和SOZ会影响气溶胶粒子对太阳光的吸收和散射作用,所以,观测角度数据是反演AOD的重要变量; B1(蓝光波段)的中心波长为0.47 μm,与真值波段0.55 μm相近,而且蓝光波段对气溶胶相当敏感,很容易受到其影响; B3(近红外波段)的中心波长为0.825 μm,用于监测植被作物长势和植物分类等,因此AOD可能受植被因素的影响; 高程对AOD的影响主要是通过大气压力和温度的变化来实现的,随着高程的增加,大气压力和温度均会下降,从而对AOD产生影响[28]。
图2
3.2 建模误差
以AERONET地基观测数据为真值,利用4种机器学习方法建立基于FY-4A的AOD反演模型。建模误差结果如图3所示,蓝线为EE; 黑线为y=x; 红线为反演值与真值的拟合线。4种机器学习模型的R均高于0.90,MAE小于0.09,RMSE小于0.14。其中,GBRT模型精度最优,R,MAE和RMSE分别为0.936 7,0.072 9和0.107 9,其次为XGBoost与RF模型,两者精度相当,BPNN模型次之。
图3
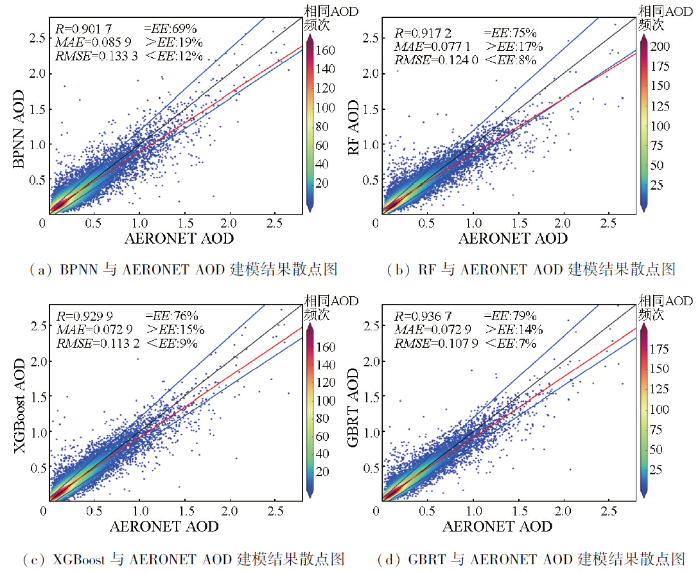
图3
BPNN,RF,XGBoost 和GBRT 模型反演的AOD与地基数据的建模结果散点图
Fig.3
Scatterplot of modeling results for AOD and ground-based data for BPNN, RF, XGBoost and GBRT model
3.3 验证误差
3.3.1 总体验证
选用与建模不同的时间数据(2022年7月、10月和2023年1月、4月)代入已建立的4种机器学习模型中,通过验证指标分析各模型的时间稳定性。如图4所示,4种机器学习模型的R,MAE,RMSE分别在0.76~0.82,0.15~0.17,0.24~0.26范围内,约44%及以上的反演结果落在EE内。整体上,拟合线的斜率均小于1,较大的AOD会出现低估现象。其中,GBRT模型的R,MAE和RMSE分别约为0.82,0.16,0.25,47%及以上的反演结果落在EE内,说明GBRT模型较其他3种模型在时间稳定性上具有一定的优势。
图4

图4
BPNN,RF,XGBoost 和GBRT 模型反演的AOD与地基数据的验证结果散点图
Fig.4
Scatterplot of validation results for AOD and ground-based data for BPNN, RF, XGBoost and GBRT model
3.3.2 分月验证
表2显示了使用GBRT模型对4个月份FY-4A/AGRI反演AOD的验证结果。4个验证月份的R均在0.74以上,其中2023年1月R能够达到0.90,说明反演结果在不同月份上具有较高的精度。2022年7月、10月和2023年1月的MAE均在0.13以下,RMSE均在0.2以下,2023年4月的验证精度有所下降。通过比较反演值与真实值,发现偏差较大的情况较多出现在泰国站点(Chiang_Mai_Met_Sta)和印度站点(Dibrugarh_Univ)。泰国的新年在每年的4月份举办,人类活动较为密集,产生更多的污染气体和粉尘[29]; 另外,2023年4月印度发生极端高温事件,温度与AOD显著正相关,进而促进次生有机气溶胶转化[30]。因此,可能造成反演偏差稍大的原因是AOD>1.5的样本较少,对高AOD值的训练不足,导致FY-4A AOD值出现低估现象。
表2 分月验证表
Tab.2
| 时间 | R | MAE | RMSE | =EE/% | >EE/% | <EE/% |
|---|---|---|---|---|---|---|
| 2022年7月 | 0.748 8 | 0.120 6 | 0.188 6 | 52 | 20 | 28 |
| 2022年10月 | 0.826 9 | 0.117 8 | 0.182 8 | 56 | 12 | 32 |
| 2023年1月 | 0.903 7 | 0.125 3 | 0.197 8 | 51 | 6 | 43 |
| 2023年4月 | 0.802 2 | 0.251 3 | 0.364 7 | 32 | 2 | 66 |
3.4 空间分布对比
通过建模误差和时间稳定性验证,GBRT方法在反演AOD中的性能要优于XGBoost,RF,BPNN。因此,使用GBRT模型来反演研究区的AOD空间分布图。图5(a)—(h)为 2022年7月4日、2022年10月8日、2023年1月25日、2023年4月15日MODIS/Terra(UTC02:30)和FY-4A/AGRI(UTC02:45)空间分布特征对比图。图5(i)—(p)为相同日期MODIS/Aqua(UTC05:30)和FY-4A/AGRI(UTC05:45)空间分布特征对比图。由于云的遮挡,FY-4A反演结果与MODIS产品图像上都存在一定的缺失。从整体分布来看,FY-4A AOD与Terra/MODIS和Aqua/MODIS AOD在空间趋势上较为一致。图上的4 d高值区域主要集中在中国的黄淮海平原和印度河—恒河平原地区。黄淮海平原地区AOD较高主要是因为经济的快速发展和人口的密集分布导致污染物的大量排放[31]; 印度河—恒河平原的部分地区出现高AOD的原因是当地的人为排放和来自印度西北部塔尔沙漠的远程自然粉尘气溶胶排放[32]。
图5
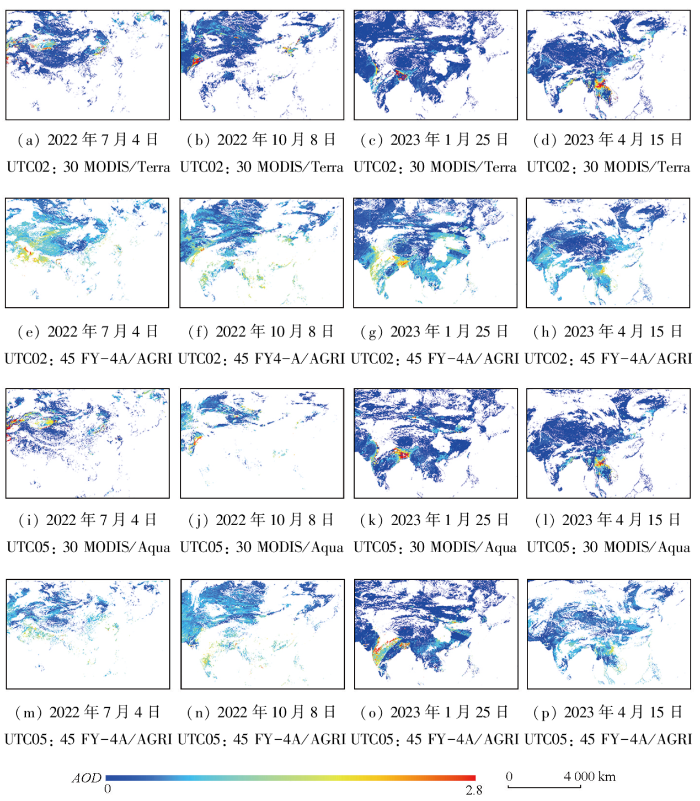
图5
MODIS/Terra,MODIS/Aqua和FY-4A/AGRI产品区域分布对比
Fig.5
Comparison of the regional distribution of MODIS/Terra, Aqua/MODIS and FY-4A/AGRI products
为了进一步定量分析两者产品差值分布差异,将MODIS AOD重采样至4 km的空间分辨率,再与FY-4A AOD相减。计算每组差值的频数与样本总数的比例,得到差值频率直方图(图6)。由图可见, 两者个别网格差值达到±2.5。总体误差范围在[-1.0,0.2),占比达到93.07%,表明MODIS AOD与FY-4A AOD产品存在一定的一致性。当范围为[-1.0,0)时,占比达到83.57%,说明FY-4A AOD反演值相对MODIS AOD略高。最大频率主要集中在[-0.2,-0.1)范围内,占比达到24.32%。当AOD差值>1或<-1时,占比和为1.4%,FY-4A AOD与MODIS AOD在较大的偏差上分布较少。
图6
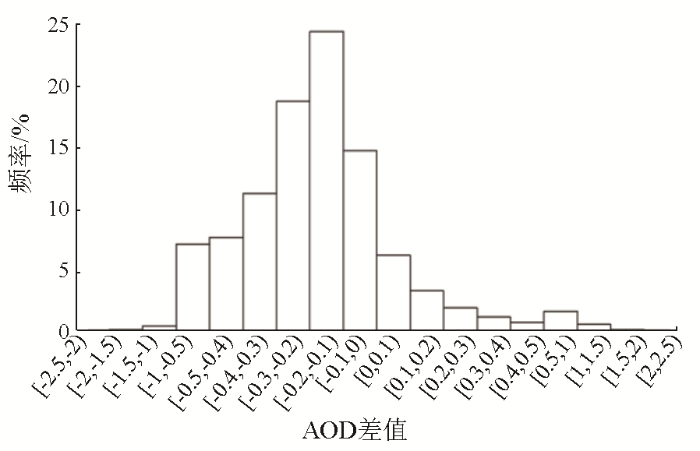
图6
MODIS AOD与FY-4A AOD的频率差异直方图
Fig.6
Histogram of frequency differences between MODIS AOD and FY-4A AOD
4 结论
利用RF,GBRT、XGBoost和BPNN这4种机器学习方法,基于2021年FY-4A卫星对AOD进行反演,分析模型输入参数对AOD反演结果的影响,并将反演结果与AERONET地基观测数据结果和MODIS气溶胶产品进行比较验证,得出以下结论:
1)基于FY-4A/AGRI数据,4种机器学习方法建模训练中反演值与站点观测值的R,MAE,RMSE分别在0.90以上,0.09以下,0.14以下,反演值与站点观测值的相关性较高且误差较小。说明利用机器学习反演AOD具有一定的可行性。
2)独立验证时,4种方法与站点观测值的R均在0.76以上,MAE和RMSE分别在0.15和0.26以下,至少44%的反演结果落在EE内。GBRT时间稳定性最高,R达到0.82,MAE和RMSE分别降低到0.16和0.25,约47%的反演结果落在EE内。BPNN,XGBoost和RF精度次之。
3)FY-4A AOD与MODIS AOD产品相比,两者的空间分布特征与趋势相一致。两者之间的AOD偏差主要分布在[-1.0,0)之间,占比达到83.57%,表明MODIS AOD与FY-4A AOD反演结果具有较好的一致性,且FY-4A AOD大多高于MODIS AOD。
参考文献
Atmospheric correction of multispectral VNIR remote sensing data:Algorithm and inter-sensor comparison ofAerosol and surface reflectance products
[J].
Deriving a global and hourly data set of aerosol optical depth over land using data from four geostationary satellites:GOES-16,MSG-1,MSG-4,and himawari-8
[J].
Aerosols and human health:A multiscale problem
[J].
The MODIS 2.1-/ spl mu/m channel-correlation with visible reflectance for use in remote sensing of aerosol
[J].
Second-generation operational algorithm:Retrieval of aerosol properties over land from inversion of Moderate Resolution Imaging Spectroradiometer spectral reflectance
[J].
Aerosol properties over bright-reflecting source regions
[J].
Deep blue retrievals of Asian aerosol properties during ACE-asia
[J].
Evaluation of MODIS,MISR,and VIIRS daily level-3 aerosol optical depth products over land
[J].
Evaluation and possible uncertainty source analysis of JAXA Himawari-8 aerosol optical depth product over China
[J].
FY-1C/1D全球海上气溶胶业务反演算法研究
[J].
Development of aerosol retrieval algorithm over global ocean using FY-1C/1D data
[J].
利用风云2C静止卫星可见光资料反演气溶胶光学厚度
[J].
Retrieval of aerosol optical depth from Fengyun-2C geostationary satellite observation:Theory and implementation
[J].
风云三号卫星气溶胶光学厚度产品的适用性验证
[J].
Verification of aerosol optical depth observed by FY-3 satellite
[J].
Assimilation of next generation geostationary aerosol optical depth retrievals to improve air quality simulations
[J].
A simple band ratio library (BRL) algorithm for retrieval of hourly aerosol optical depth using FY-4A AGRI geostationary satellite data[J].Remote Sensing
气溶胶定量遥感的机器学习方法综述
[J].
Review of machine learning methods for aerosol quantitative remote sensing
[J].
Uncertainty analysis of neural-network-based aerosol retrieval
[J].
Global evaluation of the Collection 5 MODIS dark-target aerosol products over land
[J].
FY-4A/AGRI aerosol optical depth retrieval capability test and validation based on NNAeroG
[J].
Deep learning in environmental remote sensing:Achievements and challenges
[J].
Wavelength dependence of the optical depth of biomass burning,urban,and desert dust aerosols
[J].
Improving the estimation of weighted mean temperature in China using machine learning methods
[J].
The Collection 6 MODIS aerosol products over land and ocean
[J].
Towards a long-term global aerosol optical depth record:Applying a consistent aerosol retrieval algorithm to MODIS and VIIRS-observed reflectance
[J].
Continuing the MODIS dark target aerosol time series with VIIRS
[J].
Himawari-8/AHI aerosol optical depth detection based on machine learning algorithm
[J].
1980—2018年中国极端高温事件时空格局演变特征
[J].
DOI:10.13249/j.cnki.sgs.2022.03.018
[本文引用: 1]

基于全国2 419个气象站1980—2018年逐日气象观测资料,利用Mann-Kendall突变检验、滑动t检验、空间自相关及标准差椭圆等方法,选取4个典型的极端高温指数,分析了中国极端高温事件时空格局演变特征。结果表明:① 中国近40 a来夏天日数、热夜日数、暖夜日数和暖昼日数均呈显著的上升趋势,4个指数均在20世纪80、90年代偏少,2000年以后逐渐增加,4个极端高温指数均在2000年左右发生显著变化。② 4种极端高温指数的空间自相关主要是以高?高和低?低2种空间聚集形态为主,夏天日数和热夜日数的聚集性较强,近40 a来暖夜日数和暖昼日数的空间聚集性先增强后减弱,且空间聚集性分布格局由高?高包围低?低转变为低?低包围高?高。③ 4个指数变化率最大的站点均位于南方地区,其中夏天日数变化率最大的站点呈东西向分布格局,其余3个指数变化率最大的站点呈南北向分布格局,西南、西北地区交界地带夏天日数和暖昼日数在近40 a来变化率均显著高于全国其他地区,华东沿海地区暖夜日数的变化趋势方向性分布最明显,且变化趋势高于全国其他地区。
Spatio-temporal variations of extreme high temperature event in China from 1980 to 2018
[J].
DOI:10.13249/j.cnki.sgs.2022.03.018
[本文引用: 1]
Extreme high temperature is extremely destructive and influential, and characterizing its change over time and space can provide help to guide future efforts to mitigate impacts of climate change. Based on the daily scale observation data of 2419 meteorological stations in China, the trend analysis, the time-lapse analysis and Mann Kendall mutation test were used to study the change characteristics of extreme high temperature with time in China in the past 40 years. The trend change and distribution pattern (direction feature) of the extreme high temperature distribution pattern in the corresponding years were explored by using Moran index and standard deviation ellipse respectively. The results show that: 1) The number of summer days, hot night days, warm night days and warm days in China showed a significant upward trend. The four indexes were less in the 1980s and 1990s, and gradually increased after 2000 and commonly changed significantly circa 2000;2) The spatial autocorrelation of the four extreme temperature indices was mainly high-high and low-low. The summer days and hot night days had strong aggregation, while the spatial aggregation of warm night days and warm days first increased and then decreased in past 40 years, and the spatial distribution pattern of warm night days and warm days changed from high-high surrounding low-low to low-low surrounding high-high; 3) The most obvious points of directional distribution of change trend of Summer days, warm days and hot night days are in the north. The stations of summer days and warm days showed the southeast-northwest distribution pattern, while the stations of hot night days showed the East-West distribution pattern. The stations with the largest change trend of summer days are East-West distribution pattern, while the stations with the largest change trend of hot night days, warm night days and warm days are north-south distribution pattern. The most significant changes of the four extreme temperature indices are in southern China. The change rates of summer days and warm days in the border areas of Gansu, Sichuan, Shaanxi and Chongqing in past 40 years are higher than those in other regions of China. The directional distribution of change trend of warm night days in Zhejiang and Fujian is the most obvious, and the change trend is higher than that in other areas of China. Our results provide meaningful information for a deeper understanding of the spatiotemporal variations in temperature extremes across the mainland China.
Spatial and temporal distribution of aerosol optical depth and its relationship with urbanization in Shandong Province
[J].
Estimating the contribution of local primary emissions to particulate pollution using high-density station observations
[J].
Consistent response of Indian summer monsoon to Middle East dust in observations and simulations
[J].
