

0 引言
露天开采和井工开采是煤矿资源开采的主要方式,全球煤炭生产增加值的75%来自露天煤矿[1]。我国煤矿资源丰富,煤炭在能源生产结构中处于绝对主体地位[2]。露天煤矿是我国煤炭工业重要组成部分,然而在矿体勘探、煤矿开采和煤炭运输过程中,露天采场、工业场地以及尾矿库等地表采矿元素逐步形成[3],矿区内自然环境的原始状态发生变化,即使矿区闭坑,这些变化的综合效应也会持续作用于矿区,造成土地破坏、土壤贫化、水质与大气污染、生物多样性削减等一系列生态环境问题[4-
传统矿区生态监测指标,如pH值、平均每日二氧化硫含量[7]以及重金属含量[8]等,获取严重依赖专业仪器的实地采样。随着遥感技术的发展,遥感数据可以实现植被、温度和景观等要素的动态监测,改变了传统依赖实地考察的生态环境评价方法,为大范围、长时间序列生态环境评价提供基础数据支撑。归一化植被指数(normalized difference vegetation index,NDVI)[9]、增强植被指数、地表温度(land surface temperature,LST)[10]以及植被净初级生产力[11]等经典遥感反演指数均被验证作为生态环境评价指标具有一定可行性。然而由于生态系统的复杂性,与之相关的影响要素众多且复杂,仅凭单一评价指标无法全面反映生态环境质量状况,学者们就生态环境反演指标的选择和指标间权重的确定进行了更深入的研究。2006年,我国环保总局发布了《生态环境状况评价技术规范》,提出了通过规定权重耦合6种不同评价指标的生态环境状况指数(ecological index,EI)。2013年,徐涵秋[12]在EI的基础上,提出了完全基于遥感数据的遥感生态指数(remote sensing based ecological index,RSEI)。RSEI耦合了绿度、干度、湿度和热度指标,具有客观性、指标数据易获取以及评价结果可视化等优点。当前,国内外众多学者聚焦于矿区开采活动对生态环境造成的影响,有些学者直接采用RSEI作为评估工具[13-14]; 有些学者在RSEI的基础上进行改进,如岳佳乐等[15]计算植被覆盖度和景观格局指数,基于多智能体遗传算法的投影寻踪聚类模型对陕西胡家河矿区的生态环境质量进行评价; 刘英等[16]提取纯净像元反射率并基于压力-状态-响应模型(pressure-state-response,PSR)模型耦合土地利用类型、夜间灯光、盐分指数等指标,实现了戈壁荒漠露天矿区生态环境反演。因此,根据具体环境特征对生态模型进行因地制宜的改进,能有效提升生态环境质量评价的精准度。此外,对于矿区生态环境预测的研究较少,钟安亚等[17]基于灰色模型,预测了王平煤矿短期RSEI走势,但是灰色模型对于波动较大的RSEI预测能力有限; 王锦洋等[18]基于BP神经网络和遗传算法预测了三道庄露天矿区未来8 a的生态质量,然而神经网络涉及大量的迭代计算,需要较长的训练时间。目前针对矿区特定条件下的生态预测仍面临挑战,需要相关科研人员深入研究。
本文旨在利用时序遥感影像,以山西省平朔朔南露天煤矿区为例,构建能够综合评价露天煤矿区生态质量的露天煤矿遥感生态指数(remote sensing ecological index of open-pit coal mining area,OMRSEI),在此基础上,分析该区域长时间(2013—2023年)序列生态环境时空演变特征,并预测研究区2025—2027年的生态环境状况,为露天矿区生态环境保护提供依据。
1 研究区概况与数据源
1.1 研究区概况
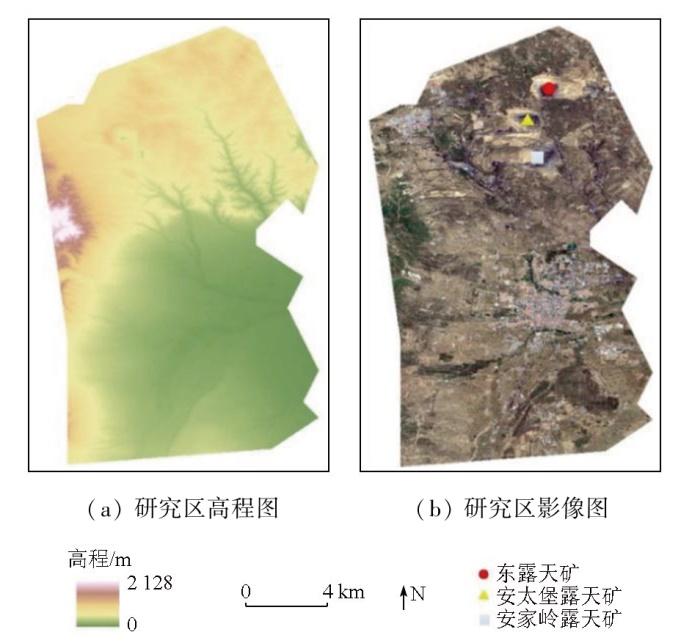
为突出对比露天采矿活动以及城镇建设导致的生态环境变化,本文选取山西省平朔朔南矿区和南部主城区作为研究对象(图1)。平朔朔南矿区是我国主要的煤炭生产基地,整个煤矿区设计年产煤炭8 100万t,包括了目前规模最大、技术最先进的露天煤矿: 东露天矿、安太堡露天矿和安家岭露天矿。矿区位于山西省朔州市西北部(112°14'~112°32'E,39°9'~39°37'N),地处黄土高原东部地区,为典型的温带大陆性季风气候。地形轮廓总体上是北、西两面环山,山势较高,中间是桑干河域冲积平原,相对较低。平朔朔南矿区长时间煤炭开采形成的露天采场、排土场以及配套的工业用地等典型地物直接影响着研究区地表生物和物理特征,持续破坏着研究区原本脆弱的生态环境[19]。
图1
1.2 数据源
为评价平朔朔南矿区生态环境的长期变化,本文通过谷歌地球引擎(Google Earth Engine,GEE)云平台(
2 研究方法
2.1 PSR模型
PSR模型是一种用于研究生态环境的模型[20],包括人为压力、环境状况和环境响应3个方面。在本文研究区范围内,煤尘污染是导致露天煤矿区地表生态环境恶化的最重要因素之一,特别是在储煤场、燃煤发电厂以及煤炭运输道路等地,颗粒物差值指数(difference index,DI)[21]可以有效量化煤尘污染程度; 干度指数(normalized difference built-up and soil index,NDBSI)为裸土指数(soil index,SI1)和建筑指数(index-based build-up index,IBI)的均值,可以表征地表干燥程度。本文选用DI和NDBSI作为压力指标。在压力要素的作用下,矿区生态环境产生一定程度的变化并呈现一定的状态,植被健康指数(vegetative health index,VHI)[19]以及土壤水分监测指数(soil moisture monitoring index,SMMI)[22]是量化煤矿区植被健康程度和土壤储水状态的常用指标,因此本文选择其作为环境状态指标。LST作为气温的主要驱动因素[23],被广泛应用于描述地表物理性质,研究区内,煤矿开采活动产生大量热量且裸露的煤炭和煤矸石也容易吸收热量甚至自燃,从而导致局部LST升高,基于热红外数据源反演研究区LST具有重要意义; 缨帽变换是旋转坐标空间的线性变换,经过缨帽变换得到的湿度分量(wetness component,WET)可以表征研究区水体、植被以及表层土壤的湿度情况[12]; 土壤盐度(salt index,SI2)对作物生长和水资源管理具有重要意义,特别是在干旱半干旱地区[24]。本文使用LST,WET以及SI2表征环境响应。各生态因子计算方式见表1。
表1 生态指标计算方法
Tab.1
| 一级 指标 | 二级 指标 | 效应① | 计算公式 |
|---|---|---|---|
| 压力 | DI | - | DI=R-N |
| NDBSI | - | SI1= IBI= NDBSI=(SI+IBI)/2 | |
| 状态 | VHI | + | NDSVI=(S1-R)/(S1+R) NRI=N/G NDVI=(N-R)/(N+R) VHI=PC1(NDVI,NDSVI,NRI) |
| SMMI | + | SMMI= | |
| 响应 | LST | - | L=gain×DN+bias T=K2/ln(K1/L+1) LST=T/[1+(λT/ρ)ln ε]-273.15 |
| WET | + | WET=0.151 1B+0.197 3G+0.328 3R+ 0.340 7N-0.711 7S1-0.455 9S2 | |
| SI2 | - | SI2= |
①“+”表示该指标为正向指标,“-”表示该指标为负向指标; R,G,B,N,S1以及S2分别为Landsat8 OLI/TIRS的红光、绿光、蓝光、近红外、短波红外1波段和短波红外2波段的反射率; PC1为第一主成分; DN为像元灰度值; gain和bias分别为热红外波段的增益与偏置值; K1和K2为热红外波段转换常数; λ为地表发射辐射的波长; ε为地表比辐射率; ρ为1.438×10⁻² mK。
考虑到各指标量纲不同,无法进行相互比较,故本文采用极差变化法进行标准化处理,公式为:
式中:
2.2 OMRSEI构建
2.3 莫兰指数
莫兰指数(Moran’s index)是衡量在同一个空间内数值之间潜在相互依赖性的一个重要研究指标,常用于分析事物的空间自相关[26]。本文使用全局莫兰指数(global Moran’s index,GMI)和局部莫兰指数(local Moran’s index,LMI)检测平朔朔南矿区生态指数的空间聚类和异常。GMI从整体情况刻画了OMRSEI空间相关性的总体趋势,LMI测算局部地区OMRSEI集聚情况。公式分别为:
式中: Cp和Cq分别为第p个和第q个像元对应OMRSEI值;
2.4 时序预测模型
时序预测是指预测时序数据在未来一段时间内的变化。指数平滑方法是时序预测领域相对简便且稳健的预测方法[27],适用于中短期预测,选择其预测研究区未来生态环境质量的走势。指数平滑可分为一次平滑,二次平滑和三次平滑。一次平滑法预测值是过去观测值的加权平均值,且权重随观测值离预测值时序距离的增大呈指数递减; 二次平滑法考虑数据趋势性; 三次平滑法在二次平滑法的基础上考虑二次趋势性。所有平滑法的精度均受初始值和平滑系数影响。本文多次迭代,选择均方根误差最小值为最优解确定平滑方法、初始值以及平滑系数。计算公式分别为:
式中:
3 结果和分析
3.1 指标耦合与时空分析
表2 研究区OMRSEI各指标权重
Tab.2
| 一级指标 | 二级指标 | 熵权法权重 | 层次分析 法权重 | 组合权重 |
|---|---|---|---|---|
| 压力 | DI | 0.089 2 | 0.187 5 | 0.138 4 |
| NDBSI | 0.074 0 | 0.250 0 | 0.162 0 | |
| 状态 | VHI | 0.734 7 | 0.187 5 | 0.461 1 |
| SMMI | 0.021 9 | 0.125 0 | 0.073 5 | |
| 响应 | LST | 0.045 8 | 0.125 0 | 0.085 4 |
| WET | 0.016 4 | 0.062 5 | 0.039 5 | |
| SI2 | 0.017 9 | 0.062 5 | 0.040 2 |
通过组合权重,耦合上述7个指标,计算OMRSEI。为了探讨研究区的生态环境空间变化,本文基于python采用最大类间方差法确定研究区各研究年份OMRSEI之间的阈值,结果如表3所示,并采用各年份均值作为OMRSEI分级依据,即OMRSEI值为: >0.584 7,(0.531 4,0.584 7],[0.443 6,0.531 4],<0.443 6,分别对应研究区生态质量为优、良、中、差。
表3 研究区OMRSEI阈值
Tab.3
| 研究年份 | 阈值1 | 阈值2 | 阈值3 |
|---|---|---|---|
| 2013年 | 0.400 1 | 0.475 0 | 0.540 8 |
| 2015年 | 0.433 0 | 0.529 5 | 0.577 8 |
| 2017年 | 0.481 0 | 0.581 2 | 0.631 2 |
| 2019年 | 0.431 5 | 0.518 6 | 0.562 1 |
| 2021年 | 0.454 8 | 0.537 4 | 0.596 4 |
| 2023年 | 0.461 3 | 0.546 8 | 0.599 9 |
| 均值 | 0.443 6 | 0.531 4 | 0.584 7 |
图2
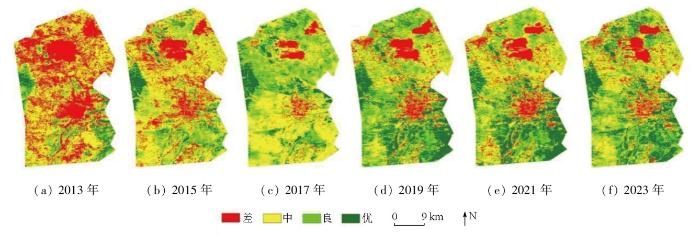
图2
研究区OMRSEI分级时空分布图
Fig.2
Spatial and temporal distribution map of OMRSEI in the research area
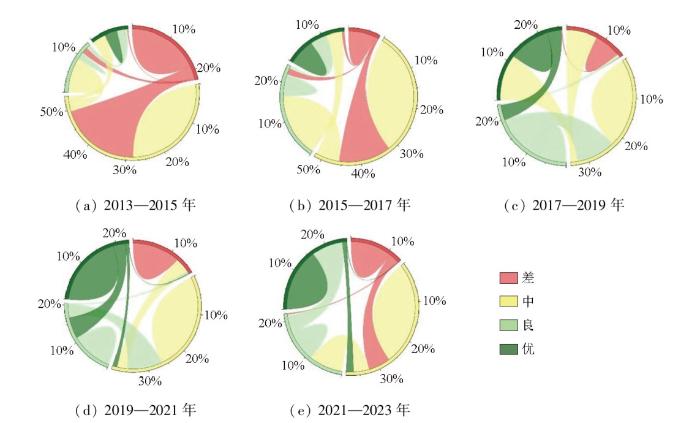
本文借助小提琴图和比例弦图对OMRSEI的变化特征进行了深度剖析。小提琴图以其独特优势,不仅精准描绘了各年份数据的分布形态,而且展示了数据的集中趋势与离散程度。本文构建了涵盖各研究年份的小提琴图,如图3所示。其中,箱体部分精确反映了各年份OMRSEI在25%及75%分位数的数值,箱体中间的横线则代表了各年份OMRSEI均值。从图3看出,除2021年OMRSEI均值略微波动外,研究区生态环境质量总体呈上升趋势。具体而言,2013—2019年,OMRSEI均值均呈现出逐年递增的趋势,表明研究区的生态环境质量在此期间得到了显著改善。尽管2021年OMRSEI均值相较于2019年小幅降低,其整体依然维持在一个较高的水平。这些数据综合反映了研究区在生态环境保护方面所取得的积极成效。比例弦图由环和弦构成,环的长度表示该类别所占的比例,弦的宽度表示2个类别之间的转换强度。为进一步量化平朔朔南矿区生态环境质量,本文构建了各个研究年份之间生态质量变化比例弦图,以揭示OMRSEI各等级在所选时间段内的转换情况,如图4所示。从图4看出,各等级OMRSEI均发生较为频繁的相互转化,其中转化趋势较大的是2013—2015年,OMRSEI由差转换为中。尽管平朔朔南矿区生态质量逐步改善,生态环境质量优、良的总比重从2013年的13.51%增长到2023年的47.63%,但OMRSEI为差、中在矿区生态质量分级体系中的比重仍超过50%,因此平朔朔南矿区生态修复亟须实施更为有效的治理与修复措施,以促进生态环境的整体提升,实现可持续发展目标。
图3
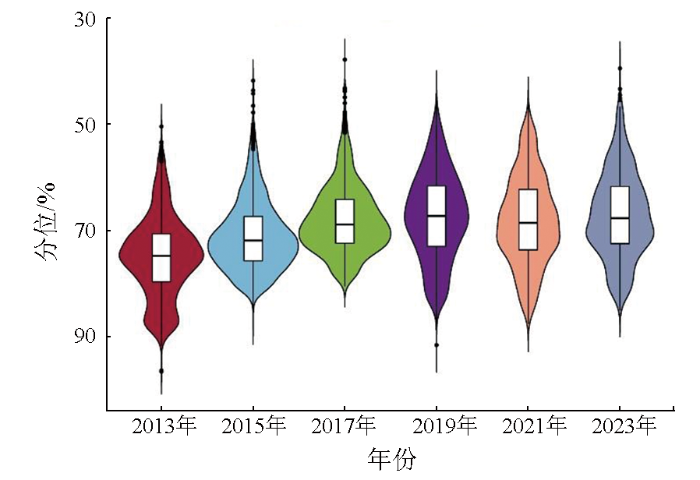
图4
3.2 OMRSEI聚类分析
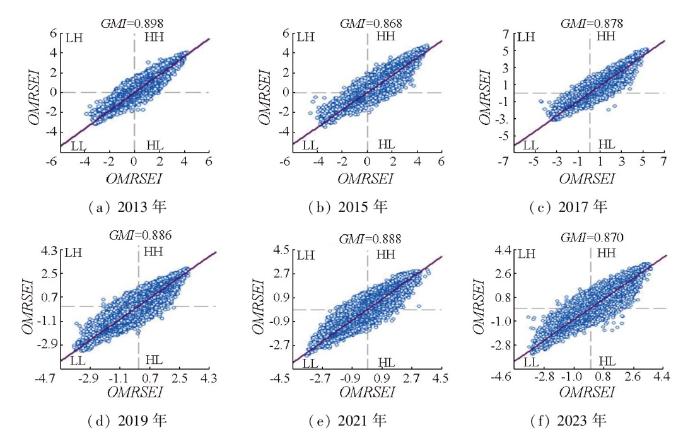
本文基于GMI,构建了能够反映平朔朔南矿区空间自相关结果的莫兰散点图,如图5所示,图中LH,HH,LL和HL分别为低高聚集区、高高聚集区、低低聚集区和高低聚集区。散点主要分布在第一、三象限,说明OMRSEI等级空间分布具有较强正相关性,呈聚集性而非随机性。从变化趋势来看,全局莫兰指数值波动下降。2013年,OMRSEI呈现大面积聚集,GMI最高,达到0.898,OMRSEI的空间聚类程度较高。2015—2023年,生态修复使得完整大块生态较差地区内部出现优良,生态斑块逐渐破碎,表明OMRSEI空间聚类度下降。
图5
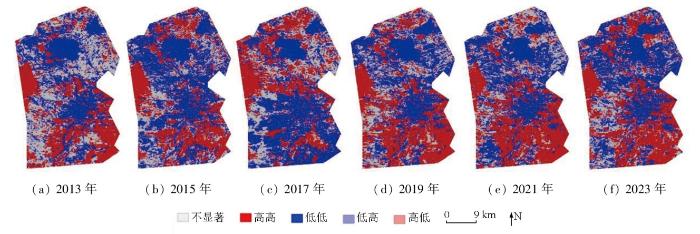
本文基于LMI进行空间自相关分析,并利用LISA聚类可视化了OMRSEI的5种聚类特征,即不显著、高高、低低、高低以及低高,由图6所示。平朔朔南矿区生态环境质量空间自相关特征以高高聚类和低低聚类为主,说明研究区OMRSEI的空间分布相互联系紧密。其中,低低聚类主要集中在露天煤矿区和朔州市区,高高聚类集中在中西部林地和东南部耕地。高高聚类和低低聚类大致分别对应生态环境质量的改善和生态环境质量的退化,这与其他学者研究结果保持一致[29]。2013—2023年间,低低聚类对应的生态环境质量退化区域逐步减小,高高聚类对应的生态环境质量改善区域逐步增加,进一步说明了露天煤矿开采以及城镇发展对生态环境的扰动,矿区排土场修复、朔州市生态扩容等措施对生态环境的修复作用。
图6
3.3 OMRSEI模拟预测
本文以平朔朔南矿区2013—2023年的OMRSEI均值为原始数据,对2025—2027年矿区生态状况进行预测,经过多次迭代,以均方根误差为依据优选最优方法及参数,最终选定三次平滑法,初始值为0.487,平滑系数为0.2。优选模型均方根误差为0.028,均方误差为0.001,平均绝对误差为0.023,平均绝对百分比误差为0.046。由模型精度指标可以看出,误差在可以接受的范围内,本文所使用的针对矿区生态预测模型具有较高的准确性和可靠性,能够从历史时序数据中预测到矿区未来生态质量的变化趋势。最终预测结果如图7所示,可以看出2013—2019年,受模型局限,拟合结果并不理想,但是随着模型对时序数据的逐步学习,2019—2023年拟合结果越来越精确; 2025—2027年研究区生态环境质量逐步上升,在2027年到达最大值0.544。
图7
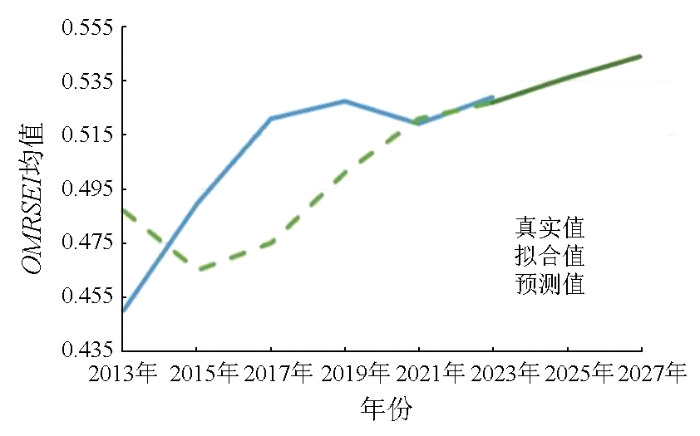
图7
平朔朔南矿区OMRSEI均值预测图
Fig.7
Average prediction map of the OMRSEI in Pingshuo Shuonan mining area
4 讨论与结论
4.1 OMRSEI有效性讨论
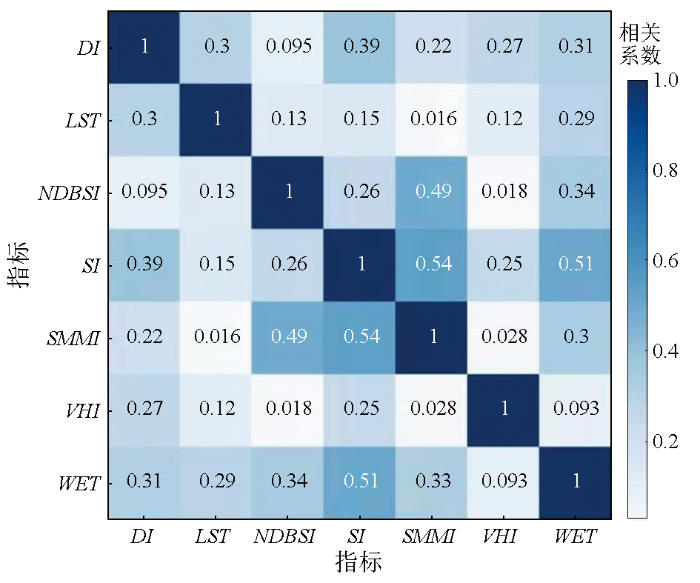
本文以Landsat8影像为数据源,基于PSR模型选取了7个与矿区生态环境相关的遥感指数作为评价指标,构建了能综合反映矿区生态的OMRSEI,为进一步验证OMRSEI的有效性,本文采用相关性分析和对比分析的方法评估研究区OMRSEI。所选指数Pearson相关系数绝对值如图8所示。可以看出绝大部分指数间相关系数小于0.4,呈现基本不相关或弱相关关系; 少许指标,如NDBSI-SMMI,SI-SMMI和SI-WET受数据源一致和较差生态环境地区共性影响,Pearson系数在0.4~0.6之间,呈中度相关; 无指数之间呈现高度相关。因此,OMRSEI指标选取较为合理。
图8
将露天矿实际影像和OMRSEI进行分级对比,如图9所示。从中可以看出,2013—2023年期间,安太堡露天矿和安家岭露天矿排土场逐步修复,露天采场呈现东移态势。2013—2019年间,东露天矿开采加剧,露天采场及排土场逐步扩增,2021—2023年间,东露天矿北部外排土场逐步修复。受集约采矿活动和环境修复影响,安太堡露天矿和安家岭露天矿OMRSEI评级为差、中的板块逐步缩小。至2023年,安太堡露天矿和安家岭露天矿西部排土场OMRSEI评级到达优、良。东露天矿OMRSEI变化也和遥感影像呈现的排土场面积变化一致,呈现先增加后减少的趋势。综上,利用OMRSEI指数评价的矿区生态和实际趋势情况一致,这说明应用OMRSEI描述矿区生态环境质量是合理的。
图9
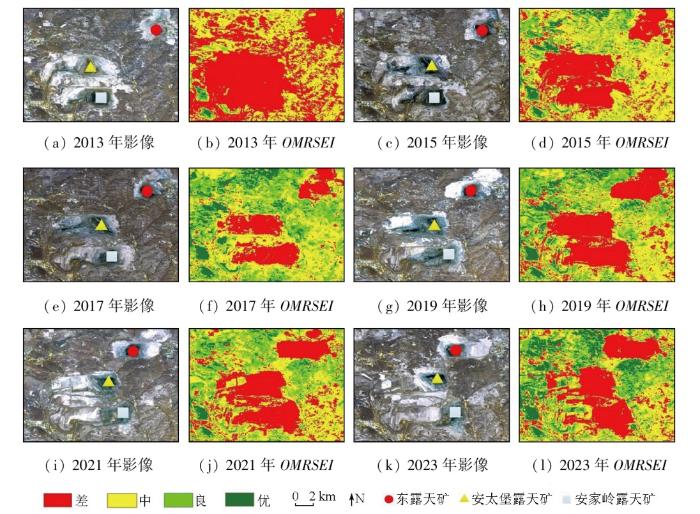
图9
平朔朔南矿区2013—2023年遥感影像和生态质量对比图
Fig.9
Comparison of remote sensing imagery and ecological quality in Pingshuo Shuonan mining area during 2013—2023
综上所述,使用综合赋权法构建的OMRSEI指数可以有效进行矿区生态质量评估,对于露天煤矿开采和资源城镇建设造成的生态环境扰动能够有效捕捉。OMRSEI可以为矿区生态质量评价提供一种新的方法。
4.2 结论
本研究基于GEE平台反演多种生态指数,采用熵权法与层次分析法相结合,构建了适用于露天煤矿的生态环境评价指标OMRSEI,并基于相关性分析和对比分析进行验证,通过对研究区2013—2023年间的生态环境质量进行时序分析与预测,得出以下主要结论:
1)通过组合赋权构建的遥感指标OMRSEI,显著体现了露天煤矿区生态环境的空间相关性,为量化露天煤矿生态质量提供了新视角。
2)平朔朔南矿区生态环境质量除2021年出现略微浮动外,总体随排土场修复呈上升趋势。
3)基于2013—2023年的OMRSEI时序数据,采用指数平滑法预测研究区2024—2027年生态质量,结果表明平朔朔南矿区生态质量持续向好发展。
然而,平朔朔南露天煤矿与其他煤矿区在地质、气候等方面存在差异。因此,OMRSEI能否在不同类型煤矿区实现科学、精准的生态环境评价,仍需开展多区域对比实验,这也是后续研究亟须拓展的重要方向。
参考文献
Research progress of soil and vegetation restoration technology in open-pit coal mine:A review
[J].
DOI:10.3390/agriculture13020226
URL
[本文引用: 1]

Open-pit mining has caused extensive land destruction, including land abandonment and reduction in agricultural land, resulting in serious environmental problems. Ecological restoration and mine reclamation have become important components of the sustainable development strategies in Inner Mongolia, China. Therefore, the rehabilitation of mines and agricultural land is vital and has attracted widespread attention from the Chinese government. In this light, we reviewed the progress of mine restoration technologies in China in recent years and summarized the integrated technology of open-pit mine reclamation with microbial restoration technology as the core, ecological vegetation restoration as the essential, and soil restoration and improvement as the promotion. As a cost-effective and environmentally beneficial technique, combining the microbial recovery technology with vegetation and the recovery of vegetation and the improvement of the soil is widely recommended in the mining reclamation area. At the same time, we comprehensively analyzed the current status and progress of ecological restoration technology and put forward the development direction of green mining in the future. In conclusion, this review can provides guiding the sustainable development of green, ecological mines, as well as provide reference for mining reclamation and agricultural land restoration and other related fields.
碳中和背景下煤炭矿山生态修复的几个基本问题
[J].
Several basic issues of ecological restoration of coal mines under background of carbon neutrality
[J].
矿区生态环境定量遥感监测研究进展与展望
[J].
Progress and prospect of the quantitative remote sensing for monitoring the eco-environment in mi-ning area
[J].
矿山地质环境灾变与保护修复研究现状与展望
[J].
Research status and prospect of mining-induced geo-environmental hazards and geological environment protection
[J].
Geochemical controls on the enrichment of fluoride in the mine water of the Shendong mining area,China
[J].
LiDAR mapping of atmospheric atomic mercury in the Wanshan area,China
[J].
Comprehensive evaluation of ecological environment quality of mining area based on sustainable deve-lopment indicators:A case study of Yanzhou Mining in China
[J].DOI:10.1007/s10668-020-00935-3 [本文引用: 1]
湘西汞矿区土壤中重金属的空间分布特征及其生态环境意义
[J].
Spatial distribution and ecological significance of heavy metals in soils from Chatian mercury mining deposit,western Hunan Province
[J].
Grey clustering evaluation on regional eco-environmental quality based on normalized index value
[J].
Monitoring land surface thermal environments under the background of landscape patterns in arid regions:A case study in Aksu River basin
[J].
采矿活动和气候变化对煤矿区生态环境损失的影响
[J].
Effects of mining activity and climatic change on ecological losses in coal mining areas
[J].
区域生态环境变化的遥感评价指数
[J].
A remote sensing index for assessment of regional ecological changes
[J].
基于遥感生态指数的矿井关闭前后生态环境时空变化规律研究
[J].
Study on the spatio-temporal variation regularity of ecological environment before and after mine closure based on remote sensing ecological index
[J].
义能矿区景观格局及生态环境时空动态遥感监测
[J].
DOI:10.11873/j.issn.1004-0323.2024.2.0426
[本文引用: 1]
煤炭资源在国民经济中占有非常重要的地位,而煤炭的开采则会引发诸多环境问题,制约矿区绿色可持续发展。对矿区的景观格局及生态环境时空动态监测,能为矿区生态环境治理提供决策支持, 缓解人与自然之间的矛盾,引导矿区生态环境协调发展。以山东省济宁市汶上县义能矿区为研究区,基于2000~2021年Landsat影像,采用景观分类方法、景观格局指数法、遥感生态指数(Remote Sensing Ecological Index,RSEI)法和重心迁移模型,分析义能矿区景观格局及生态环境时空动态变化。结果表明:2000~2021年义能矿区最大斑块指数下降,景观破碎度和形状指数上升,煤矿开采对矿区原有景观格局影响较大;生态环境质量呈现下降—上升—下降变化趋势;绿度和干度指标对生态环境影响较大;义能矿区差等级和优秀等级迁移幅度较大。
Temporal and spatial dynamic monitoring of landscape pattern and ecological environment in Yineng mining area
[J].
基于MAGA-PPC模型的胡家河矿区生态环境质量评价
[J].
Ecological environment quality eva-luation of Hujiahe mining area based on MAGA-PPC
[J].
基于时间序列模型的戈壁荒漠露天矿生态环境评价
[J].
Ecological environmental assessment of Gobi desert open-pit mine based on time series model
[J].
基于RSEI的北京王平煤矿生态环境修复效果评估及预测
[J].
Evaluation and prediction of ecological environment restoration effect of Beijing Wangping Coal Mine based on RSEI
[J].
基于PSR和GA-Elman模型的露天矿区生态安全评价研究
[J].
Research on ecological security evaluation of open-pit mine area based on PSR and GA-Elman model
[J].
Remote-sensing evaluation and temporal and spatial change detection of ecological environment quality in coal-mining areas
[J].
DOI:10.3390/rs14020345
URL
[本文引用: 2]
The large-scale development and utilization of coal resources have brought great challenges to the ecological environment of coal-mining areas. Therefore, this paper has used scientific and effective methods to monitor and evaluate whether changes in ecological environment quality in coal-mining areas are helpful to alleviate the contradiction between human and nature and realize the sustainable development of such coal-mining areas. Firstly, in order to quantify the degree of coal dust pollution in coal-mining areas, an index-based coal dust index (ICDI) is proposed. Secondly, based on the pressure-state-response (PSR) framework, a new coal-mine ecological index (CMEI) was established by using the principal component analysis (PCA) method. Finally, the coal-mine ecological index (CMEI) was used to evaluate and detect the temporal and spatial changes of the ecological environment quality of the Ningwu Coalfield from 1987 to 2021. The research shows that ICDI has a strong ability to extract coal dust with an overall accuracy of over 96% and a Kappa coefficient of over 0.9. As a normalized difference index, ICDI can better quantify the pollution degree of coal dust. The effectiveness of CMEI was evaluated by four methods: sample image-based, classification-based, correlation-based, and distance-based. From 1987 to 2021, the ecological environment quality of Ningwu Coalfield was improved, and the mean of CMEI increased by 0.1189. The percentages of improvement and degradation of ecological environment quality were 71.85% and 27.01%, respectively. The areas with obvious degradation were mainly concentrated in coal-mining areas and built-up areas. The ecological environment quality of Pingshuo Coal Mine, Shuonan Coal Mine, Xuangang Coal Mine, and Lanxian Coal Mine also showed improvement. The results of Moran’s Index show that CMEI has a strong positive spatial correlation, and its spatial distribution is clustered rather than random. Coal-mining areas and built-up areas showed low–low clustering (LL), while other areas showed high–high clustering (HH). The utilization and popularization of CMEI provides an important reference for decision makers to formulate ecological protection policies and implement regional coordinated development strategies.
基于PSR模型的大连湾海岸带生态安全评价研究
[J/OL].
An evaluation research on ecological security evaluation of Dalian Bay coastal zone based on the Pressure-State-Response model
[J/OL].
一种基于差值指数的颗粒物PM2.5浓度反演新方法
[J].
One new method of PM2.5 concentration inversion based on difference index
[J].
Long-term Landsat monitoring of mining subsidence based on spatiotemporal variations in soil moisture:A case study of Shanxi Province,China
[J].
Normalised difference spectral indices and urban land cover as indicators of land surface temperature (LST)
[J].
Monitoring soil salinity via remote sen-sing technology under data scarce conditions:A case study from Turkey
[J].
A comparative analysis of the principal component analysis and entropy weight methods to establish the indexing measurement
[J].
中国区域生态福利绩效水平及其空间效应研究
[J].
Research on regional ecological well-being performance and spatial effect in China
[J].
Exponential smoothing model selection for forecasting
[J].DOI:10.1016/j.ijforecast.2005.08.002 URL [本文引用: 1]
关于印发朔州市“十四五”生态环境保护规划的通知:朔政发[2022]36号
[A/OL].(2022-8-26)[2024-6-12].http://szxxgk.shuozhou.gov.cn/zfwj_1/202212/t20221216_420310.shtml.
Notice on the issuance of the “14th Five-Year Plan” ecological and environmental protection plan of Shuozhou City:Shuo Zheng Fa [2022]No.36
[A/OL].(2022-8-26)[2024-6-12].http://szxxgk.shuozhou.gov.cn/zfwj_1/202212/t20221216_420310.shtml.
