

0 引言
1 WUI研究分析
近年来WUI研究主题主要包含WUI定义、WUI区域划分、制图方法、管理策略、火灾风险评估和干预优先级评定等。部分WUI区域划分法汇总见表1,其中列举了代表性的WUI区域划分方法。它们采用了较为一致的WUI基本定义,但在WUI区域划分的方法和参数设置上有显著差异,包括建筑和植被具体范围、危险阈值设定、缓冲距离选择、移动窗格大小等。
表1 部分WUI划分方法汇总表
Tab.1
| 作者 | WUI子类 | 筛选要素及阈值 | 所用数据 | 年份 | 研究区 |
|---|---|---|---|---|---|
| Schug等 [11] | 交界WUI 和混合 WUI | 利用500 m半径圆形移动窗口计算建筑密度和植被覆盖率 住房密度大于每16.19 hm21栋房屋,并且野生植被覆盖率超过50%或低于50%但位于大型密集植被区域的2.4 km范围内 | 土地覆盖数据 建筑面积占比数据 | 2023年 | 全球 |
| Chen等[12] | 交界WUI 和混合 WUI | 建立400 m网格计算建筑密度和植被覆盖率 住房密度大于每16.19 hm21栋房屋,并且野生植被覆盖率超过50%或低于50%但位于大型密集植被区域的2.4 km范围内 | 土地覆盖数据 人口密度数据 建筑足迹数据 | 2024年 | 全球 |
| Carlson等[10] | 交界WUI 和混合 WUI | 根据不同的邻域半径大小,确定划分WUI的范围,论文中选择了100 m,200 m,300 m,400 m,500 m和1 500 m 住房密度大于每16.19 hm21栋房屋,并且野生植被覆盖率超过50%或低于50%但位于大型密集植被区域的2.4 km范围内 | 建筑足迹数据 土地覆盖数据 | 2022年 | 美国 |
| Johnston等[13] | 住房WUI、工业WUI 和公共设施WUI | 根据植被的可燃性和连通性算植被的权重燃料等级 根据不同的权重燃料等级创建可变宽度缓冲区域 冲区的最大宽度为2 400 m,燃料等级越高,燃烧成本越高,缓冲区越小 | 建筑足迹数据 土地覆盖数据 | 2018年 | 加拿大 |
| Bar-Massada等[14] | 交界WUI 和混合 WUI | 建成区缓冲区100 m内的像元作为候选像元 候选像元500 m半径内植被密度>50% 候选像元距离大型植被斑块<600 m | 建筑足迹数据 土地覆盖数据 | 2023年 | 欧盟 |
| Modugno等[15] | — | 距离建筑区域<200 m 距离野生植被区域<400 m | 建筑位置数据 土地覆盖数据 | 2016年 | 欧盟 |
当前针对WUI区域划分方法的研究,主要侧重于划分WUI时步骤的优化。对于划分时使用的建筑数据,Berg等的研究发现,相较于依照人口密度区块数据,通过建筑位置数据来统计建筑密度,进而划分出的WUI内的建筑物,其面临野火威胁的概率更高[8]。Huang等指出,利用NAIP航空影像并结合深度学习框架来检测WUI内的建筑物,比传统依赖商业卫星数据的方法能更精准地识别出处于野火风险中的建筑,并且借助建筑更新数据,能够有效捕捉WUI的动态变化[9]。此外,不同缓冲区大小设置对WUI面积和包含的建筑数量影响显著,Carlson等的研究表明,采用半径为500 m的移动窗格进行建筑密度统计,在区分建筑群与野生植被区域时表现最为平衡,既不会过度包含孤立建筑,也不会过度排除建筑群[10]。
然而,WUI区域划分方法的整体差异,仍缺乏针对性的对比分析和总结。为此,本研究首先依据WUI划分时筛选的主要对象将现有方法归为3类: ①建筑密度优先方法: 该类方法侧重于以建筑密度为核心指标,通过量化建筑密集程度来界定WUI区域; ②燃料等级优先方法: 该类方法根据植被易燃性和其与建筑的距离筛选出建筑周围的易燃野生植被区域,并将其划分为WUI区域; ③建筑植被缓冲区重合方法: 该类方法对建筑区域和植被区域建立固定距离的缓冲区,将同时处于两者缓冲区内的区域划分为WUI区域。
2 研究区概况及数据源
2.1 研究区概况
本研究以加拿大艾伯塔省伍德布法罗市为研究区域,基于微软加拿大建筑足迹数据集和土地覆盖数据集GLC_FCS 30对不同方法所划分的WUI区域范围进行评估,并结合加拿大火点数据和全球火迹地数据库MODIS MCD64A1,进一步展示了不同方法在火灾风险预测的有效性。
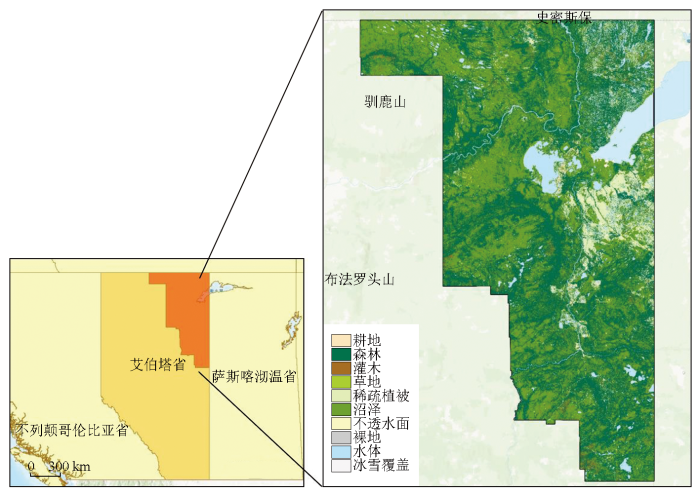
如图1所示,伍德布法罗市坐落于加拿大艾伯塔省的东北角,占地面积约10.5万km2。该地区地形以平坦开阔为主,平均海拔约390 m,主要由广袤的森林覆盖,其中以平原和低地最为显著。伍德布法罗市自然资源丰富,生态保护区众多,水系发达,尤其是奥尔巴尼河流域和阿萨巴斯卡河,为该地区提供了丰富的水资源。此外,该市还拥有庞大的奥尔巴尼沼泽地及其他湿地。这些水系不仅滋养了当地生态系统,也对生物多样性的维护起到了关键作用。该市被茂密的针叶林所环绕,主要树种包括云杉和松树。这些森林不仅为木材产业提供了宝贵的资源,也是当地野生动植物的重要栖息地。然而,林地的广泛分布也意味着一旦发生林火,火势可能迅速蔓延,对自然环境多样性保护和城市居住区域的基础设施和人群生命财产安全构成严重威胁。
图1
2.2 数据源及其预处理
本文利用建筑足迹数据和土地覆盖数据对伍德布法罗市的WUI区域进行不同方式的划分。随后根据历史火迹地和火点数据的分布特征,对不同划分方法进行了比较分析。
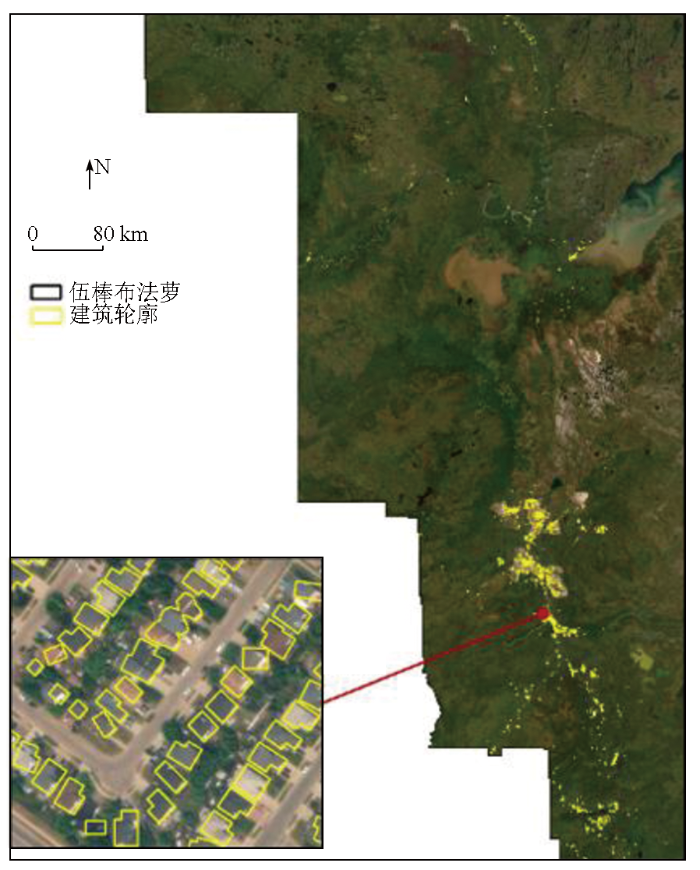
本文从微软加拿大建筑足迹数据库(
图2
本文的土地覆盖数据使用了GLC_FCS30—2020数据集(
火点和火迹地矢量数据均来自加拿大艾伯塔省的森林管理部门(
3 研究方法
3.1 建筑密度优先划分方法
建筑密度优先划分方法主要参照了Bar-Massada和Li等基于建筑位置数据的WUI划分方法[19-20]。根据土地覆盖类型判断是否属于野生植被: 野生植被包括森林、灌木丛、草原、湿地以及苔藓和地衣,非野生植被包括耕地、建成区、裸地和稀疏植被、冰雪和水。这类方法的WUI定义采用《美国联邦公报》标准定义的参数[21]: 住房密度超过6.17间房屋/km2,并且野生植被覆盖度大于50%的栅格被划为混合区域(intermix WUI); 住房密度超过6.17间房屋/km2,野生植被覆盖度少于 50%,但在半径2.4 km缓冲区内大型连续野生植被(面积大于5 km2)的比例超过75%的栅格被划为交界区域(interface WUI)。为了方便比较不同划分方法的WUI区域结果,更合理地与其他划分结果进行对比,本研究不进一步区分交界区域和混合区域,统称为WUI。
同样使用空间分辨率为 30 m的栅格地图和半径为500 m的移动窗格进行野生植被覆盖度的计算,移动窗口内野生植被栅格的比例作为每个中心栅格的野生植被覆盖度。
3.2 燃料等级优先划分方法
燃料等级优先WUI划分方法主要参照Johnston等提出的方法,基于建筑周围易燃的野生植被定义WUI区域[13]。首先,通过2个步骤生成燃料等级栅格图层。第一步根据燃料的相对最大潜在“危险”(即抑制难度)将燃料(即土地覆盖类型)进行排名。本文主要参考了Johnston L M等基于加拿大火灾行为预测(FBP)系统(加拿大林业火灾危险小组,1992年)的潜在火灾行为和扑灭难度,对加拿大Land Cover 2000数据集中各个土地覆盖类型的燃料等级进行的分类[13]。在此基础上,进一步对GLC_FCS30—2020中各个土地覆盖类型的进行了划分,如表2所示,燃料等级越高(其数值越小)表示燃烧成本越低,易燃程度越高。
表2 不同土地覆盖类型 (GLC-FCS30—2020)的燃料等级相对排名
Tab.2
| 栅格值 | 种类 | 燃料等级 |
|---|---|---|
| 71 | 开阔常绿针叶林(0.15<fc①<0.4) | 1 |
| 72 | 闭阔常绿针叶林(fc>0.4) | 1 |
| 81 | 开阔落叶针叶林(0.15<fc<0.4) | 1 |
| 82 | 闭阔落叶针叶林(fc>0.4) | 1 |
| 51 | 开阔常绿阔叶林 | 2 |
| 52 | 闭阔常绿阔叶林 | 2 |
| 61 | 开阔落叶阔叶林(0.15<fc<0.4) | 2 |
| 62 | 闭阔落叶阔叶林(fc>0.4) | 2 |
| 91 | 开阔混交叶片林(阔叶树和针叶树) | 2 |
| 92 | 闭阔混交叶片林(阔叶树和针叶树) | 2 |
| 120 | 灌木地 | 3 |
| 121 | 常绿灌木地 | 3 |
| 122 | 落叶灌木地 | 3 |
| 130 | 草地 | 3 |
| 152 | 稀疏灌木地(fc<0.15) | 3 |
| 180 | 沼泽 | 4 |
| 150 | 稀疏植被(fc<0.15) | 4 |
| 153 | 稀疏草本植被(fc<0.15) | 5 |
| 11 | 草本植被覆盖 | 5 |
| 10 | 耕地 | / |
| 12 | 树木或灌木覆盖(果园) | / |
| 20 | 灌溉耕地 | / |
| 140 | 地衣和苔藓植被 | / |
| 190 | 不透水表面 | / |
| 200 | 裸地 | / |
| 201 | 固化裸地 | / |
| 202 | 非固化裸地 | / |
| 210 | 水体 | / |
| 220 | 永久性冰雪覆盖 | / |
| 250 | 填充值 | / |
①fc为覆盖分量(fractional cover)
第二步是对所有燃料的燃料连通性进行评估。本文使用了聚合指数(aggregation index,AI),该指数已在以前的 WUI 映射研究中采用[23]。该指数提供了分散在区域内的燃料连通性或聚集程度的衡量标准,它还为火灾在建筑外围植被中蔓延的难易程度提供了参考。在5×5大小的移动窗口中计算了所有燃料栅格的聚合指数,其公式为:
式中gii为相应燃料等级i的聚合程度,即在 5×5 窗格内所有燃料等级为i的像元与同类像元的邻接对数之和。
原始AI值的范围从0(无聚合,即每个单元都是隔离的)到100(完全聚合,即燃料是连续的)。之后对AI值进行简化分类: AI>90 被归类为“高聚合”,并赋值为0; 0
燃料等级优先划分WUI区域是通过在建筑周围建立可变宽度缓冲区来实现的,为了筛选建筑周围的燃料栅格,缓冲区的宽度基于建筑周围栅格的大小为1~7(非燃料为 10)的加权燃料等级值。加权燃料等级值代表了栅格燃烧的距离成本,加权燃料等级值越小则表示燃烧的距离成本越小,发生火灾后影响的范围就越大。可变宽度缓冲区最大宽度为2 400 m,然后根据距离成本成倍缩小缓冲区大小。
3.3 建筑植被缓冲区重合划分方法
建筑植被缓冲区重合WUI划分方法主要参考Modugno等提出的方法[15],分别基于建筑足迹数据和植被燃料区域建立缓冲区。首先,划分出野生植被斑块,选取的野生植被土地覆盖类型与2.2提到的相同; 然后,围绕建筑区域建立200 m的缓冲区,在野生植被斑块周围创建 400 m的缓冲区; 最后,将2个缓冲区叠加,重叠区域划分为WUI区域。
4 3种WUI划分方法的结果分析
4.1 划分区域对比
建筑密度优先方法、燃料等级优先方法、建筑植被缓冲区重合方法的WUI区域划分结果如图3所示。3种方法得到的WUI总面积分别为298.235 km2,1 682.162 km2和261.223 km2。
图3
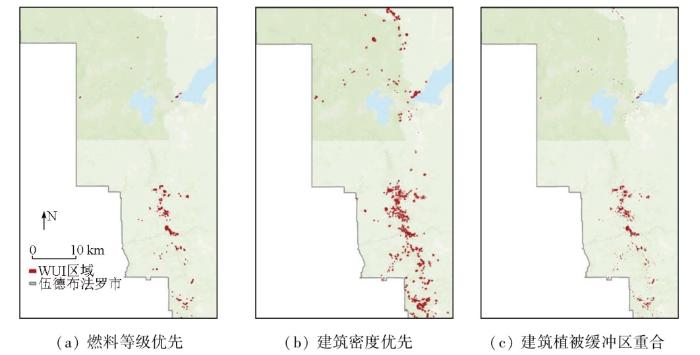
建筑密度优先方法设定建筑密度大于6.17间房屋/km2作为划分WUI的阈值。然而,在伍德布法罗市北部,该区域建筑分布相对稀疏,难以满足上述密度要求。因此,在应用此方法时,大量位于低密度区的房屋及其周边植被被排除在WUI区域之外。燃料等级优先方法侧重于评估植被的易燃性及其对野火传播的潜在影响。在此方法下,所有位于建筑周边、具有较高燃料等级的易燃植被均被视为WUI区域的一部分。在伍德布法罗市北部的居民区,即便建筑密度不高,但房屋被密集的植被包围,这个区域同样被算作WUI区域。由于该方法在划分过程中考虑到了房屋周围2.4 km缓冲区内的所有植被,其最终结果面积远超其他2种方法。特别是在北部居民区,差异尤为明显。建筑植被缓冲区重合方法试图通过设置一个缓冲区来平衡建筑密度与植被易燃性之间的关系。然而,在划分过程中,由于预设的缓冲区距离偏小,未能充分考虑当地的具体条件,导致最终划定的WUI面积偏小,仅为261.223 km2。
为了更清晰地比较每种方法划分结果的差异,本文选取伍德布法罗市中部河流附近建筑较密集的小区域(面积约960 km2),将3种结果与实际建筑的建筑风险指数和植被的空间位置进行对比,如图4所示。建筑密度优先WUI主要是围绕建筑进行划分,多数植被被忽略,燃料等级优先WUI主要是对建筑周围的植被进行划分,由于建筑密集的居民区土地覆盖类型多数属于裸地或者不透水面,很多居民区本身被忽略; 建筑植被缓冲区重合WUI分布与建筑密度优先空间分布比较相似,但由于没有对建筑和植被进行筛选,WUI区域的范围要大于建筑密度优先。
图4
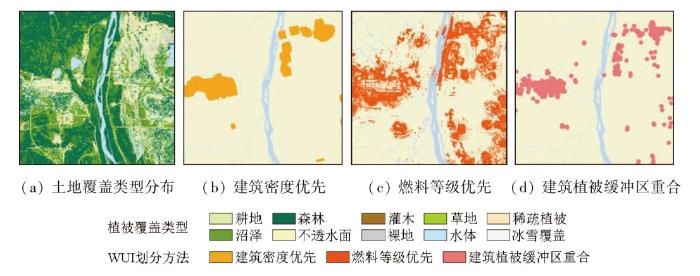
图4
不同划分方法结果细节对比图
Fig.4
Comparison chart of detailed results of different division methods
3种方法均将河流左侧中部的建筑群划分进了WUI区域,该建筑群下方的较稀疏建筑被耕地覆盖,不属于有效燃料栅格,建筑密度优先和建筑植被缓冲区重合方法均将这处建筑区划入了WUI区域,没有进行有效的筛选。另外,建筑密度优先方法同样忽略了河流右侧的区域很多处于野生植被的稀疏建筑。
总体而言,3种基础的WUI划分方法在处理建筑和植被时,均未能实现有效的同时筛选,这导致了划分结果存在一定的偏差。为了确保WUI区域的划分更加精确,未来需要设定更有效的阈值,以更准确地界定WUI区域。
4.2 建筑数量统计
由于燃料等级优先划分方法结果中忽略了很多居住区,为了保证对比结果相对客观,对每个WUI区域分别建立了10 m,50 m,100 m缓冲区,以统计WUI区域内的建筑数量。同时,本研究还分别统计了WUI区域内位于火迹地2 400 m缓冲区内的建筑数量和总建筑数量,用以分析WUI区域内的房屋受野火的影响大小,结果见表3。结果表明,在伍德布法罗市, WUI区域内的建筑受到野火影响较大,处在火迹地中的建筑数量远高于非缓冲区内的建筑,处在建筑密度优先WUI的建筑数量最多。
表3 伍德布法罗市不同城市森林交界域的建筑数量
Tab.3
| 划分方法 | 建筑位置 | 对WUI建立的缓冲区距离/m | |||
|---|---|---|---|---|---|
| 0 | 10 | 50 | 100 | ||
| 建筑密度优先 | 火迹地缓冲区内 | 18 908 | 18 925 | 18 954 | 18 975 |
| 非缓冲区内 | 2 304 | 2 367 | 2 414 | 2 445 | |
| 燃料等级优先 | 火迹地缓冲区内 | 1 528 | 2 260 | 8 377 | 14 579 |
| 非缓冲区内 | 774 | 1 459 | 2 537 | 2 744 | |
| 建筑植被缓冲区重合 | 火迹地缓冲区内 | 16 607 | 17 010 | 17 422 | 17 716 |
| 非缓冲区内 | 1 989 | 2 665 | 2 865 | 3 050 | |
4.3 火点数量及火迹地面积统计
对WUI内的火点和火迹地进行统计,结果如表4所示。因为同时考虑了建筑区域和植被区域2个部分,燃料等级优先的WUI区域总面积偏大。而建筑密度优先和建筑植被缓冲区重合的WUI区域总面积偏小,这可能与划分方法的缓冲距离和筛选阈值有关,这2个方法都忽略了很多建筑周围的植被区域。
表4 伍德布法罗市不同WUI内的面积、野火火点数量、燃烧面积
Tab.4
| 划分方法 | WUI总面 积/km2 | 火点数 量/个 | WUI内的 火迹地面 积/km2 | 占总火迹 地面积比 例/% | 占WUI面 积比例/% |
|---|---|---|---|---|---|
| 建筑密度优先 | 298.23 | 655 | 59.85 | 0.17 | 20.071 |
| 燃料等级优先 | 1 682.16 | 427 | 277.23 | 0.82 | 16.481 |
| 建筑植被缓冲 区重合 | 261.22 | 629 | 36.94 | 0.11 | 14.143 |
2011—2020年,伍德布法罗市的总火迹地面积为33 669.53 km2。野火的过火区域和WUI区域重叠的比例较低[24]。总体上看,WUI中的火迹地面积占总火迹地的面积比例较小,伍德布法罗市大多数野火仍主要发生在远离城镇的区域。比较不同方法划分的WUI中的火点数量和火迹地面积大小可以看出,建筑密度优先方法得到的总面积虽然偏小,但相比其他2种方法得到的火迹地面积占WUI面积比例较高,火点数较多,在识别与人类活动密集区域相关的野火风险方面具有较高的参考价值。燃料等级优先方法划分总面积最大,虽然覆盖了更多火迹地,但由于包含了过多的植被区域,且没有对其进行筛选,其火点和火迹地密集度较低,可能会将部分风险较低的区域不必要地划入 WUI。建筑植被缓冲区的火迹地面积和占比最低,利用此方法划分WUI可能会低估火灾对 WUI 的潜在破坏。
5 结论
本文以加拿大艾伯塔省伍德布法罗市为试验区,利用微软加拿大建筑足迹数据、GLC_FCS30—2020土地覆盖数据和当地历史火点和火迹地数据,分析比对了现有WUI区域划分方法结果的一致性,以及和当地历史火点和火迹地数据的一致性。论文主要结论如下:
1)现有WUI划分方法可分为建筑密度优先、燃料等级优先、建筑植被缓冲区重合3种。实验结果表明,建筑密度优先方法以建筑密度、植被覆盖度等指标为重要参量,但由于建筑密度阈值固定,容易忽略处于野生植被中有火灾风险的低密度建筑; 燃料等级优先方法虽然对植被进行了有效的筛选,但最后划分的步骤中去掉了不可燃区域,导致大部分建成区不被包含在WUI区域内; 建筑植被缓冲区重合方法对建筑和植被构建缓冲区,缓冲距离较小,导致划分后的WUI面积较小,且没有对两者进行有效的筛选。
2)和当地历史火点和火迹地数据的一致性对比结果表明,建筑密度优先WUI虽然忽略了建筑周围的危险植被区域,但包含的建筑数量、火点数和野火火迹地面积比例较大,较为准确; 燃料等级优先WUI利用较为科学的方法划分出了建筑周围的植被区域,但由于没有对植被进行合理筛选且忽略了构成WUI区域中的建筑部分,导致总体面积较大但区域内的火迹地面积占比较低; 由于设置的缓冲区距离较小,建筑植被缓冲区重合WUI区域面积整体偏小,与历史火迹地重合面积及比例最小。
本研究揭示了现有方法的优势和局限性,有助于未来更科学合理地划分森林城镇交界域区域,为火灾风险应对和应急管理决策提供决策参考。
参考文献
Reduced global fire activity due to human demography slows global warming by enhanced land carbon uptake
[J].
Likely future (s) of global wildfires
[R].
2022.Spreading like Wildfire:The rising threat of extraordinary landscape fires
[R].https://www.unep.org/news-and-stories/press-release/number-wildfires-rise-50-2100-and-governments-are-not-prepared.
The wildland-urban interface in the United States
[J].
DOI:10.1890/04-1413
URL
[本文引用: 1]

The wildland–urban interface (WUI) is the area where houses meet or intermingle with undeveloped wildland vegetation. The WUI is thus a focal area for human– environment conflicts, such as the destruction of homes by wildfires, habitat fragmentation, introduction of exotic species, and biodiversity decline. Our goal was to conduct a spatially detailed assessment of the WUI across the United States to provide a framework for scientific inquiries into housing growth effects on the environment and to inform both national policymakers and local land managers about the WUI and associated issues. The WUI in the conterminous United States covers 719 156 km2(9% of land area) and contains 44.8 million housing units (39% of all houses). WUI areas are particularly widespread in the eastern United States, reaching a maximum of 72% of land area in Connecticut. California has the highest number of WUI housing units (5.1 million). The extent of the WUI highlights the need for ecological principles in land‐use planning as well as sprawl‐limiting policies to adequately address both wildfire threats and conservation problems.
The wildland-urban interface:Paradise or battleground?
[J].
The wildland-urban interface:Evaluating the definition effect
[J].
DOI:10.1093/jof/108.1.9
URL
[本文引用: 1]
The wildland–urban interface (WUI) is the area where human-built structures and infrastructure abut or mix with naturally occurring vegetation types. Wildfires are of particular concern in the WUI because these areas comprise extensive flammable vegetation, numerous structures, and ample ignition sources. A priority of federal wildland fire policy in the United States is to help protect communities threatened by wildfire, creating a demand for maps of the WUI. In this study, five models of the WUI are compared for four counties in the United States. The models are all based on the widely cited characteristics of the WUI published in the Federal Register, although they differ slightly in their focus (vegetation or housing) and implementation (the details of the WUI definition). For models that differ in focus, I describe how the purpose of the map led to different results. For conceptually similar models, I assess how different effects—the “dasymetric effect,” the “settlement representation effect,” and the “merging buffer effect”—influence the extent of the WUI in different counties. The differences between the WUI maps can be more or less pronounced depending on the spatial distribution of housing, vegetation, and public land. No single mapping approach is unequivocally superior, and each has tradeoffs that need to be fully understood for use in management.
Forty years of wildland urban interface growth and its relation with wildfires in central-western Chubut,Argentina
[J].
Remapping California’s wildland urban interface:A property-level time-space framework,2000-2020
[J].
Aerial imagery-based building footprint detection with an integrated deep learning framework:Applications for fine scale wildland-urban interface mapping
[J].
DOI:10.3390/rs14153622
URL
[本文引用: 1]
Human encroachment into wildlands has resulted in a rapid increase in wildland–urban interface (WUI) expansion, exposing more buildings and population to wildfire risks. More frequent mapping of structures and WUIs at a finer spatial resolution is needed for WUI characterization and hazard assessment. However, most approaches rely on high-resolution commercial satellite data with a particular focus on urban areas. We developed a deep learning framework tailored for building footprint detection in the transitional wildland–urban areas. We leveraged meter scale aerial imageries publicly available from the National Agriculture Imagery Program (NAIP) every 2 years. Our approach integrated Mobile-UNet and generative adversarial network. The deep learning models trained over three counties in California performed well in detecting building footprints across diverse landscapes, with an F1 score of 0.62, 0.67, and 0.75 in the interface WUI, intermix WUI, and rural regions, respectively. The bi-annual mapping captured both housing expansion and wildfire-caused building damages. The 30 m WUI maps generated from these finer footprints showed more granularity than the existing census tract-based maps and captured the transition of WUI dynamics well. More frequent updates of building footprint and improved WUI mapping will improve our understanding of WUI dynamics and provide guidance for adaptive strategies on community planning and wildfire hazard reduction.
The wildland-urban interface in the United States based on 125 million building locations
[J].
DOI:10.1002/eap.2597
PMID:35340097
[本文引用: 3]
The wildland-urban interface (WUI) is the focus of many important land management issues, such as wildfire, habitat fragmentation, invasive species, and human-wildlife conflicts. Wildfire is an especially critical issue, because housing growth in the WUI increases wildfire ignitions and the number of homes at risk. Identifying the WUI is important for assessing and mitigating impacts of development on wildlands and for protecting homes from natural hazards, but data on housing development for large areas are often coarse. We created new WUI maps for the conterminous U.S. based on 125 million individual building locations, offering higher spatial precision compared to existing maps based on U.S. census housing data. Building point locations were based on a building footprint dataset from Microsoft®. We classified WUI across the conterminous U.S. at 30-m resolution using a circular neighborhood mapping algorithm with a variable radius to determine thresholds of housing density and vegetation cover. We used our maps to (1) determine the total area of the WUI and number of buildings included, (2) assess the sensitivity of WUI area included and spatial pattern of WUI maps to choice of neighborhood size, (3) assess regional differences between building-based WUI maps and census-based WUI maps, and (4) determine how building location accuracy affected WUI map accuracy. Our building-based WUI maps identified 5.6% - 18.8% of the conterminous U.S. as being in the WUI, with larger neighborhoods increasing WUI area but excluding isolated building clusters. Building-based maps identified more WUI area relative to census-based maps for all but the smallest neighborhoods, particularly in the north-central states, and large differences were attributable to high numbers of non-housing structures in rural areas. Overall WUI classification accuracy was 98.0%. For wildfire risk mapping and for general purposes, WUI maps based on the 500-m neighborhood represent the original Federal Register definition of the WUI; these maps include clusters of buildings in and adjacent to wildlands and exclude remote, isolated buildings. Our approach for mapping the WUI offers flexibility and high spatial detail, and can be widely applied to take advantage of the growing availability of high-resolution building footprint datasets and classification methods.This article is protected by copyright. All rights reserved.
The global wildland-urban interface
[J].
DOI:10.1038/s41586-023-06320-0
[本文引用: 1]
The wildland–urban interface (WUI) is where buildings and wildland vegetation meet or intermingle1,2. It is where human–environmental conflicts and risks can be concentrated, including the loss of houses and lives to wildfire, habitat loss and fragmentation and the spread of zoonotic diseases3. However, a global analysis of the WUI has been lacking. Here, we present a global map of the 2020 WUI at 10 m resolution using a globally consistent and validated approach based on remote sensing-derived datasets of building area4 and wildland vegetation5. We show that the WUI is a global phenomenon, identify many previously undocumented WUI hotspots and highlight the wide range of population density, land cover types and biomass levels in different parts of the global WUI. The WUI covers only 4.7% of the land surface but is home to nearly half its population (3.5 billion). The WUI is especially widespread in Europe (15% of the land area) and the temperate broadleaf and mixed forests biome (18%). Of all people living near 2003–2020 wildfires (0.4 billion), two thirds have their home in the WUI, most of them in Africa (150 million). Given that wildfire activity is predicted to increase because of climate change in many regions6, there is a need to understand housing growth and vegetation patterns as drivers of WUI change.
Wildfire risk for global wildland-urban interface areas
[J].DOI:10.1038/s41893-024-01291-0 [本文引用: 1]
Mapping Canadian wildland fire interface areas
[J].
DOI:10.1071/WF16221
URL
[本文引用: 3]
Destruction of human-built structures occurs in the ‘wildland–urban interface’ (WUI) – where homes or other burnable community structures meet with or are interspersed within wildland fuels. To mitigate WUI fires, basic information such as the location of interface areas is required, but such information is not available in Canada. Therefore, in this study, we produced the first national map of WUI in Canada. We also extended the WUI concept to address potentially vulnerable industrial structures and infrastructure that are not traditionally part of the WUI, resulting in two additional maps: a ‘wildland–industrial interface’ map (i.e. the interface of wildland fuels and industrial structures, denoted here as WUI-Ind) and a ‘wildland–infrastructure interface’ map (i.e. the interface of wildland fuels and infrastructure such as roads and railways, WUI-Inf). All three interface types (WUI, WUI-Ind, WUI-Inf) were defined as areas of wildland fuels within a variable-width buffer (maximum distance: 2400 m) from potentially vulnerable structures or infrastructure. Canada has 32.3 million ha of WUI (3.8% of total national land area), 10.5 million ha of WUI-Ind (1.2%) and 109.8 million ha of WUI-Inf (13.0%). The maps produced here provide a baseline for future research and have a wide variety of practical applications.
The wildland-urban interface in Europe:Spatial patterns and associations with socioeconomic and demographic variables
[J].
Mapping regional patterns of large forest fires in wildland-urban interface areas in Europe
[J/OL].
Canadian wildland fire information system
[R].http://bit.ly/WUI-088,2019.
Wildfire evacuations in Canada 1980-2007
[J].DOI:10.1007/s11069-011-9777-9 URL [本文引用: 1]
Collection 6 MODIS burned area product user’s guide version 1.0
[J].
Using structure locations as a basis for mapping the wildland urban interface
[J].
Mapping the wildland-urban interface in California using remote sensing data
[J].
DOI:10.1038/s41598-022-09707-7
PMID:35388077
[本文引用: 1]
Due to the mixed distribution of buildings and vegetation, wildland-urban interface (WUI) areas are characterized by complex fuel distributions and geographical environments. The behavior of wildfires occurring in the WUI often leads to severe hazards and significant damage to man-made structures. Therefore, WUI areas warrant more attention during the wildfire season. Due to the ever-changing dynamic nature of California's population and housing, the update frequency and resolution of WUI maps that are currently used can no longer meet the needs and challenges of wildfire management and resource allocation for suppression and mitigation efforts. Recent developments in remote sensing technology and data analysis algorithms pose new opportunities for improving WUI mapping methods. WUI areas in California were directly mapped using building footprints extracted from remote sensing data by Microsoft along with the fuel vegetation cover from the LANDFIRE dataset in this study. To accommodate the new type of datasets, we developed a threshold criteria for mapping WUI based on statistical analysis, as opposed to using more ad-hoc criteria as used in previous mapping approaches. This method removes the reliance on census data in WUI mapping, and does not require the calculation of housing density. Moreover, this approach designates the adjacent areas of each building with large and dense parcels of vegetation as WUI, which can not only refine the scope and resolution of the WUI areas to individual buildings, but also avoids zoning issues and uncertainties in housing density calculation. Besides, the new method has the capability of updating the WUI map in real-time according to the operational needs. Therefore, this method is suitable for local governments to map local WUI areas, as well as formulating detailed wildfire emergency plans, evacuation routes, and management measures.© 2022. The Author(s).
Urban wildland interface communities within the vicinity of federal lands that are at high risk from wildfire
[J].
Forest fires in the wildland-urban interface:A spatial analysis of forest fragmentation and human impacts
[J].
Application of a geographical assessment method for the characterization of wildland-urban interfaces in the context of wildfire prevention:A case study in western Madrid
[J].DOI:10.1016/j.apgeog.2012.05.005 URL [本文引用: 1]
Examining the existing definitions of wildland-urban interface for California
[J].DOI:10.1002/ecs2.v13.12 URL [本文引用: 1]
