

0 引言
近年来,土地覆盖分类及其体系已成为研究热点。Yang等[6]从国家、区域、全球尺度入手,对土地覆盖分类体系的协调统一进行了系统性论述; 张景华等[7]详细展示了1970年以来的重要土地利用/土地覆盖(land use and land cover,LULC)分类体系; He等[8]对1990—2018年LULC的研究进行了整理分析; Pérez-Hoyos等[9]比较了部分全球土地覆盖数据集在农田监测上的应用情形; 岳健等[10]对我国土地利用分类的优劣进行了论证; 王人潮[11]对国内外土地分类进行了阐述; Deb等[12]讨论了LULC的分类技术; Wang等[13]提出了建立LULC体系的准则; 吕玉霞等[14]从土地利用碳排放估算的角度,建立了我国现有14项土地利用分类与联合国政府间气候变化专门委员会(Intergovernmental Pannel on Climate Change,IPCC)关于农林以及其他土地利用分类的对照映射关系; Fisher等[2]深入分析了土地利用和土地覆盖的关联性。
现有的研究从多角度总结分析了土地覆盖分类体系的进展,但缺乏从分类体系和数据产品入手对全球土地覆盖分类体系进行针对性的总结和系统性的对比分析研究。本文回顾并对比分析了20世纪70年代首先被应用于土地覆盖分类产品的美国国家地质调查局(United States Geological Survey,USGS)Anderson分类体系、80年代出现的环境信息协作计划(Coordination of Information on the Environment,CORINE)土地覆盖项目CLC分类体系、90年代出现的且目前应用非常广泛的国际地圈-生物圈计划(International Geosphere-Biosphere Programme,IGBP)全球土地覆盖分类体系和联合国粮农组织(Food and Agriculture Organization,FAO)于1997年建立的一个标准的土地覆盖分类体系(land cover classification system,LCCS),以及2010年后先后出现的30 m空间分辨率全球土地覆盖数据产品(global land cover mapping at 30 m resolution,GlobeLand30)、年度全球土地覆盖产品(annual global land cover,AGLC)、全球土地覆盖精细分辨率观测与监测数据(finer resolution observation and monitoring of global land cover,FROM-GLC)、Esri Sentinel-2 10 m土地覆盖时间序列(Esri Sentinel-2 10 m land cover time series, Esri 10 m Land Cover)和Dynamic World等分类体系,梳理总结了29项重要的相关土地覆盖数据产品,对比分析了不同体系之间的区别和联系,展示了它们之间语义一致性方面的差异,最后总结指出全球土地覆盖分类的一致性和多样性特点。
1 土地覆盖分类体系标准的进展
1.1 USGS Anderson 土地覆盖分类体系及相关分类体系、数据产品
表1 USGS Anderson土地覆盖分类体系
Tab.1
| 一级类 | 二级类(编码+类型名) | |
|---|---|---|
| 编码 | 类型名 | |
| 1 | 城镇或建成区(urban or built-up land) | 11住宅用地,12商服用地,13工业用地,14交通、通信和公共设施用地,15工商综合体,16城镇或建成区混合体,17其他城镇或建成区 |
| 2 | 农业用地(agricultural land) | 21耕地和牧场,22果园、园林、葡萄园、苗圃和园艺用地,23圈养场,24其他农用地 |
| 3 | 草地(rangeland) | 31草本草地,32灌木和灌丛草地,33混合草地 |
| 4 | 林地(forest land) | 41落叶林地,42常绿林地,43混合林地 |
| 5 | 水体(water) | 51河流和沟渠,52湖泊,53水库,54海湾和河口 |
| 6 | 湿地(wetlands) | 61有林地覆盖的湿地,62无林地覆盖的湿地 |
| 7 | 荒地(barren land) | 71干旱盐碱地,72海滩,73沙地(不包括海滩),74裸岩,75露天矿、采石场和采砂场,76过渡带,77混合荒地 |
| 8 | 苔原(tundra) | 81灌木与灌丛苔原,82草本苔原,83裸地苔原,84湿苔原,85混合苔原 |
| 9 | 冰川或永久积雪(perennial snow or ice) | 91永久积雪,92冰川 |
表2 NLCD 2019美国国家土地覆盖分类体系
Tab.2
| 一级类(编码+类型名) | 二级类(编码+类型名) |
|---|---|
| 1水体(water) | 11开阔水域,12永久冰川/积雪 |
| 2开发用地(developed) | 21已开发的、开放空间,22发达的、低强度的,23发达的、中等强度的,24发达的、高强度的 |
| 3贫瘠土地(barren) | 31贫瘠土地(裸岩/沙地/裸土) |
| 4森林(forest) | 41落叶林,42常绿森林,43混交林 |
| 5灌丛地(shrubland) | 51矮生灌丛,52灌木/灌木丛 |
| 7草本植被(herbaceous) | 71草地/草本植物,72灌木/草本植物,73地衣,74苔藓 |
| 8种植/栽培地(planted/cultivated) | 81牧场/干草,82栽培作物 |
| 9湿地(wetlands) | 90有林湿地,95草洲 |
表3 GeoCover LC全球土地覆盖分类体系
Tab.3
| 编码 | 类型名 |
|---|---|
| 1 | 落叶林(forest, deciduous) |
| 2 | 常绿森林(forest, evergreen) |
| 3 | 灌木/灌木丛(shrub/scrub) |
| 4 | 草原(>10%地面覆盖)(grassland (>10% ground cover)) |
| 5 | 贫瘠/极少植被(<10%地面覆盖)(barren/minimal vegetation (<10% ground cover)) |
| 6 | 人造的其他城市建成地(man made-other, urban/built up) |
| 7 | 一般农业(agriculture, general) |
| 8 | 稻米/稻谷农业(agriculture rice/paddy) |
| 9 | 永久/草本湿地(wetland, permanent/herbaceous) |
| 10 | 红树林湿地(wetland, mangrove) |
| 11 | 水体(water) |
| 12 | 永久或几乎永久的冰和/或雪(permanent or nearly permanent ice and/or snow) |
| 13 | 云/云影/无数据(cloud/cloud shadow/no data) |
1.2 CORINE土地覆盖项目CLC的分类体系及产品
表4 CORINE CLC土地覆盖分类体系
Tab.4
| 一级类 | 二级类 | 三级类 |
|---|---|---|
| 1人工表面(artificial surfaces) | 1.1城镇建筑物 | 1.1.1连续的城市结构,1.1.2不连续的城市结构 |
| 1.2工业、商业和交通运输用地 | 1.2.1工业或商业单位,1.2.2公路和铁路网络及相关土地,1.2.3港口区,1.2.4机场 | |
| 1.3矿山、垃圾场和建筑工地 | 1.3.1矿物提取点,1.3.2垃圾场,1.3.3建筑工地 | |
| 1.4人工非农业用地 | 1.4.1绿色城市地区,1.4.2运动和休闲设施 | |
| 2农业用地(agricultural areas) | 2.1耕地 | 2.1.1非灌溉耕地,2.1.2永久灌溉土地,2.1.3稻田 |
| 2.2多年生作物 | 2.2.1葡萄园,2.2.2果树和浆果种植园,2.2.3橄榄园 | |
| 2.3牧场 | 2.3.1牧草 | |
| 2.4其他农业 用地 | 2.4.1与长期作物相关的一年生作物,2.4.2.复合栽培,2.4.3土地主要用于农业、自然植被面积很大,2.4.4农林区 | |
| 3林地和半自然用地(forests and semi-natural areas) | 3.1林地 | 3.1.1阔叶林,3.1.2针叶林,3.1.3混交林 |
| 3.2灌木或草本植物 | 3.2.1自然草场,3.2.2沼泽和荒地,3.2.3硬叶植物,3.2.4过渡性林地灌木 | |
| 3.3少植被或无植被覆盖的空地 | 3.3.1海滩、沙丘和沙地或没有植被,3.3.2裸岩,3.3.3植被稀疏的地区,3.3.4烧毁区域,3.3.5冰川和永久的雪 | |
| 4湿地(wetlands) | 4.1内陆湿地 | 4.1.1内陆沼泽,4.1.2泥炭沼泽 |
| 4.2沿海湿地 | 4.2.1盐沼,4.2.2盐碱地,4.2.3潮间带 | |
| 5水体(water bodies) | 5.1内陆水体 | 5.1.1水道,5.1.2水体 |
| 5.2海水 | 5.2.1沿海潟湖,5.2.2河口,5.2.3海和洋 |
1.3 IGBP全球土地覆盖分类体系及相关分类体系、数据产品
由USGS、内布拉斯加大学林肯分校和欧盟委员会联合研究中心为IGBP研制的全球土地覆盖特征(global land cover characterization,GLCC)数据库,采用了IGBP的DISCover土地覆盖分类方案。该方案共确定了17 个类别(表5),包括11个自然植被类别、3个反映人类活动的类别和3个非植被类别。IGBP DISCover数据产品基于NOAA-AVHRR 遥感影像数据,利用全年12个月(1992 年4月—1993年3月)的影像合成数据,完成了全球土地覆盖分类,空间分辨率是1 km。IGBP DISCover和SiB Land Cover专题网格数据则每个都重采样为0.25°,0.5°和1.0°[22-23]。
表5 IGBP和UMD全球土地覆盖分类体系
Tab.5
| 编码 (IGBP) | 类型名 | |
|---|---|---|
| IGBP | UMD | |
| 0 | 水体(water bodies) | 水体(water bodies) |
| 1 | 常绿针叶林(evergreen needleleaf forests) | 常绿针叶林(evergreen needleleaf forests) |
| 2 | 常绿阔叶林(evergreen broadleaf forests) | 常绿阔叶林(evergreen broadleaf forests) |
| 3 | 落叶针叶林(deciduous needleleaf forests) | 落叶针叶林(deciduous needleleaf forests) |
| 4 | 落叶阔叶林(deciduous broadleaf forests) | 落叶阔叶林(deciduous broadleaf forests) |
| 5 | 混交林(mixed forests) | 混交林(mixed forests) |
| 6 | 郁闭灌木林(closed shrublands) | 郁闭丛林或灌木林(closed bushlands or shrubland) |
| 7 | 稀疏灌木林(open shrublands) | 稀疏灌木林(open shrublands) |
| 8 | 有林草原(woody savannas) | 林地(woodlands) |
| 9 | 稀树草原(savannas) | 有林草原/灌木林(wooded grasslands/shrublands) |
| 10 | 草原(grasslands) | 草原(grasslands) |
| 11 | 永久湿地(permanent wetlands) | — |
| 12 | 农田(croplands) | 农田(croplands) |
| 13 | 城镇与建成区(urban and built-up) | 城镇与建成区(urban and built-up) |
| 14 | 农田/自然植被混合区(cropland natural vegetation mosaics) | — |
| 15 | 永久冰雪(snow and ice) | — |
| 16 | 裸地或稀疏植被(barren or sparsely vegetated) | 裸地(barren) |
IGBP分类体系广泛应用于以中分辨率成像光谱仪(moderate-resolution imaging spectroradiometer,MODIS)遥感数据为基础的土地覆盖产品。全球土地覆盖产品MODIS IGBP土地覆盖数据集(Collection 4),采用MODIS数据生成2000—2001年的全球土地覆盖分类数据产品,其分类体系为17类的IGBP分类体系,分辨率为0.25°,0.5°和1°。
MODIS最新的全球土地覆盖产品为MODIS土地覆盖(Collection 6)(MCD12Q1和MCD12C1)。其中MCD12Q1(500 m)以年度间隔(2001—2020年)提供全球土地覆盖类型,提供基于IGBP、UMD、叶面积指数(leaf area index,LAI)、生物群落-生物地球化学循环(BIOME-biogeochemical cycles,BGC)、植物功能类型(plant functional type, PFT)和LCCS等分类体系的土地覆盖分类产品。MCD12C1(0.05°)以年度间隔(2001—2020 年)提供基于IGBP,UMD和LAI分类体系的土地覆盖分类产品。基于IGBP,UMD,LAI,BGC和PFT的分类体系如表6所示,分别有18,17,12,10和13个类别。基于LCCS的分类体系见1.4.2节[27]。
表6 基于IGBP,UMD,LAI,BGC和PFT的MODIS土地覆盖分类体系
Tab.6
| IGBP | UMD | LAI | BGC | PFT | ||||||
|---|---|---|---|---|---|---|---|---|---|---|
| 编码 | 类型名 | 编码 | 类型名 | 编码 | 类型名 | 编码 | 类型名 | 编码 | 类型名 | |
| 0/17① | 水体(water bodies) | 0 | 水体(water bodies) | 0 | 水体(water bodies) | 0 | 水体(water bodies) | 0 | 水体(water bodies) | |
| 1 | 常绿针叶林(evergreen needleleaf forests) | 1 | 常绿针叶林(evergreen needleleaf forests) | 7 | 常绿针叶林(evergreen needleleaf forests) | 1 | 常绿针叶林(evergreen needleleaf forests) | 1 | 常绿针叶林(evergreen needleleaf forests) | |
| 2 | 常绿阔叶林(evergreen broadleaf forests) | 2 | 常绿阔叶林(evergreen broadleaf forests) | 5 | 常绿阔叶林(evergreen broadleaf forests) | 2 | 常绿阔叶林(evergreen broadleaf forests) | 2 | 常绿阔叶林(evergreen broadleaf forests) | |
| 3 | 落叶针叶林(deciduous needleleaf forests) | 3 | 落叶针叶林(deciduous needleleaf forests) | 8 | 落叶针叶林(deciduous needleleaf forests) | 3 | 落叶针叶林(deciduous needleleaf forests) | 3 | 落叶针叶林(deciduous needleleaf forests) | |
| 4 | 落叶阔叶林(deciduous broadleaf forests) | 4 | 落叶阔叶林(deciduous broadleaf forests) | 6 | 落叶阔叶林(deciduous broadleaf forests) | 4 | 落叶阔叶林(deciduous broadleaf forests) | 4 | 落叶阔叶林(deciduous broadleaf forests) | |
| 5 | 混交林(mixed forests) | 5 | 混交林(mixed forests) | — | — | — | — | — | — | |
| — | — | — | — | 2 | 灌木林(shrublands) | — | — | 5 | 灌木(shrub) | |
| 6 | 郁闭灌木林(closed shrublands) | 6 | 郁闭灌木林(closed shrublands) | — | — | — | — | — | — | |
| 7 | 稀疏灌木林(open shrublands) | 7 | 稀疏灌木林(open shrublands) | — | — | — | — | — | — | |
| 8 | 有林草原(woody savannas) | 8 | 有林草原(woody savannas) | — | — | — | — | — | — | |
| 9 | 稀树草原(savannas) | 9 | 稀树草原(savannas) | 4 | 稀树草原(savannas) | — | — | — | — | |
| 10 | 草原(grasslands) | 10 | 草原(grasslands) | 1 | 草原(grasslands) | — | — | 6 | 草(grass) | |
| — | — | — | — | — | — | 5 | 一年生阔叶植被(annual broadleaf vegetation) | — | — | |
| — | — | — | — | — | — | 6 | 一年生草本植被(annual grass vegetation) | — | — | |
| 11 | 永久湿地(permanent wetlands) | 11 | 永久湿地(permanent wetlands) | — | — | — | — | — | — | |
| 12 | 农田(croplands) | 12 | 农田(croplands) | — | — | — | — | — | — | |
| — | — | — | — | — | — | — | — | 7 | 谷物农田(cereal croplands) | |
| — | — | — | — | 3 | 阔叶农田(broadleaf croplands) | — | — | 8 | 阔叶农田(broadleaf croplands) | |
| 13 | 城镇与建成区(urban and built-up lands) | 13 | 城镇与建成区(urban and built-up lands) | 10 | 城镇与建成区(urban and built-up lands) | 8 | 城镇与建成区(urban and built-up lands) | 9 | 城镇与建成区(urban and built-up lands) | |
| 14 | 农田/自然植被混合区(cropland/natural vegetation mosaics) | 14 | 农田/自然植被混合区(cropland/natural vegetation mosaics) | — | — | — | — | — | — | |
| 15 | 永久冰雪(permanent snow and ice) | — | — | — | — | — | — | 10 | 永久冰雪(permanent snow and ice) | |
| 16 | 裸地(barren) | 15 | 无植被土地(non-vegetated lands) | 9 | 无植被土地(non-vegetated lands) | 7 | 无植被土地(non-vegetated lands) | 11 | 裸地(barren) | |
| 255 | 无类别的(unclassified) | 255 | 无类别的(unclassified) | 255 | 无类别的(unclassified) | 255 | 无类别的(unclassified) | 255 | 无类别的(unclassified) | |
①“水体”地类在MCD12Q1数据产品中代码为17,在MCD12C1数据产品中代码为0。
1.4 FAO LCCS分类体系和基于LCCS的土地覆盖数据产品、体系
1.4.1 LCCS土地覆盖分类体系
图1
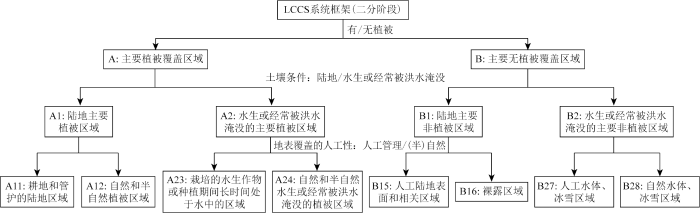
图1
LCCS的体系框架设计(二分阶段)
Fig.1
Design of the system framework of LCCS (dichotomous phase)
LCCS分类体系作为先验分类体系,最大的优势在于其灵活性和兼容性,可以根据实际需求更改分类器,满足特定需要的精细化分类,可适用于不同比例尺的土地覆盖图,分类器支持进一步转换为地球系统模型所需的PFT分布,因此应用范围非常广泛,比如全球森林覆盖和土地利用动态观测土地分类体系(GOFC-GOLD land and forest cover classification system)提出土地覆盖图须采用通用分类体系,使用公认的土地覆盖语言进行开发和翻译,并推荐了LCCS[30]。
1.4.2 基于LCCS的土地覆盖分类体系和数据产品
表7 基于LCCS分类体系的GLC2000 土地覆盖分类体系
Tab.7
| 编码 | 类型名 |
|---|---|
| 1 | 树木覆盖,阔叶的,常绿的(tree cover, broadleaved, evergreen) |
| 2 | 树木覆盖,阔叶的,落叶的,郁闭的(tree cover, broadleaved, deciduous, closed) |
| 3 | 树木覆盖,阔叶的,落叶的,稀疏的(tree cover, broadleaved, deciduous, open) |
| 4 | 树木覆盖,针叶的,常绿的(tree cover, needle-leaved, evergreen) |
| 5 | 树木覆盖,针叶的,落叶的(tree cover, needle-leaved, deciduous) |
| 6 | 树木覆盖,混合叶型(tree cover, mixed leaf type) |
| 7 | 树木覆盖,经常被淹没,淡水和半咸水(tree cover, regularly flooded, fresh and brackish water) |
| 8 | 树木覆盖,经常被淹没,咸水(ree cover, regularly flooded, saline water) |
| 9 | 混合的:树木覆盖/其他自然植被(mosaic: tree cover/other natural vegetation) |
| 10 | 树木覆盖,烧毁的(tree cover, burnt) |
| 11 | 灌木覆盖,郁闭-稀疏,常绿的(shrub cover, closed-open, evergreen) |
| 12 | 灌木覆盖,密闭-稀疏,落叶的(shrub cover, closed-open, deciduous) |
| 13 | 草本植物覆盖,密闭-稀疏(herbaceous cover, closed-open) |
| 14 | 稀疏草本植被或稀疏灌木覆盖(sparse herbaceous or sparse shrub cover) |
| 15 | 经常淹没的灌木和/或草本植物覆盖(regularly flooded shrub and/or herbaceous cover) |
| 16 | 耕地和管护地(cultivated and managed areas) |
| 17 | 混合的:耕地/树木覆盖/其他自然植被(mosaic: cropland/tree cover/other natural vegetation) |
| 18 | 混合的:耕地/灌木或草地覆盖(mosaic: cropland/shrub or grass cover) |
| 19 | 裸地(bare areas) |
| 20 | 水体(water bodies) |
| 21 | 冰雪(snow and ice) |
| 22 | 人造表面和相关区域(artificial surfaces and associated areas) |
表8 基于LCCS分类体系的GLCNMO土地覆盖分类体系
Tab.8
| 编码 | 类别名称 |
|---|---|
| 1 | 阔叶常绿林(broadleaf evergreen forest) |
| 2 | 阔叶落叶林(broadleaf deciduous forest) |
| 3 | 针叶常绿林(needleleaf evergreen forest) |
| 4 | 针叶落叶林(needleleaf deciduous forest) |
| 5 | 混交林(mixed forest) |
| 6 | 疏林(tree open) |
| 7 | 灌木(shrub) |
| 8 | 草本(herbaceous) |
| 9 | 疏树/灌木草本(herbaceous with sparse tree/shrub) |
| 10 | 稀疏植被(sparse vegetation) |
| 11 | 农田(cropland) |
| 12 | 稻田(paddy field) |
| 13 | 农田/其他植被混合(cropland /other vegetation mosaic) |
| 14 | 红树林(mangrove) |
| 15 | 湿地(wetland) |
| 16 | 裸露区域,固结(砾石,岩石)(bare area, consolidated (gravel, rock)) |
| 17 | 裸露区域,未固结(沙)(bare area, unconsolidated (sand)) |
| 18 | 城市(urban) |
| 19 | 冰雪(snow/ice) |
| 20 | 水体(water bodies) |
表9 基于LCCS的MODIS土地覆盖分类体系
Tab.9
| 类别名 | 编码 (LCCS1) | 编码 (LCCS2) | 编码 (LCCS3) |
|---|---|---|---|
| 裸地(barren) | 1 | 1 | 1 |
| 永久冰雪(permanent snow and ice) | 2 | 2 | 2 |
| 水体(water bodies) | 3 | 3 | 3 |
| 城镇用地和建成区用地(urban and built-up lands) | — | 9 | — |
| 茂密的森林(dense forests) | — | 10 | 10 |
| 常绿针叶林(evergreen needleleaf forests) | 11 | — | — |
| 常绿阔叶林(evergreen broadleaf forests) | 12 | — | — |
| 落叶针叶林(deciduous needleleaf forests) | 13 | — | — |
| 落叶阔叶林(deciduous broadleaf forests) | 14 | — | — |
| 阔叶/针叶混交林(mixed broadleaf/needleleaf forests) | 15 | — | — |
| 常绿/落叶阔叶混交林(mixed broadleaf evergreen/deciduous forests) | 16 | — | — |
| 开阔的森林(open forests) | — | 20 | 20 |
| 开阔的森林(open forests) | 21 | — | — |
| 稀疏的森林(sparse forests) | 22 | — | — |
| 森林/农田混合区(forest/cropland mosaics) | — | 25 | — |
| 有林湿地(woody wetlands) | — | — | 27 |
| 天然草本(grasslands) | — | 30 | 30 |
| 茂密的草本(dense herbaceous) | 31 | — | — |
| 稀疏草本(sparse herbaceous) | 32 | — | — |
| 天然草本/农田混合(natural herbaceous/croplands mosaics) | — | 35 | — |
| 草本耕地(herbaceous croplands) | — | 36 | — |
| 灌木丛地(shrublands) | — | 40 | 40 |
| 茂密的灌木(dense shrublands) | 41 | — | — |
| 灌木/草原混合区(shrubland/grassland mosaics) | 42 | — | — |
| 稀疏的灌木(sparse shrublands) | 43 | — | — |
| 草本湿地(herbaceous wetlands) | — | — | 50 |
| 苔原(tundra) | — | — | 51 |
| 无类别的(unclassified) | 255 | 255 | 255 |
气候变化倡议土地覆盖项目(climate change initiative land cover,CCI-LC)是一个由欧洲空间局(European Environment Agency, ESA)制作的土地覆盖数据产品,先后由ESA的气候变化倡议(Climate Change Initiative, CCI)(2015年及以前)和欧盟委员会(European Commission, EC)哥白尼计划(2016年起)支持。该产品的分类体系基于LCCS,包括23个一级类和15个二级类(见表10)。数据年份为1992—2020年,空间分辨率300 m,源数据采用AVHRR HRPT,SPOT-Vegetation,PROBA-V和Sentinel-3等影像数据[35-36]。
表10 基于LCCS分类体系的CCI-LC全球年度土地覆盖图分类体系
Tab.10
| 一级类(编码+地类) | 二级类(编码+地类) | |
|---|---|---|
| 0无数据(no data) | ||
| 10耕地,雨水灌溉(cropland, rainfed) | 11草本植物覆盖; 12树叶或灌木覆盖 | |
| 20耕地,灌溉的或洪水后的耕地(cropland, irrigated or postflooding) | — | |
| 30混合式耕地(>50%)/自然植被(树木、灌木、草本植物覆盖)(<50%)(mosaic cropland (>50%) / natural vegetation (tree, shrub, herbaceous cover) (<50%)) | — | |
| 40混合式自然植被(树木、灌木、草本植物覆盖)(>50%)/耕地(<50%)(mosaic natural vegetation (tree, shrub, herbaceous cover) (>50%) / cropland (<50%)) | — | |
| 50树木覆盖,阔叶树,常绿,郁闭至稀疏(>15%)(tree cover, broadleaved, evergreen, closed to open (>15%)) | — | |
| 60树木覆盖,阔叶树,落叶树,郁闭至稀疏(>15%)(tree cover, broadleaved, deciduous, closed to open (>15%)) | 61树木覆盖,阔叶树,落叶树,郁闭的(>40%); 62树木覆盖,阔叶树,落叶,稀疏的(15-40%) | |
| 70树木覆盖,针叶树,常绿,郁闭的(>40%)(tree cover, needleleaved, evergreen, closed to open (>15%)) | 71树木覆盖,针叶树,常绿,郁闭的(>40%); 72树木覆盖,针叶树,落叶树,郁闭的(>40%) | |
| 80树木覆盖,针叶树,落叶树,郁闭至稀疏(>15%)(tree cover, needleleaved, deciduous, closed to open (>15%)) | 81树木覆盖,针叶树,落叶树,郁闭的(>40%); 82树木覆盖,针叶,落叶树,稀疏的(15-40%) | |
| 90树木覆盖,混合叶子类型(阔叶和针叶)(tree cover, mixed leaf type (broadleaved and needleleaved)) | — | |
| 100混合的树木和灌木(<>50%)/草本植物覆盖(<50%)(mosaic tree and shrub (>50%) / herbaceous cover (<50%)) | — | |
| 110混合的草本植物覆盖率(>50%)/树木和灌木(<50%)(mosaic herbaceous cover (>50%) / tree and shrub (<50%)) | — | |
| 120灌木丛地(shrubland) | 121常绿灌木丛地; 122落叶灌木丛地 | |
| 130草地(grassland) | — | |
| 140地衣和苔藓(lichens and mosses) | — | |
| 150稀疏的植被(树木、灌木、草本植物覆盖)(<15%)(sparse vegetation (tree, shrub, herbaceous cover) (<15%)) | 151稀疏的树(<15%); 152稀疏的灌木(<15%); 153稀疏的草本植物覆盖(<15%) | |
| 160树木覆盖,被淹没,淡水或半咸水(tree cover, flooded, fresh or brakish water) | — | |
| 170树木覆盖,被淹没,咸水(tree cover, flooded, saline water) | — | |
| 180灌木或草本植物覆盖,淹没,淡水/咸水/半咸水(shrub or herbaceous cover, flooded, fresh/saline/brakish water) | — | |
| 190城市地区(urban areas) | — | |
| 200裸露区城(bare areas) | 201固结的裸露区域; 202未固结的裸露区域 | |
| 210水体(water bodies) | — | |
| 220永久性的冰雪(permanent snow and ice) | — | |
表11 基于LCCS分类体系的GlobCover土地分类体系
Tab.11
| 编码 | 类型名 |
|---|---|
| 11 | 洪水后或灌溉后的耕地(post-floodin or irrigated croplands) |
| 14 | 雨水灌溉的耕地(rainfed croplands) |
| 20 | 混合耕地(50%~70%)/植被(草地、灌木丛、森林)(20%~50%)mosaic cropland (50%~70%) / vegetation (grassland, shrubland, forest) (20%~50%) |
| 30 | 混合植被(草地、灌丛、森林)(50%~70%)/耕地(20%~50%)(mosaic vegetation (grassland, shrubland, forest) (50%~70%) / cropland (20%~50%)) |
| 40 | 郁闭到稀疏的(>15%)常绿阔叶林和/或半落叶林(>5 m)(closed to open (>15%) broadleaved evergreen and/or semi-deciduous forest (>5 m)) |
| 50 | 郁闭的(>40%)阔叶落叶林(>5 m)(closed (>40%) broadleaved deciduous forest (>5 m)) |
| 60 | 稀疏的(15%~40%)阔叶落叶林(>5 m)(open (15%~40%) broadleaved deciduous forest (>5 m)) |
| 70 | 郁闭的(>40%)常绿针叶林(>5 m)(closed (>40%) needleleaved evergreen forest (>5 m)) |
| 90 | 稀疏的(15%~40%)针叶落叶或常绿林(>5 m)(open (15%~40%) needleleaved deciduous or evergreen forest (>5 m)) |
| 100 | 郁闭到稀疏(>15%)阔叶和针叶混交林(>5 m)(closed to open (>15%) mixed broadleaved and needleleaved forest (>5 m) |
| 110 | 混交林:灌丛(50%~70%)/草地(20%~50%)(mosaic forest/shrubland (50%~70%)/grassland (20%~50%)) |
| 120 | 混交林:草原(50%~70%)/森林-灌丛(20%~50%)(mosaic grassland(50%~70%)/forest/shrubland (20%~50%)) |
| 130 | 郁闭到稀疏(>15%)灌木丛(<5 m)(closed to open (>15%) shrubland (<5 m)) |
| 140 | 郁闭到稀疏(>15%)草地(closed to open (>15%) grassland) |
| 150 | 稀疏(>15%)植被(木本植被、灌木、草地)(sparse (>15%) vegetation (woody vegetation, shrubs, grassland)) |
| 160 | 郁闭(>40%)阔叶林经常被洪水淹没-淡水(closed (>40%) broadleaved forest regularly flooded - fresh water) |
| 170 | 郁闭(>40%)半落叶阔叶林和/或常绿阔叶林经常被洪水淹没-咸水(closed (>40%) broadleaved semi-deciduous and/or evergreen forest regularly flooded - saline water) |
| 180 | 郁闭至稀疏(> 15%)植被(草原,灌木地,木本植被)的定期泛滥或含水土壤-淡水,半咸水或盐水)(closed to open (>15%) vegetation (grassland, shrubland, woody vegetation) on regularly flooded or waterlogged soil -fresh, brackish or saline water) |
| 190 | 人造表面和相关区域(城市区域>50%)(artificial surfaces and associated areas (urban areas >50%)) |
| 200 | 裸地(bare areas) |
| 210 | 水体(water bodies) |
| 220 | 永久冰雪(permanent snow and ice) |
表12 基于LCCS分类体系的CGLS-LC100土地覆盖分类体系
Tab.12
| 编码 | 类型名 |
|---|---|
| 0 | 没有可用输入数据 |
| 111 | 郁闭的森林,常绿针叶林(closed forest, evergreen needle leaf) |
| 113 | 郁闭的森林,落叶针叶林(closed forest, deciduous needle leaf) |
| 112 | 郁闭的森林,常绿阔叶林(closed forest, evergreen, broad leaf) |
| 114 | 郁闭的森林,落叶阔叶林(closed forest, deciduous broad leaf) |
| 115 | 郁闭的森林,混交林(closed forest, mixed) |
| 116 | 郁闭的森林,未知(closed forest, unknown) |
| 121 | 稀疏的森林,常绿针叶林(open forest, evergreen needle leaf) |
| 123 | 稀疏的森林,落叶针叶林(open forest, deciduous needle leaf) |
| 122 | 稀疏的森林,常绿阔叶林(open forest, evergreen broad leaf) |
| 124 | 稀疏的森林,落叶阔叶林(open forest, deciduous broad leaf) |
| 125 | 稀疏的森林,混交林(open forest, mixed) |
| 126 | 稀疏的森林,未知(open forest, unknown) |
| 20 | 灌木(shrubs) |
| 30 | 草本植被(herbaceous vegetation) |
| 90 | 草本湿地(herbaceous wetland) |
| 100 | 苔藓及地衣植物(moss and lichen) |
| 60 | 裸地/稀疏植被(bare / sparse vegetation) |
| 40 | 种植和管护的植被/农业(耕地)(cultivated and managed vegetation/agriculture (cropland)) |
| 50 | 城市/建成区(urban / built up) |
| 70 | 冰雪(snow & ice) |
| 80 | 永久性水体(permanent water bodies) |
| 200 | 开阔海域(open sea) |
全球30 m地表覆盖精细分类产品(global land-cover product with fine classification system at 30 m,GLC_FCS30)是由中国科学院空天信息创新研究院刘良云研究员团队研发的。GLC_FCS30分类体系相比同分辨率数据产品类别更多样化。如表13所示,GLC_FCS30-2015分类体系共包括9个一级类、16个二级类(全球LCCS土地覆盖类型)和30个三级类(16个全球LCCS土地覆盖类型和14个详细的区域土地覆盖类型)。对应的数据产品为GLC_FCS30-2015,该数据的生产采用一种基于时空光谱库(SPECLib)的多时相分类方法[39]。
表13 基于LCCS分类体系的GLC_FCS30-2015土地覆盖精细分类体系
Tab.13
| 0级分类体系 | LCCS分类体系 | 精细分类体系 | ||
|---|---|---|---|---|
| 编码 | 类型名 | 编码 | 类型名 | |
| 农田(cropland) | 10 | 雨养农田 | 10 | 雨养农田 |
| 11 | 草本植被 | |||
| 12 | 树木或灌木覆盖物(果园) | |||
| 20 | 灌溉农田 | 20 | 灌溉农田 | |
| 森林(forest) | 50 | 常绿阔叶林 | 50 | 常绿阔叶林 |
| 60 | 落叶阔叶林 | 60 | 落叶阔叶林 | |
| 61 | 郁闭的落叶阔 叶林 | |||
| 62 | 稀疏的落叶阔 叶林 | |||
| 70 | 常绿针叶林 | 70 | 常绿针叶林 | |
| 71 | 郁闭的的常绿针叶林 | |||
| 72 | 稀疏的常绿针叶林 | |||
| 80 | 落叶针叶林 | 80 | 落叶针叶林 | |
| 81 | 郁闭的的落叶针叶林 | |||
| 82 | 稀疏的落叶针叶林 | |||
| 90 | 混交林 | 90 | 混交林 | |
| 灌木丛(shrubland) | 120 | 灌木丛 | 120 | 灌木丛 |
| 121 | 常绿灌丛 | |||
| 122 | 落叶灌丛 | |||
| 草原(grassland) | 130 | 草原 | 130 | 草原 |
| 湿地(wetlands) | 180 | 湿地 | 180 | 湿地 |
| 不透水面(impervious surfaces) | 190 | 不透水面 | 190 | 不透水面 |
| 裸露区域(bare areas) | 140 | 地衣和苔藓 | 140 | 地衣和苔藓 |
| 150 | 稀疏植被 | 150 | 稀疏植被 | |
| 152 | 稀疏的灌丛 | |||
| 153 | 稀疏的草本 覆盖 | |||
| 200 | 裸露区域 | 200 | 裸露区域 | |
| 201 | 固结的裸露区域 | |||
| 202 | 未固结的裸露区域 | |||
| 水体(water body) | 210 | 水体 | 210 | 水体 |
| 永久冰雪(permanent ice and snow) | 220 | 永久冰雪 | 220 | 永久冰雪 |
相比GLC_FCS30-2015的16个全球LCCS土地覆盖类型,GLC_FCS30-2020土地覆盖精细分类体系提供了一个含30种土地覆盖类型的全球30 m土地覆盖分类体系(表14)。GLC_FCS30-2020土地覆盖数据产品采用GLC_FCS30-2020分类体系, 进一步提高了3种典型土地覆盖类型(不透水表面、水体和耕地)的分类性能,并且改善了不连续空间转换的数量较少的问题[40]。GLC_FCS30-1985_2020产品同样采用GLC_FCS30-2020土地覆盖分类体系,提出了耦合变化检测和动态更新的土地覆盖动态监测的自动化方案,利用 1984—2020 年所有Landsat卫星数据,实现了从1985—2020年以5 a为周期的30 m分辨率数据产品的生产。
表14 基于LCCS分类体系的GLC_FCS30-2020土地覆盖精细分类体系
Tab.14
| 编码 | 精细分类体系 |
|---|---|
| 10 | 雨养农田(rainfed cropland) |
| 11 | 草本植被(herbaceous cover) |
| 12 | 树木或灌木覆盖物(果园)(tree or shrub cover (orchard)) |
| 20 | 灌溉农田(irrigated cropland) |
| 51 | 稀疏的常绿阔叶林(open evergreen broadleaved forest) |
| 52 | 郁闭的常绿阔叶林(closed evergreen broadleaved forest) |
| 61 | 稀疏的落叶阔叶林(open deciduous broadleaved forest) |
| 62 | 郁闭的落叶阔叶林(closed deciduous broadleaved forest) |
| 71 | 稀疏的常绿针叶林(open evergreen needle-leaved forest) |
| 72 | 郁闭的常绿针叶林(closed evergreen needle-leaved forest) |
| 81 | 稀疏的落叶针叶林(open deciduous needle-leaved forest) |
| 82 | 郁闭的落叶针叶林(closed deciduous needle-leaved forest) |
| 91 | 稀疏的混交林(阔叶和针叶)(open mixed leaf forest (broadleaved and needle-leaved)) |
| 92 | 郁闭的混交林(阔叶和针叶)(closed mixed leaf forest (broadleaved and needle-leaved)) |
| 120 | 灌木丛(shrubland) |
| 121 | 常绿灌丛(evergreen shrubland) |
| 122 | 落叶灌丛(deciduous shrubland) |
| 130 | 草原(grassland) |
| 140 | 地衣和苔藓(lichens and mosses) |
| 150 | 稀疏植被(sparse vegetation) |
| 152 | 稀疏的灌丛(sparse shrubland) |
| 153 | 稀疏的草本覆盖(sparse herbaceous) |
| 180 | 湿地(wetlands) |
| 190 | 不透水面(impervious surfaces) |
| 200 | 裸露区域(bare areas) |
| 201 | 固结的裸露区域(consolidated bare areas) |
| 202 | 未固结的裸露区域(unconsolidated bare areas) |
| 210 | 水体(water body) |
| 220 | 永久冰雪(permanent ice and snow) |
| 250 | 填充值(filled value) |
表15 基于LCCS分类体系的iMap World 1.0土地覆盖制图分类体系
Tab.15
| 一级类(编码+地类) | 二级类(编码+地类) |
|---|---|
| 10耕地和管理地(cultivated and managed areas) | 10耕地和管理地 |
| 20树(tree) | 21常绿阔叶 |
| 22落叶阔叶,郁闭,有叶 | |
| 23落叶阔叶,郁闭,落叶 | |
| 24落叶阔叶,稀疏,有叶 | |
| 25落叶阔叶,稀疏,落叶 | |
| 26常绿针叶 | |
| 27落叶针叶,有叶 | |
| 28落叶针叶,落叶 | |
| 29混合叶型,有叶 | |
| 30混叶型,落叶 | |
| 31树木覆盖,烧毁(tree cover, burnt) | 31树木覆盖,烧毁 |
| 40灌木或草本覆盖(shrub cover or herbaceous) | 41常绿灌木 |
| 42落叶灌木 | |
| 43落叶灌木 | |
| 44草本,有叶 | |
| 45草本,落叶 | |
| 50湿地(wetland) | 51树木覆盖,定期淹没,淡水和半咸水 |
| 52树木覆盖,定期淹没,咸水 | |
| 53经常被淹的灌木和/或草本覆盖,有叶 | |
| 54经常被淹的灌木和/或草本覆盖,落叶 | |
| 60混合的植被(mosaic-vegetation) | 61树木/其他自然植被 |
| 62作物/树木/其他自然植被 | |
| 63作物/灌木或草本 | |
| 64落叶植被 | |
| 65作物/树木/其他自然植被,落叶 | |
| 66作物/灌木或草本,落叶 | |
| 70非植被(non-vegetation) | 71裸露区域 |
| 72水体 | |
| 73人造表面和相关区域 | |
| 74冰雪 | |
| 80稀疏草本或稀疏灌木覆盖(sparse herbaceous or sparse shrub cover) | 80稀疏草本或稀疏灌木覆盖 |
表16 基于LCCS分类体系的WorldCover 10 m土地覆盖分类体系
Tab.16
| 编码 | 土地覆盖类型 |
|---|---|
| 10 | 树木覆盖(tree cover) |
| 20 | 灌木(shrubland) |
| 30 | 草地(grassland) |
| 40 | 农田(cropland) |
| 50 | 建成区(built-up) |
| 60 | 裸地/稀疏植被(bare / sparse vegetation) |
| 70 | 冰雪(snow and ice) |
| 80 | 永久性水体(permanent water bodies) |
| 90 | 草本湿地(herbaceous wetland) |
| 95 | 红树林(mangroves) |
| 100 | 苔藓及地衣植物(moss and lichen) |
表17 基于LCCS分类体系的GLC-SHARE全球土地覆盖汇总类别
Tab.17
| 编码 | 类型 |
|---|---|
| 01 | 人工地表(artificial surfaces) |
| 02 | 耕地(cropland) |
| 03 | 草地(grassland) |
| 04 | 树木覆盖区(tree covered areas) |
| 05 | 灌木覆盖区(shrubs covered areas) |
| 06 | 草木植被、水生或定期淹没(herbaceous vegetation, aquatic or regularly flooded) |
| 07 | 红树林(mangroves) |
| 08 | 稀疏植被(sparse vegetation) |
| 09 | 裸土(baresoil) |
| 10 | 雪和冰川(snow and glaciers) |
| 11 | 水体(water bodies) |
表18 基于LCCS的GeoWiki Hybrid土地覆盖分类体系
Tab.18
| 编码 | 类别 |
|---|---|
| 1 | 树木覆盖(tree cover) |
| 2 | 灌木覆盖(shrub cover) |
| 3 | 草本植被/草地(herbaceous vegetation/grassland) |
| 4 | 栽培和管理的植被(cultivated and managed) |
| 5 | 栽培和管理/自然植被的镶嵌(mosaic of cultivated and managed/natural vegetation) |
| 6 | 洪泛/湿地(flooded/wetland) |
| 7 | 城市(urban) |
| 8 | 雪和冰(snow and ice) |
| 9 | 裸地(barren) |
| 10 | 地表水(open water) |
1.5 GlobeLand30和AGLC全球土地覆盖分类体系及数据产品
表19 GlobeLand30土地覆盖分类体系
Tab.19
| 编码 | 类型 |
|---|---|
| 10 | 耕地(cultivated land) |
| 20 | 林地(forest) |
| 30 | 草地(grassland) |
| 40 | 灌木地(shrubland) |
| 50 | 湿地(wetland) |
| 60 | 水体(water bodies) |
| 70 | 苔原(4个亚类型: 71灌木苔原、72禾本苔原、73湿苔原与74裸地苔原)(tundra) |
| 80 | 人造地表(artificial surfaces) |
| 90 | 裸地(bare land) |
| 100 | 冰川和永久积雪(permanent snow and ice) |
表20 AGLC土地覆盖分类体系
Tab.20
| 编码 | 类型 |
|---|---|
| 10 | 耕地(cultivated land) |
| 20 | 林地(forest) |
| 30 | 草地(grassland) |
| 40 | 灌木地(shrubland) |
| 50 | 湿地(wetland) |
| 60 | 水体(water bodies) |
| 70 | 苔原(tundra) |
| 80 | 不透水面(artificial surfaces) |
| 90 | 裸地(bare land) |
| 100 | 永久冰雪(permanent snow and ice) |
1.6 FROM-GLC系列产品和基于FROM-GLC产品的土地覆盖分类体系
FROM-GLC是清华大学地球系统科学系宫鹏教授团队研制的一套高分辨率全球土地覆盖图,包括FROM-GLC30,FROM-GLC10,FROM-GLC-seg和FROM-GLC-agg等。
表21 FROM-GLC 2010土地覆盖分类体系
Tab.21
| 一级类(编码+地类) | 二级类(编码+地类) |
|---|---|
| 10农地(croplands) | 11水稻田,12温室,13其他农地 |
| 20森林(forest) | 21阔叶林,22针叶林,23混交林,24果园 |
| 30草地(grasslands) | 31牧草地,32其他草地 |
| 40灌丛(shurblands) | — |
| 50湿地(wetland) | 51沼泽地,52泥滩 |
| 60水体(waterbodies) | 61湖,62水库/池塘,63河流,64海洋 |
| 70苔原(tundra) | 71灌丛和灌丛苔原(= 40灌丛),72草本苔原 |
| 80不透水面(impervious) | 81不透水层-高反照率,82不透水层-低反照率 |
| 90裸地(barren land) | 91干盐滩,92沙区,93裸露的岩石,94裸露的草本耕地,95干湖/河床,96其他荒地 |
| 100冰雪(snow and ice) | 101雪,102冰 |
| 999云(cloud) | — |
如表22所示,FROM-GLC 2015分类体系定义包含11个一级类别和23个二级类别。这些类别定义可以映射到FAO LCCS和 IGBP分类体系。FROM-GLC30数据集的2015年版本采用该分类体系,分类数据包含Landsat5/7/8、中国高分卫星、资源卫星、环境卫星和SRTM地形数据等。
表22 FROM-GLC 2015土地覆盖分类体系
Tab.22
| 一级类(编码+地类) | 二级类(编码+地类) |
|---|---|
| 10农地(cropland) | 11水稻田; 12温室; 13其他农地; 14果园; 15裸农地 |
| 20森林(forest) | 21阔叶,有叶; 22阔叶,落叶; 23针叶,有叶; 24针叶,落叶; 25混交,有叶; 26混交,落叶 |
| 30草地(grassland) | 31牧草地; 32自然草地; 33自然草地,落叶 |
| 40灌丛(shrubland) | 41灌丛,有叶; 42灌丛,落叶 |
| 50湿地(wetland) | 51沼泽地,有叶; 52泥滩; 53沼泽地,落叶 |
| 60水体(water) | — |
| 70苔原(tundra) | 71灌丛苔原; 72草本苔原 |
| 80不透水面(impervious surface) | — |
| 90裸地(bareland) | — |
| 100冰雪(snow/ice) | 101雪; 102冰 |
| 120云(cloud) | — |
表23 FROM-GLC 2017土地覆盖分类体系
Tab.23
| 编码 (FROM-GLC30) | 编码 (FROM-GLC10) | 地类 |
|---|---|---|
| 1 | 10 | 农地(cropland) |
| 2 | 20 | 森林(forests) |
| 3 | 30 | 草地(grasslands) |
| 4 | 40 | 灌丛(shrublands) |
| 5 | 50 | 湿地(wetland) |
| 6 | 60 | 水体(water) |
| 7 | 70 | 苔原(tundra) |
| 8 | 80 | 不透水面(impervious) |
| 9 | 90 | 裸地(barelands) |
| 10 | 100 | 冰雪(snow/ice) |
表24 FROM-GLC-seg土地覆盖分类体系
Tab.24
| 一级类 | 二级类 |
|---|---|
| 农地(cropland) | 水稻田,温室,其他农地 |
| 森林(forest) | 阔叶林,针叶林,混交林,果园 |
| 草地(grassland) | 人工,自然,湿地-草原,苔原-草原 |
| 灌丛(shrubland) | 灌丛,苔原-灌丛 |
| 水体(water) | 湖,池塘,河流,海洋 |
| 裸地(bareland) | 碱土,沙,岩石,裸露的耕地,河床,其他裸地 |
| 冰雪(snow/ice) | 雪,冰 |
表25 FROM-GLC-agg土地覆盖分类体系
Tab.25
| 一级类 | 二级类 |
|---|---|
| 农地(cropland) | 水稻田,温室,其他农地 |
| 森林(forests) | 阔叶林,针叶林,混交林,果园 |
| 草地(grasslands) | 人工,自然,湿地-草原,苔原-草原 |
| 灌丛(shrublands) | 灌丛,苔原-灌丛 |
| 水体(water) | 陆地水,海水 |
| 不透水面(impervious) | 高反照率,低反照率 |
| 裸地(barelands) | 碱土,沙,岩石,裸露的耕地,河床,其他裸地 |
| 冰雪(snow/ice) | 雪,冰 |
| 云(cloud) | — |
表26 基于FROM-GLC第二版分类体系的GLASS-GLC土地覆盖分类体系
Tab.26
| 类别 | 子类别 |
|---|---|
| 农田(cropland) | 稻田,温室,其他农田,果园,裸地 |
| 森林(forest) | 阔叶树、有叶,阔叶树、落叶,针叶树、有叶,针叶树、落叶,混交树种、有叶,混交树种、落叶 |
| 草地(grassland) | 牧场、有叶,天然草地、有叶,草原、有叶 |
| 灌丛(shrubland) | 灌木、有叶,灌木、落叶 |
| 苔原(tundra) | 灌丛和矮树苔原,草本苔原 |
| 荒地(barren land) | 荒地 |
| 冰雪(snow/ice) | 雪,冰 |
表27 基于FROM-GLC分类体系的iMap World 1.0土地覆盖制图分类体系
Tab.27
| 一级类(编码+地类) | 二级类(编码+地类) |
|---|---|
| 10农地(cropland) | 11水稻田,12温室,13其他农地,14果园,15裸农地 |
| 20森林(forest) | 21阔叶、有叶, 22阔叶、落叶,23针叶、有叶,24针叶、落叶,25混交、有叶, 26混交、落叶 |
| 30草地(grassland) | 31牧草地、有叶,32自然草地、有叶, 33自然草地、落叶 |
| 40灌丛(shrublands) | 41灌丛、有叶,42灌丛、落叶 |
| 50湿地(wetland) | 51沼泽地、有叶,52泥滩,53沼泽地、 落叶 |
| 60水体(water body) | 61湖,62水库/池塘,63河流,64海洋 |
| 70苔原(tundra) | 71灌丛和灌丛苔原,72草本苔原 |
| 80不透水面(impervious) | 80不透水层 |
| 90裸地(barren land) | 90裸地 |
| 100冰雪(snow/ice) | 101雪,102冰 |
1.7 Esri 10 m Land Cover时间序列数据产品及分类体系
表28 Esri 10 m Land Cover分类体系
Tab.28
| 编码 | 类型 |
|---|---|
| 1 | 水体(water) |
| 2 | 树木(trees) |
| 4 | 被淹没的植被(flooded vegetation) |
| 5 | 作物(crops) |
| 7 | 建成区(built area) |
| 8 | 裸地(bare ground) |
| 9 | 冰雪(snow/ice) |
| 10 | 云(clouds) |
| 11 | 天然草地(rangeland) |
1.8 Dynamic World全球土地利用土地覆盖制图及分类体系
表29 Dynamic World分类体系
Tab.29
| 编码 | LULC类型 |
|---|---|
| 0 | 水(water) |
| 1 | 树木(trees) |
| 2 | 草(grass) |
| 3 | 被淹没的植被(flooded vegetation) |
| 4 | 作物(crops) |
| 5 | 灌木和灌丛(shrub and scrub) |
| 6 | 建成区(built area) |
| 7 | 裸露的地面(bare ground) |
| 8 | 冰雪(snow and ice) |
2 讨论
2.1 土地覆盖分类体系精细程度以及分类体系、空间分辨率、空间尺度的关系
按照数据产品的空间分辨率(同数据产品空间分辨率不同,按照最高的为准)的降序排列(分辨率低的在前,分辨率高的在后),汇总了本文调研的29个不同的土地覆盖分类体系(表30),列举分类体系名称、对应的分类产品名称、类别总数量、数据对应的年份、空间覆盖范围信息。其中“类别总数量”的表达方式包含几种类型: 单独的数字表示该分类体系只有一个级别; “+”用来区分同一分类体系不同级别的类别数量; “,”用来区分同种分类产品不同分类体系的情况,和表格第二列“分类体系”对应。
表30 土地覆盖分类体系汇总
Tab.30
| 最高空间 分辨率/m | 分类体系 | 分类产品 | 类别总数量 | 数据对应时间 | 空间覆 盖范围 |
|---|---|---|---|---|---|
| 5 000 | FROM-GLC | GLASS-GLC | 7 | 1982—2015 | 全球 |
| 1 000 | IGBP | DISCover | 17 | 1992年4月—1993年3月 | 全球 |
| 1 000 | IGBP | UMD | 14 | 1992年4月—1993年3月 | 全球 |
| 1 000 | LCCS | GLC2000 | 22 | 2000 | 全球 |
| 1 000 | LCCS | GLC-SHARE | 11 | 2013 | 全球 |
| 500 | LCCS | GLCNMO | 20 | 2003(1km),2008(1km),2013 | 全球 |
| 500 | IGBP,UMD,LAI,BGC,PFT,LCCS | MCD12Q1 | 18,17,12,10,13,17/12/11 | 2001—2020 | 全球 |
| 500 | IGBP,UMD,LAI | MCD12C1 | 18,17,12 | 2001—2020 | 全球 |
| 300 | LCCS | CCI-LC | 23+15 | 1992—2020 | 全球 |
| 300 | LCCS | GlobCover | 22 | 2005—2009 | 全球 |
| 100 | CORINE | CLC | 5+15+44 | 1990,2000,2006,2012,2018 | 欧洲部分区域 |
| 100 | LCCS | CGLS-LC100 | 23 | 2015—2019 | 全球 |
| 30 | LCCS | GLC_FCS30-2015 | 9+16+30 | 2015 | 全球 |
| 30 | LCCS | GLC_FCS30-2020/GLC_FCS30-1985-2020 | 30 | 2020/1985—2020 | 全球 |
| 30 | LCCS | GeoWiki Hybrid | 10 | 2005 | 全球 |
| 30 | LCCS,FROM-GLC | iMap World 1.0 | 8+33,10+29 | 1985—2020 | 全球 |
| 30 | GlobeLand30 | GlobeLand30 | 10+4(苔原) | 2000,2010,2020 | 全球 |
| 30 | AGLC | AGLC-2000-2015 | 10 | 2010—2015 | 全球 |
| 30 | FROM-GLC | FROM-GLC30 (2010) | 11+27 | 2010 | 全球 |
| 30 | FROM-GLC | FROM-GLC30 (2015) | 11+23 | 2015 | 全球 |
| 30 | FROM-GLC | FROM-GLC30 (2017) | 10 | 2017 | 全球 |
| 30 | FROM-GLC | FROM-GLC-seg | 7+27 | 2010 | 全球 |
| 30 | FROM-GLC | FROM-GLC-agg | 9+25 | 2010 | 全球 |
| 30 | USGS | NLCD 2019 | 8+20 | 2001,2004,2006,2008,2011,2013,2016,2019 | 美国 |
| 28.5 | USGS | GeoCover LC | 13 | 1990 | 全球部分地区 |
| 10 | FROM-GLC | FROM-GLC10 | 10 | 2017 | 全球 |
| 10 | LCCS | WorldCover 10 m | 11 | 2020,2021 | 全球 |
| 10 | Esri 10m Land Cover | Esri 10m Land Cover | 9 | 2017—2021 | 全球 |
| 10 | Dynamic World | Dynamic World | 9 | 2015年后(每2~5 d) | 全球 |
分类体系的精细程度既受到所采用的影像数据和多源数据对地物特征的分辨和表达能力的制约,也和采用的技术路线直接相关。比如,100 m或者更粗分辨率的土地覆盖产品的分类类别数目多集中在10~25类之间,30 m分辨率的全球土地覆盖数据产品分类类别数集中在20~30类之间,而10 m全球土地覆盖产品分类类别多集中在9~11类。值得注意的是,全球土地覆盖数据产品中,精细分类程度较高的数据产品普遍采用LCCS和FROM-GLC分类体系。这2种分类体系,在精细化分类方面有明显的优势,更适合精细化分类需求。本文的调研主要集中在全球土地覆盖分类体系和产品,如果制图范围缩小为区域尺度,则分类体系往往具有很高的分类精细程度,比如CORINE CLC分类体系和产品实现了“5+15+44”的三级分类体系,分类精细程度位居所有分类体系之首。事实上,高分辨率全球土地覆盖信息产品面临着明显的技术挑战,包括严重的全球“同物异谱/异物同谱”现象、影像分类提取和变化检测算法能力不足、单期高精度和多期时空一致性的实现困难、训练数据不充足、卫星数据成本高、高性能计算设施的保障不足等[3,39,50]。这些都决定了实现超大区域的精细分类存在明显的难度。
2.2 分类体系之间的语义一致性
目前的多种分类体系之间存在6种语义一致性不足的现象:
2)同一个分类基准和类别的精细子类之间的一致性不足。以FAO LCCS土地覆盖分类体系为例,本文调研的全球地表覆盖数据中有11套数据产品都使用该体系作为基准。不同产品中的同种类型可以有相同的LCCS编码,便于数据的对比和使用[28-29]。然而,不同产品间的分类体系的语义一致性并不是必选项,先后形成了一些异质的精细分类。比如,灌木类型在不同的基于LCCS的分类体系间存在明显差异: 在GLC2000分类体系中,灌木出现在5个土地覆盖类型中,其中有2个为单一灌木覆盖(非混合地类)的细分类型[31]; 在GLCNMO分类体系中,灌木被分为2类,其中有1个为单一灌木覆盖的细分类型[32-
3)相同土地覆盖类型的名称一致性不足。由于术语标准化水平不足和同义词的存在,不同分类体系存在采用同义或者近义词表征相同类型的情形。例如在IGBP分类体系中的“常绿阔叶林(evergreen broadleaf forest)”可以对应GLC2000分类体系中的“树木覆盖,阔叶的,常绿的(tree cover, broadleaved, evergreen)”类型。这种现象带来了一定程度的语言混淆,造成数据理解的障碍,也为计算机可理解、可自动化的信息融合提取带来新的困难。针对此现象,LCCS分类体系开发了一个协作翻译模块,能够把LCCS作为参考基准,对相关的土地覆盖分类体系进行比较和关联[6,28-29]。
6)不同土地覆盖产品在是否含有土地利用类型方面存在不一致性。土地覆盖是在地球表面观察到的(生物)物理覆盖,而土地利用是人们为生产而改变或维持某种土地覆盖类型所进行的安排、活动和投入[59]。全球或地区的土地分类体系主要以土地覆盖为主,但也有一部分兼有土地覆盖和土地利用分类体系[2,7]。例如,IGBP,UMD和LCCS等都只包含土地覆盖分类体系,而USGS Anderson,NLCD,CLC和FROM-GLC等同时包含土地覆盖和土地利用的分类。比如USGS Anderson土地覆盖分类体系中,一级类土地覆盖类型“水体”下,二级类包括“溪流和运河”、“湖泊”、“海湾”和“河口”等土地覆盖类型和“水库”土地利用类型[15-16]。
分类体系间不一致现象产生的原因主要是制图的理念和需求不同、采用的方法和依赖的基础数据各异等。多种不一致现象给数据产品的理解、分析、对比和融合带来了新的困难,对领域的发展也在一定程度上产生了制约作用。
3 总结
近年来土地覆盖数据产品呈现出全球化和区域化并存、分类精细程度高、产品精度高、时间间隔和空间分辨率更加细致的趋势。这些全球地表覆盖数据产品针对不同的应用需求,采用1—3级数量不等的分类体系,实现了空间分辨率从10~5 000 m不等的地表覆盖分类。全球土地覆盖分类体系呈现出以LCCS开放体系为主、FROM-GLC和USGS等多种分类体系并存发展的趋势。
另一方面,由于在理念、需求、方法和基础数据等方面的差异,现有全球土地覆盖分类体系也存在明显的语义不一致性。多种分类体系之间存在诸多语义冲突,目前没有很好的分类体系标准化和兼容性解决方案,也没有统一的类别代码,为数据产品的理解、分析、对比和融合带来了新的困难,也给数据的产品比较、共享、转换带来了一定的挑战。目前已有土地覆盖分类相关的多个国际标准规范。比如,ISO地理信息技术委员会(TC 211)的19144系列标准目前涵盖了分类系统结构、土地覆盖分类元描述语言、土地利用分类元语言等方面。此外,19152系列标准聚焦土地管理领域模型,包括通用概念模型、陆地领域土地登记、海洋领域属地管理、估价、空间规划等不同的方面。这些规范有望为土地覆盖分类体系的标准化和兼容性解决方案提供支持。
土地覆盖数据产品作为一种基础的共性数据集,未来还需要更多的领域协调和自治,国际组织、国家政府、科研机构尚需通力合作,在科学性、系统性和兼容性的土地覆盖分类体系设计,以及土地覆盖数据产品的可发现、可访问、可互操作和可重用方面进一步提出解决方案。
附录
本附录主要包含本文相关的各土地覆盖数据产品的下载链接(顺序同表30)。
附表1 本文相关的各土地覆盖数据产品的下载链接
Appendix Tab.1
| 序号 | 数据产品 | 下载链接 |
|---|---|---|
| 1 | GLASS-GLC | |
| 2 | DISCover | |
| 3 | UMD | |
| 4 | GLC2000 | |
| 5 | GLC-SHARE | |
| 6 | GLCNMO | |
| 7 | MCD12Q1 | |
| 8 | MCD12C1 | |
| 9 | CCI-LC | |
| 10 | GlobCover | |
| 11 | CLC | |
| 12 | CGLS-LC100 | |
| 13 | GLC_FCS30-2015 | |
| 14 | GLC_FCS30-2020/GLC_FCS30-1985_2020 | |
| 15 | GeoWiki Hybrid 1, 2 | |
| 16 | iMap World 1.0 | 暂未提供数据 |
| 17 | GlobeLand30 | |
| 18 | AGLC-2000-2015 | |
| 19 | FROM-GLC30 (2010) | |
| 20 | FROM-GLC30 (2015) | |
| 21 | FROM-GLC30 (2017) | |
| 22 | FROM-GLC-seg | |
| 23 | FROM-GLC-agg | |
| 24 | NLCD | |
| 25 | GeoCover LC | |
| 26 | FROM-GLC10 | |
| 27 | WorldCover 10 m | |
| 28 | Esri 10m Land Cover | |
| 29 | Dynamic World |
参考文献
全球地表覆盖高分辨率遥感制图
[J].
Higher resolution global land cover mapping
[J].
GlobeLand30遥感制图创新与大数据分析
[J].
GlobeLand30:Operational global land cover mapping and big-data analysis
[J].
Effects of land cover conversion on surface climate
[J].DOI:10.1023/A:1013051420309 [本文引用: 1]
全球30 m地表覆盖遥感数据产品-Globe Land30
[J].
30-meter global land cover data product-Globe Land30
[J].
The standardization and harmonization of land cover classification systems towards harmonized datasets:A review
[J].
DOI:10.3390/ijgi6050154
URL
[本文引用: 2]

A number of national, regional and global land cover classification systems have been developed to meet specific user requirements for land cover mapping exercises, independent of scale, nomenclature and quality. However, this variety of land-cover classification systems limits the compatibility and comparability of land cover data. Furthermore, the current lack of interoperability between different land cover datasets, often stemming from incompatible land cover classification systems, makes analysis of multi-source, heterogeneous land cover data for various applications a very difficult task. This paper provides a critical review of the harmonization of land cover classification systems, which facilitates the generation, use and analysis of land cover maps consistently. Harmonization of existing land cover classification systems is essential to improve their cross-comparison and validation for understanding landscape patterns and changes. The paper reviews major land cover classification standards according to different scales, summarizes studies on harmonizing land cover mapping, and discusses some research problems that need to be solved and some future research directions.
土地利用/土地覆被分类系统研究进展
[J].土地利用/土地覆被变化是全球变化研究中的一个重要内容,而土地利用/土地覆被分类又是研究土地覆被变化的重要前提,它既影响着分类结果的表达,也决定着分类数据的应用领域。本文简要回顾和评述了国内外土地利用/土地覆被分类系统的研究进展。研究认为,土地利用/土地覆被分类系统,1970年代之前以土地利用分类为主,着重于土地用途的差异,主要用于土地利用现状调查和土地利用制图;1970年代随着遥感和计算机技术的发展,以土地覆被为主的分类系统迅速发展起来,它着重于土地类型的差异,主要用于土地覆被变化研究。研究指出,目前的土地利用/土地覆被分类系统一般都适用于特定研究目的和研究尺度,没有统一标准,这种土地分类系统的不兼容性,给土地覆被数据的汇总、分析与共享带来了诸多不便。但一个“万能”的土地分类系统又是不存在的。鉴于此,研究认为一个标准土地分类系统应该是多级的、开放的系统,高级别的土地覆被类型可以直接基于遥感影像进行识别,以便于实现分类数据的比较和共享;低级别的土地覆被类型可以根据特定研究目的灵活制定,以满足特定的研究需要。
Progress on studies of land use/land cover classification systems
[J].Land use and land cover change (LUCC) is one of the most important aspects within the scope of global change. As a critical portion of LUCC study, classification of land use and land cover types not only affects the classification results, but also determines applications of relevant data. In the paper, studies of land use and land cover classification systems were reviewed. It could be concluded that the land use and land cover classification laid more emphasis on the land use classification before the 1970s. The land use classification system emphasized the differences between land functions and was mainly applied to land use inventory investigation and land use mapping. After then, the classification system based on land cover rapidly developed due to the development of satellite remote sensing and computer technology. This classification system emphasized the differences between land categories and was mainly applied to land cover change studies. The review shows that almost all current land use and land cover classification systems tend to be suitable only for a specific research purpose at a certain scale. The incompatibility amongst the current classification systems has resulted in numerous inconveniences and difficulties in the courses of aggregation, analysis, and sharing of land use and land cover data due to the absence of consistent standards. Therefore, a standardized classification system is extremely warranted. However, a universal classification system suitable for all kinds of research purposes is neither possible nor necessary. The reasons lie in that on the one hand, the minimum classification unit could be dependent on the mapping scale as well as the spatial resolution of remote sensing data; on the other hand, land use and land cover types of varying detailed degrees are required for different research purposes. Furthermore, it would be probable that some special land use and land cover types existed in specific regions, for example, the Qinghai-Tibet Plateau in China. At last, this review states that a standardized classification system should be hierarchically organized and could be extended. The land use and land cover types of higher hierarchy could be directly identified from remote sensing images without auxiliary information, which would make it convenient for data comparison and sharing. The land use and land cover types of lower hierarchy could be defined in terms of a specific study purpose, which could satisfy the specific study needs.
Characteristics and progress of land use/cover change research during 1990—2018
[J].DOI:10.1007/s11442-022-1960-2 [本文引用: 1]
Comparison of glo-bal land cover datasets for cropland monitoring
[J].
DOI:10.3390/rs9111118
URL
[本文引用: 3]
Accurate and reliable information on the spatial distribution of major crops is needed for detecting possible production deficits with the aim of preventing food security crises and anticipating response planning. In this paper, we compared some of the most widely used global land cover datasets to examine their comparative advantages for cropland monitoring. Cropland class areas are compared for the following datasets: FAO-GLCshare (FAO Global Land Cover Network), Geowiki IIASA-Hybrid (Hybrid global land cover map from the International Institute of Applied System Analysis), GLC2000 (Global Land Cover 2000), GLCNMO2008 (Global Land Cover by National Mapping Organizations), GlobCover, Globeland30, LC-CCI (Land Cover Climate Change Initiative) 2010 and 2015, and MODISLC (MODIS Land Cover product). The methodology involves: (1) highlighting discrepancies in the extent and spatial distribution of cropland, (2) comparing the areas with FAO agricultural statistics at the country level, and (3) providing accuracy assessment through freely available reference datasets. Recommendations for crop monitoring at the country level are based on a priority ranking derived from the results obtained from analyses 2 and 3. Our results revealed that cropland information varies substantially among the analyzed land cover datasets. FAO-GLCshare and Globeland30 generally provided adequate results to monitor cropland areas, whereas LC-CCI2010 and GLC2000 are less unsuitable due to large overestimations in the former and out of date information and low accuracy in the latter. The recently launched LC-CCI datasets (i.e., LC-CCI2015) show a higher potential for cropland monitoring uses than the previous version (i.e., LC-CCI2010).
关于我国土地利用分类问题的讨论
[J].
A discussion on the classification of land use in China
[J].
试论土地分类
[J].
Discussion on the land classification
[J].
Land use/cover classification:An introduction review and comparison
[J].
Developing land use/cover classification system based on remote sensing data in China
[C]//
IPCC与我国土地利用分类的对比分析
[J].
Land use classification comparative analysis between IPCC and China
[J].
A new generation of the United States National Land Cover Database:Requirements,research priorities,design,and implementation strategies
[J].
Thematic accuracy assessment of the NLCD 2016 land cover for the conterminous United States
[J].
Completion of the 1990s national land cover data set for the conterminous United States from Landsat thematic mapper data and ancillary data sources
[J].
Development of a global land cover characteristics database and IGBP DISCover from 1 km AVHRR data
[J].DOI:10.1080/014311600210191 URL [本文引用: 2]
ISLSCP II MODIS(Collection 4) IGBP Land Cover,2000—2001
[DB/OL].Oak Ridge,
A comparison of the IGBP DISCover and University of Maryland 1 km global land cover products
[J].DOI:10.1080/014311600210218 URL [本文引用: 2]
Global land cover classification at 1 km spatial resolution using a classification tree approach
[J].DOI:10.1080/014311600210209 URL
MODIS enhanced land cover and land cover change product algorithm theoretical basis documents (ATBD) version 2.0
[R/OL].
User guide to collection 6 MODIS land cover(MCD12Q1 & MCD12C1) product
[EB/OL].
FAO/UNEP土地覆被分类系统及其借鉴
[J].
FAO/UNEP-land cover classification system (LCCS) and use for reference
[J].
Report on the harmonization of global and regional land cover products
[R/OL].(2004-07-16)[2025-11-03].https://gofcgold.org/sites/default/files/docs/GOLD_20.pdf.
GLC2000:A new approach to global land cover mapping from Earth observation data
[J].DOI:10.1080/01431160412331291297 URL [本文引用: 3]
Production of global land cover data-GLCNMO
[J].DOI:10.1080/17538941003777521 URL [本文引用: 2]
Production of global land cover Data-GLCNMO2008
[J].
Production of global land cover data-GLCNMO2013
[J].
Land Cover CCI:Product user guide,version 2.0
[R/OL].(2017-04-10)[2025-11-03].https://maps.elie.ucl.ac.be/CCI/viewer/download/ESACCI-LC-Ph2-PUGv2_2.0.pdf.
Revisiting land cover observation to address the needs of the climate modeling community
[J].
DOI:10.5194/bg-9-2145-2012
URL
[本文引用: 3]
. Improving systematic observations of land cover, as an Essential Climate Variable, should contribute to a better understanding of the global climate system and thus improve our ability to predict climatic change. The aim of this paper is to bring global land cover observations closer to meeting the needs of climate science. First, consultation mechanisms were established with the climate modeling community to identify its specific requirements in terms of satellite-based global land cover products. This assessment highlighted specific needs in terms of land cover characterization, accuracy of products, as well as stability and consistency needs that are currently not met or even addressed. The current land cover representation and mapping techniques were then called into question to specifically focus on the critical need of stable products expressed by climate users. Decoupling the stable and dynamic components of the land cover characterization and using a multi-year dataset were proposed as two key approaches to allow generating consistent suites of global land cover products over time.
GLC_FCS30:Global land-cover product with fine classification system at 30 m using time-series Landsat imagery
[J].
DOI:10.5194/essd-13-2753-2021
[本文引用: 2]
Over past decades, a lot of global land-cover products have been released; however, these still lack a global land-cover map with a fine classification system and spatial resolution simultaneously. In this study, a novel global 30m land-cover classification with a fine classification system for the year 2015 (GLC_FCS30-2015) was produced by combining time series of Landsat imagery and high-quality training data from the GSPECLib (Global Spatial Temporal Spectra Library) on the Google Earth Engine computing platform. First, the global training data from the GSPECLib were developed by applying a series of rigorous filters to the CCI_LC (Climate Change Initiative Global Land Cover) land-cover and MCD43A4 NBAR products (MODIS Nadir Bidirectional Reflectance Distribution Function-Adjusted Reflectance). Secondly, a local adaptive random forest model was built for each 5 degrees x 5 degrees geographical tile by using the multi-temporal Landsat spectral and texture features and the corresponding training data, and the GLC_FCS30-2015 land-cover product containing 30 land-cover types was generated for each tile. Lastly, the GLC_FCS30-2015 was validated using three different validation systems (containing different land-cover details) using 44 043 validation samples. The validation results indicated that the GLC_FCS30-2015 achieved an overall accuracy of 82.5% and a kappa coefficient of 0.784 for the level-0 validation system (9 basic land-cover types), an overall accuracy of 71.4% and kappa coefficient of 0.686 for the UN-LCCS (United Nations Land Cover Classification System) level1 system (16 LCCS land-cover types), and an overall accuracy of 68.7% and kappa coefficient of 0.662 for the UN-LCCS level-2 system (24 fine land-cover types). The comparisons against other land-cover products (CCI_LC, MCD12Q1, FROM_GLC, and GlobeLand30) indicated that GLC_FCS30-2015 provides more spatial details than CCI_LC-2015 and MCD12Q1-2015 and a greater diversity of land-cover types than FROM_GLC-2015 and GlobeLand30-2010. They also showed that GLC_FCS30-2015 achieved the best overall accuracy of 82.5% against FROM_GLC-2015 of 59.1% and GlobeLand30-2010 of 75.9 %. Therefore, it is concluded that the GLC_FCS30-2015 product is the first global land-cover dataset that provides a fine classification system (containing 16 global LCCS land-cover types as well as 14 detailed and regional land-cover types) with high classification accuracy at 30 m. The GLC_FCS30-2015 global land-cover products produced in this paper are free access at https://doi.org/10.5281/zenodo.3986872 (Liu et al., 2020).
GLC_FCS30-2020:Global land cover with fine classification system at 30 m in 2020(v1.2)
[DB/OL].(
Production of global daily seamless data cubes and quantification of global land cover change from 1985 to 2020 - iMap World 1.0
[J].
ESA WorldCover 10 m 2020 v100
[DB/OL].(
Global Land Cover SHARE (GLC-SHARE) database:Beta-Release version 1.0-2014
[EB/OL].[
Building a hybrid land cover map with crowdsourcing and geographically weighted regression
[J].
Geo-Wiki.Org:The use of crowdsourcing to improve global land cover
[J].
DOI:10.3390/rs1030345
URL
Global land cover is one of the essential terrestrial baseline datasets available for ecosystem modeling, however uncertainty remains an issue. Tools such as Google Earth offer enormous potential for land cover validation. With an ever increasing amount of very fine spatial resolution images (up to 50 cm × 50 cm) available on Google Earth, it is becoming possible for every Internet user (including non remote sensing experts) to distinguish land cover features with a high degree of reliability. Such an approach is inexpensive and allows Internet users from any region of the world to get involved in this global validation exercise. The Geo-Wiki Project is a global network of volunteers who wish to help improve the quality of global land cover maps. Since large differences occur between existing global land cover maps, current ecosystem and land-use science lacks crucial accurate data (e.g., to determine the potential of additional agricultural land available to grow crops in Africa), volunteers are asked to review hotspot maps of global land cover disagreement and determine, based on what they actually see in Google Earth and their local knowledge, if the land cover maps are correct or incorrect. Their input is recorded in a database, along with uploaded photos, to be used in the future for the creation of a new and improved hybrid global land cover map.
Geo-Wiki:An online platform for improving global land cover
[J].
Open access to earth land-cover map
[J].
全球2000年—2015年30 m分辨率逐年土地覆盖制图
[J].
Mapping annual global land cover changes at a 30 m resolution from 2000 to 2015
[J].
Finer resolution observation and monitoring of global land cover:First mapping results with Landsat TM and ETM+ data
[J].DOI:10.1080/01431161.2012.748992 URL [本文引用: 4]
Stable classification with limited sample:Transferring a 30-m resolution sample set collected in 2015 to mapping 10-m resolution global land cover in 2017
[J].DOI:10.1016/j.scib.2019.03.002 URL [本文引用: 2]
Improving 30 m global land-cover map FROM-GLC with time series MODIS and auxiliary data sets:A segmentation-based approach
[J].DOI:10.1080/01431161.2013.798055 URL [本文引用: 1]
A multi-resolution global land cover dataset through multisource data aggregation
[J].DOI:10.1007/s11430-014-4919-z URL [本文引用: 1]
Annual dynamics of global land cover and its long-term changes from 1982 to 2015
[J].
DOI:10.5194/essd-12-1217-2020
URL
[本文引用: 1]
. Land cover is the physical material at the surface of the Earth. As the cause and result of global environmental change, land cover\nchange (LCC) influences the global energy balance and biogeochemical cycles.\nContinuous and dynamic monitoring of global LC is urgently needed. Effective\nmonitoring and comprehensive analysis of LCC at the global scale are rare.\nWith the latest version of GLASS (Global Land Surface Satellite) CDRs\n(climate data records) from 1982 to 2015, we built the first record of\n34-year-long annual dynamics of global land cover (GLASS-GLC) at 5 km\nresolution using the Google Earth Engine (GEE) platform. Compared to earlier\nglobal land cover (LC) products, GLASS-GLC is characterized by high consistency, more\ndetail, and longer temporal coverage. The average overall accuracy for the\n34 years each with seven classes, including cropland, forest, grassland,\nshrubland, tundra, barren land, and snow/ice, is 82.81 % based on 2431\ntest sample units. We implemented a systematic uncertainty analysis and\ncarried out a comprehensive spatiotemporal pattern analysis. Significant\nchanges at various scales were found, including barren land loss and\ncropland gain in the tropics, forest gain in the Northern Hemisphere, and\ngrassland loss in Asia. A global quantitative analysis of human factors\nshowed that the average human impact level in areas with significant LCC was\nabout 25.49 %. The anthropogenic influence has a strong correlation with\nthe noticeable vegetation gain, especially for forest. Based on GLASS-GLC,\nwe can conduct long-term LCC analysis, improve our understanding of global\nenvironmental change, and mitigate its negative impact. GLASS-GLC will be\nfurther applied in Earth system modeling to facilitate research on global\ncarbon and water cycling, vegetation dynamics, and climate change. The\nGLASS-GLC data set presented in this article is available at\nhttps://doi.org/10.1594/PANGAEA.913496 (Liu et al., 2020).
Global land use/land cover with Sentinel 2 and deep learning
[C]//
Dynamic World,Near real-time global 10 m land use land cover mapping
[J].
Improving 3-m resolution land cover mapping through efficient learning from an imperfect 10-m resolution map
[J].
DOI:10.3390/rs12091418
URL
[本文引用: 1]
Substantial progress has been made in the field of large-area land cover mapping as the spatial resolution of remotely sensed data increases. However, a significant amount of human power is still required to label images for training and testing purposes, especially in high-resolution (e.g., 3-m) land cover mapping. In this research, we propose a solution that can produce 3-m resolution land cover maps on a national scale without human efforts being involved. First, using the public 10-m resolution land cover maps as an imperfect training dataset, we propose a deep learning based approach that can effectively transfer the existing knowledge. Then, we improve the efficiency of our method through a network pruning process for national-scale land cover mapping. Our proposed method can take the state-of-the-art 10-m resolution land cover maps (with an accuracy of 81.24% for China) as the training data, enable a transferred learning process that can produce 3-m resolution land cover maps, and further improve the overall accuracy (OA) to 86.34% for China. We present detailed results obtained over three mega cities in China, to demonstrate the effectiveness of our proposed approach for 3-m resolution large-area land cover mapping.
SinoLC-1:The first 1-meter resolution national-scale land-cover map of China created with a deep learning framework and open-access data
[J].
DOI:10.5194/essd-15-4749-2023
URL
[本文引用: 1]
. In China, the demand for a more precise perception of the national land surface has become most urgent given the pace of development and urbanization. Constructing a very-high-resolution (VHR) land-cover dataset for China with national coverage, however, is a nontrivial task. Thus, this has become an active area of research that is impeded by the challenges of image acquisition, manual annotation, and computational complexity. To fill this gap, the first 1 m resolution national-scale land-cover map of China, SinoLC-1, was established using a deep-learning-based framework and open-access data, including global land-cover (GLC) products, OpenStreetMap (OSM), and Google Earth imagery. Reliable training labels were generated by combining three 10 m GLC products and OSM data. These training labels and 1 m resolution images derived from Google Earth were used to train the proposed framework. This framework resolved the label noise stemming from a resolution mismatch between images and labels by combining a resolution-preserving backbone, a weakly supervised module, and a self-supervised loss function, to refine the VHR land-cover results automatically without any manual annotation requirement. Based on large-storage and computing servers, processing the 73.25 TB dataset to obtain the SinoLC-1 covering the entirety of China, ∼ 9 600 000 km2, took about 10 months. The SinoLC-1 product was validated using a visually interpreted validation set including over 100 000 random samples and a statistical validation set collected from the official land survey report provided by the Chinese government. The validation results showed that SinoLC-1 achieved an overall accuracy of 73.61 % and a κ coefficient of 0.6595. Validations for every provincial region further indicated the accuracy of this dataset across the whole of China. Furthermore, the statistical validation results indicated that SinoLC-1 conformed to the official survey reports with an overall misestimation rate of 6.4 %. In addition, SinoLC-1 was compared with five other widely used GLC products. These results indicated that SinoLC-1 had the highest spatial resolution and the finest landscape details. In conclusion, as the first 1 m resolution national-scale land-cover map of China, SinoLC-1 delivered accuracy and provided primal support for related research and applications throughout China. The SinoLC-1 land-cover product is freely accessible at https://doi.org/10.5281/zenodo.7707461 (Li et al., 2023).
UrbanWatch:A 1-meter resolution land cover and land use database for 22 major cities in the United States
[J].
UGS-1m:Fine-grained urban green space mapping of 31 major cities in China based on the deep learning framework
[J].
DOI:10.5194/essd-15-555-2023
URL
[本文引用: 2]
. Urban green space (UGS) is an important component in the urban ecosystem and has great significance to the urban ecological environment. Although the development of remote sensing platforms and deep learning technologies have provided opportunities for UGS mapping from high-resolution images (HRIs), challenges still exist in its large-scale and fine-grained application due to insufficient annotated datasets and specially designed methods for UGS. Moreover, the domain shift between images from different regions is also a problem that must be solved. To address these issues, a general deep learning (DL) framework is proposed for UGS mapping in the large scale, and fine-grained UGS maps of 31 major cities in mainland China are generated (UGS-1m). The DL framework consists of a generator and a discriminator. The generator is a fully convolutional network designed for UGS extraction (UGSNet), which integrates attention mechanisms to improve the discrimination to UGS, and employs a point-rending strategy for edge recovery. The discriminator is a fully connected network aiming to deal with the domain shift between images. To support the model training, an urban green space dataset (UGSet) with a total number of 4544 samples of 512×512 in size is provided. The main steps to obtain UGS-1m can be summarized as follows: (a) first, the UGSNet will be pre-trained on the UGSet in order to obtain a good starting training point for the generator. (b) After pre-training on the UGSet, the discriminator is responsible for adapting the pre-trained UGSNet to different cities through adversarial training. (c) Finally, the UGS results of 31 major cities in China (UGS-1m) are obtained using 2179 Google Earth images with a data frame of 7′30′′ in longitude and 5′00′′ in latitude and a spatial resolution of nearly 1.1 m. An evaluation of the performance of the proposed framework by samples from five different cities shows the validity of the UGS-1m products, with an average overall accuracy (OA) of 87.56 % and an F1 score of 74.86 %. Comparative experiments on UGSet with the existing state-of-the-art (SOTA) DL models proves the effectiveness of UGSNet as the generator, with the highest F1 score of 77.30 %. Furthermore, an ablation study on the discriminator fully reveals the necessity and effectiveness of introducing the discriminator into adversarial learning for domain adaptation. Finally, a comparison with existing products further shows the feasibility of the UGS-1m and the great potential of the proposed DL framework. The UGS-1m can be downloaded from https://doi.org/10.57760/sciencedb.07049 (Shi et al., 2023).
An unexpectedly large count of trees in the West African Sahara and Sahel
[J].DOI:10.1038/s41586-020-2824-5 [本文引用: 1]
