

0 引言
Ramsar公约,又称湿地公约,是最早的多边环境协议之一[2],旨在通过地方和国家行动以及国际合作,保护和合理利用所有湿地,为实现全世界的可持续发展做出贡献[13]。至今,Ramsar公约已有172个缔约方,登记了2 471处国际重要湿地,总面积达到256 192 356 hm2,大于全球13%的湿地面积[14]。但是自公约签署以来,全球仍有约35%的湿地发生退化或损失[14-15],湿地的生态特征也普遍呈现出退化的趋势[16-17]。其原因在于公约主要关注湿地站点数量的持续增加,而各缔约方对湿地及其生态特征的有效监测、管理和报告并未得到充分的执行[16,18]。因此,为了更好地监督国家和地方履行Ramsar公约,督促其及时且有效地管理国际重要湿地,对国际湿地进行实时、准确的动态监测至关重要[13]。
随着遥感科学技术和计算机科学技术的发展,基于遥感影像进行地表覆盖制图已经成为了实现低成本、大范围、高动态监测湿地的手段。当前已有数量众多的地表覆盖制图产品,包括全球地表覆盖制图产品[19
但总体而言,不同的制图产品之间在时空分辨率、时空范围、分类体系和质量上可能存在较大的差异,现今没有在各个维度上都表现最好的制图产品,另一方面,因为湿地类别复杂,景观异质性较强[47],分类难度较高,地表覆盖产品在湿地分类精度上普遍比较低[21
1 研究区域概况与数据源
1.1 研究区域概况
中国共有64处国际重要湿地,其中有40处可在Ramsar公约的官网(
1.2 数据源及其预处理
1.2.1 Ramsar湿地边界
Ramsar公约官网上提供了全球2 471处国际重要湿地站点的元数据和其中的1 225处湿地的边界矢量数据,其中元数据包含站点的地理位置、所属国家或地区、湿地的类型、湿地提供的生态系统服务等信息。使用ArcMap软件,对湿地边界矢量数据按湿地编号进行消融,再按编号与元数据进行匹配,筛选出中国区域内的湿地,整合成新的湿地边界矢量数据。考虑到湿地保护区可能在政府治理下恢复从而面积扩张的情况,参考Mao等[46]的研究,本文对边界数据作10 km的缓冲带。
1.2.2 长时序地表覆盖制图
考虑到湿地变化的监测依赖长时序的制图产品,本文选择使用MCD12Q1[19],CCI_LC[20]和CGLS_LC[21] 3套使用较广泛的开放的长时序地表覆盖制图产品开展一致性比较。产品的基本属性如表1所示,其中UA为使用者精度,PA为生产者精度。MCD12Q1是美国国家航空航天局(National Aeronautics and Space Administration,NASA)基于MODIS研发的长时序全球地表覆盖产品,具有8套分类体系,总体分类精度达73.6%; CCI_LC是欧空局(European Space Agency,ESA)基于多源遥感时序数据研制的包含22个类别的制图产品,精度达到71.1%; CGLS_LC是哥白尼组织基于100 m分辨率的PROBA-V(Project for On-Board Autonomy-Vegetation)卫星时序数据经机器学习算法研制的包含23个类别的全球地表覆盖制图,总体分类精度达80%。3套数据集重叠的时间范围为2015—2019年,分辨率在100~500 m,在分类体系上,CGLS_LC中的草本植被包括草本、木本植物,MCD12Q1的LC_Type3分类体系划分出了草本湿地和木本湿地2类湿地,CCI_LC则更进一步分类了2种木本湿地。
表1 3种地表覆盖制图产品的特性
Tab.1
| 数据集 | 湿地/水体 分类体系 | 数据源 | 时间范围 | 空间分辨率/m | 准确度评估 |
|---|---|---|---|---|---|
| MCD12Q1[19] | LC_Type1(11:永久湿地); LC_Type3(3:水体; 27:木本湿地; 50:草本湿地) | MODIS | 2001—2020年 | 500 | LC_Type1 11 (UA: 96.4%; PA: 70.6%) |
| CCI_LC[20] | 160:被淡水或微咸水淹没的树; 170:被咸水淹没的树; 180:被咸水、微咸水、淡水淹没的灌木或草本植被; 210:水体 | MERIS, SPOT, PROBA | 1992—2020年 | 300 | 160 (UA: 26%; PA: 86%) 170 (UA: 75%; PA: 86%) 180 (UA: 53%; PA: 24%) |
| CGLS_LC[21] | 80:永久水体; 90:草本植被 | PROBA-V | 2015—2019年 | 100 | 90 (UA: 44.9%; PA: 46.9%) |
3套地表覆盖制图产品在空间和类别属性上存在较大差异,因此本文参考遥感产品真实性检验导则[50]和土地覆被遥感真实性检验国家标准[51]中交叉检验的步骤,利用Python的地理栅格数据处理库 rasterio(
图1
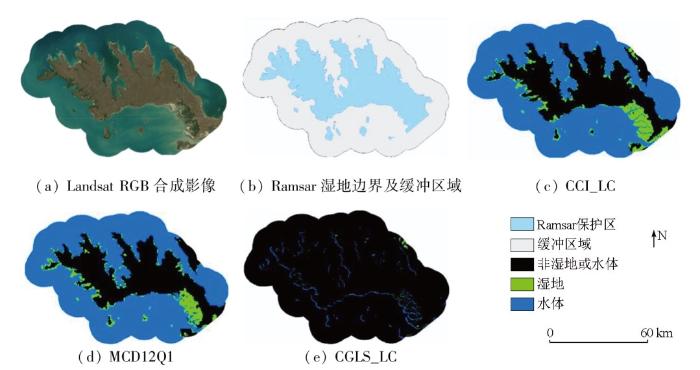
图1
预处理后的时空属性、分类体系的制图数据示意图
Fig.1
Schematic diagram of the preprocessed mapping data with the same spatio-temporal characteristics and category system
2 研究方法
本文主要以制图产品的湿地分类面积和制图产品间湿地分类的准确度来评估空间一致性。假设共有L处国际重要湿地,评估的2个产品分别记为Pm和Pn,对于第i处(i=1,2,…,L)国际重要湿地,2个产品在国际重要湿地上的逐年湿地分类面积分别为
2.1 面积回归分析
考虑到数值和结果的稳定性,本文选用面积的对数进行线性回归拟合,即使用最小二乘法求解下面模型中的参数
式中
在线性回归的基础上,进一步计算均方根误差(root of mean square error,RMSE)、相关系数r和决定系数R2,作为定量评估面积一致性的指标。
2.2 准确度指标和不确定度指标计算
3 结果与分析
3.1 分类面积回归分析
产品间湿地分类面积的回归分析结果如图2所示,3套长时序制图产品都在部分国际重要湿地上未能分类出湿地,导致这些区域的湿地分类面积为0,对数变换后数值也为0(即图中靠近横坐标轴或纵坐标轴的样本),原因可能是产品分类错误或是产品分类体系定义的湿地与该国际重要湿地所认定的湿地类别不一致。
图2
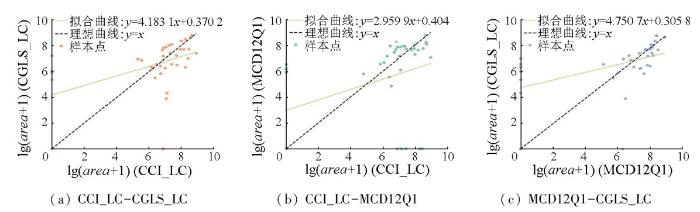
图2
产品间的湿地分类面积的回归曲线拟合结果
Fig.2
Fitting results of regression curve between classification area of wetlands from different products
由于未分类出湿地的区域的面积数值可能对拟合得到的参数产生较大影响,进而影响指标的计算,本文尝试剔除未分类出湿地的区域后再进行回归分析,结果如图3所示。由拟合曲线的斜率和截距可知,CCI_LC分类出的湿地面积相对于其他2个产品都比较大,而MCD12Q1相对于CGLS_LC在斜率上相当接近,但截距接近1,故估算的湿地面积也偏大。总体而言,大部分的区域的湿地分类面积分布在直线x=y距离为1的区域内,即产品间湿地分类面积数值差别大约为10倍。由表2可知各产品湿地分类面积的RMSE为0.8~1,即面积相差6~10倍,因此总体而言面积存在比较大的不一致性。RMSE和r最优的一对产品是MCD12Q1和CGLS_LS,R2最高的一对产品为CCI_LC和MCD12Q1。
图3
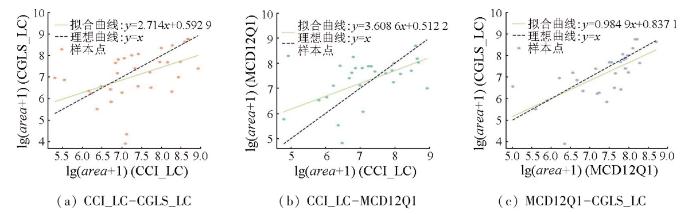
图3
剔除未分类出湿地的区域后产品间的湿地分类面积的回归分析结果
Fig.3
Regression result between classification area of wetlands from different products after removing unclassified wetland areas
表2 剔除未分类出湿地的区域后产品间回归分析的评估结果
Tab.2
| 产品 | RMSE | r | R2 |
|---|---|---|---|
| CCI_LC-CGLS_LC | 1.109 7 | 0.476 5 | -0.457 6 |
| CCI_LC-MCD12Q1 | 0.872 4 | 0.571 2 | 0.214 3 |
| MCD12Q1-CGLS_LC | 0.821 1 | 0.679 8 | 0.097 6 |
3.2 准确度与不确定度指标评估
3套产品两两之间的湿地分类的准确度指标PA,UA和Kappa系数的分布如图4所示。对于CCI_LC和CGLS_LC,有50%的区域的湿地分类结果的PA和UA接近0,只有少于10%的区域的湿地分类结果的UA和PA能够大于0.6,约70%的区域的湿地分类结果的Kappa系数小于0.1。对于CCI_LC和MCD12Q1,PA的分布情况相对于前者比较好,但大部分区域的分类结果的UA分布在0.4以下。对于MCD12Q1和CGLS-LC,准确度的指标相比于前两者会更高一点,大于30%的区域湿地分类结果的PA大于0.35、UA大于0.25、Kappa系数大于0.2。
图4
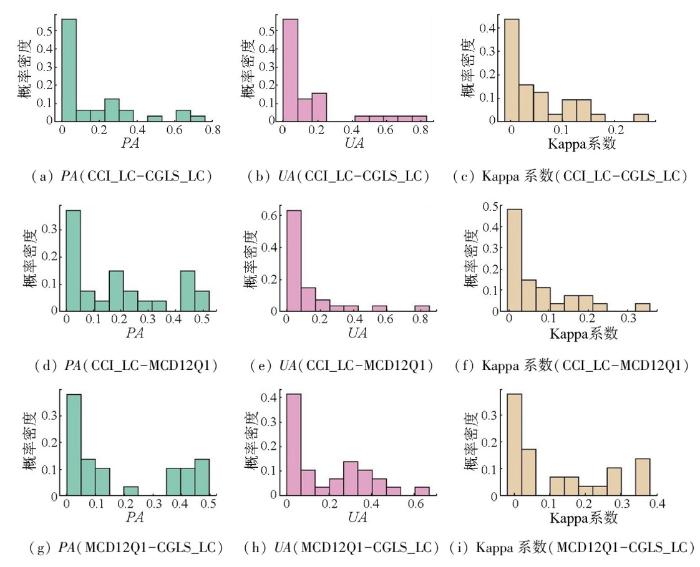
图4
产品间的湿地分类准确度指标分布直方图
Fig.4
Histogram of the distribution of wetland classification accuracy metrics among products
产品间湿地分类结果准确度的均值与标准差见表3。对于约20%~32.5%的国际重要湿地,产品对中两类产品均未能分类出湿地。例如,对于MODIS产品,至少未能在27.5%的Ramsar湿地中分类出湿地类别。这种情况下无法在产品间计算准确度指标,需要将未分类出湿地的样本剔除。MCD12Q1和CGLS_LC的UA和Kappa系数的均值最高,CCI_LC和MCD12Q1的PA的均值最高,这与3.1的分析结果一致。但总体而言,产品之间湿地分类结果的准确度都很低,且准确度指标的不确定度很大。除了MCD12Q1和CGLS_LC的UA和CCI_LC和MCD12Q1的PA指标,其他产品之间准确度指标的标准差均大于均值。
表3 产品间准确度与不确定度指标结果
Tab.3
| 产品 | 未分类出湿 地的样本数 | 未分类出湿地 的样本的占比/% | UA | PA | Kappa系数 | |||
|---|---|---|---|---|---|---|---|---|
| 均值 | 标准差 | 均值 | 标准差 | 均值 | 标准差 | |||
| CCI_LC-CGLS_LC | 8 | 20.0 | 0.158 6 | 0.230 3 | 0.156 1 | 0.217 1 | 0.051 9 | 0.665 0 |
| CCI_LC-MCD12Q1 | 13 | 32.5 | 0.130 6 | 0.202 5 | 0.192 5 | 0.130 6 | 0.074 1 | 0.091 1 |
| MCD12Q1-CGLS_LC | 11 | 27.5 | 0.190 1 | 0.186 7 | 0.182 9 | 0.195 9 | 0.121 5 | 0.138 0 |
4 讨论与结论
地表覆盖制图产品对于监测湿地变化、监督Ramsar公约缔约方履行公约至关重要,但当前制图产品数量众多,在时空特性、分类体系和质量上存在较大差异,且当前尚未有对长时序地表覆盖产品的湿地分类开展系统的一致性评估的研究。本文对中国区域40处国际重要湿地在3套长时序地表覆盖制图产品CCI_LC,MCD12Q1和CGLS_LC的湿地分类上开展系统的一致性评估,包括基于湿地分类面积的回归分析以及基于湿地分类结果的UA,PA和Kappa系数3个指标的准确度评估和不确定度分析,得到的相关结论如下:
1)3套地表覆盖产品间的湿地分类面积存在较大的不一致性,对于大于20%国际重要湿地区域,3个产品未能够分类出湿地,湿地分类面积差距较大,平均在6~10倍。
2)3套地表覆盖产品湿地分类结果的准确度很低,对于大多数的国际重要湿地区域,产品之间的UA,PA和Kappa系数小于0.1,且准确度的标准差很大,不确定度高,大部分产品的准确度的标准差大于均值。
总体而言,本文中的3套地表覆盖产品不能支撑比较可信的国际重要湿地变化的监测工作,用户在选择制图数据产品时不能仅考虑产品的自检精度,还需要参考其他研究关于该产品在湿地区域上的验证结果,比如MCD12Q1的UA和PA分别为0.96和0.70,但本文3.2节部分的结果说明在大于27.5%的Ramsar保护区内,MCD12Q1未能分类湿地。因此,建设开放共享的全球湿地样本库尤为重要,需要联合更多比如Murray等的公开的全球滨海湿地样本的数据库,这将能够为所有的制图产品提供公共的基于真值检验的基准。从湿地制图产品研发的角度上来说,为督促各缔约方对国际重要湿地保护区履行公约,做到切实有效保护湿地,还需要集结比如GEO Wetland Initiative的专家团队,研发支持Ramsar公约政策建议的制图产品。
本文在空间范围和产品数量上还存在不足,未来的研究可以尝试拓展到全球的国际重要湿地,开展大洲之间的评估结果的对比分析; 在分析的产品方面,本文选用了长时序粗分辨率地表覆盖产品,但未考虑区域尺度的湿地类别精细的产品,如CLC或中分辨率的全球湿地专题制图产品GWL_FCS30等,这些产品类别更精细,精度更高,在单个年份或局部区域的情景下有较大的研究价值。此外,制图产品中未分类出湿地的区域也值得详细研究,可能是异质性较强的重要湿地,可以帮助完善湿地分类算法的研究。
参考文献
The Ramsar Convention Manual:A guide to the Convention on Wetlands (Ramsar,Iran,1971),6th ed
[R].
The Fourth Ramsar Strategic Plan 2016—2024
[R]//
Global Wetland Outlook:Special Edition 2021
[R].
Conversions between natural wetlands and farmland in China:A multiscale geospatial analysis
[J].
Global wetlands:Potential distribution,wetland loss,and status
[J].
China’s wetlands loss to urban expansion
[J].DOI:10.1002/ldr.v29.8 URL [本文引用: 1]
Urban development versus wetland loss in a coastal Latin American city:Lessons for sustainable land use planning
[J].
Reverse the hidden loss of China’s wetlands
[J].
Wetland changes in the Amur River Basin:Differing trends and proximate causes on the Chinese and Russian sides
[J].
Future impacts of climate change on inland Ramsar wetlands
[J].DOI:10.1038/s41558-020-00942-2 [本文引用: 1]
How much wetland has the world lost? Long-term and recent trends in global wetland area
[J].
DOI:10.1071/MF14173
URL
[本文引用: 1]

It has been frequently stated, but without provision of supporting evidence, that the world has lost 50% of its wetlands (or 50% since 1900 AD). This review of 189 reports of change in wetland area finds that the reported long-term loss of natural wetlands averages between 54–57% but loss may have been as high as 87% since 1700 AD. There has been a much (3.7 times) faster rate of wetland loss during the 20th and early 21st centuries, with a loss of 64–71% of wetlands since 1900 AD. Losses have been larger and faster for inland than coastal natural wetlands. Although the rate of wetland loss in Europe has slowed, and in North America has remained low since the 1980s, the rate has remained high in Asia, where large-scale and rapid conversion of coastal and inland natural wetlands is continuing. It is unclear whether the investment by national governments in the Ramsar Convention on Wetlands has influenced these rates of loss. There is a need to improve the knowledge of change in wetland areas worldwide, particularly for Africa, the Neotropics and Oceania, and to improve the consistency of data on change in wetland areas in published papers and reports.
Putting China’s wetlands on the map
[J].
Ramsar wetlands of international importance-improving conservation outcomes
[J].
Global Wetland Outlook:State of the World’s Wetlands and Their Services to People
[R].
The Ramsar convention on wetlands at 50
[J].
Trends in the ecological character of the world’s wetlands
[J].
DOI:10.1071/MF18329
URL
[本文引用: 2]
We assessed trends in the ecological character of wetlands generally and of Ramsar Sites reported in 2011, 2014 and 2017 by the Contracting Parties to the Ramsar Convention on Wetlands in their national reports. There was more widespread deterioration than improvement in the ecological character of wetlands generally, with deterioration increasingly more widespread between 2011 and 2017. The ecological-character trends in Ramsar Sites were significantly better than those of wetlands generally, but an increasingly more widespread deterioration of ecological character was reported between 2011 and 2017. Trends in the ecological character of wetlands generally, and of Ramsar Sites were worst in Africa and Latin America and the Caribbean, and recently also in Oceania, and better in North America and Europe. Deterioration in the ecological character of Ramsar Site was more widespread in countries with a large average area of their Ramsar Sites. This information on trends of wetland ecological character can contribute to assessing the achievement of the 2030 Sustainable Development Goal Target 6.6 and Aichi Biodiversity Target 5. Our analysis indicated that the 1971 aim of the Ramsar Convention to stem the degradation of wetlands has not yet been achieved.
A review of the adequacy of reporting to the Ramsar Convention on change in the ecological character of wetlands
[J].
DOI:10.1071/MF18328
URL
[本文引用: 1]
We review the mechanisms established by the Ramsar Convention for reporting on the status and change in the ecological character of wetlands. We assess the extent of their implementation and compliance, but not issues of the adequacy of their design nor the consequences of their extent of implementation. We conclude that, with the exception of qualitative national-scale reporting in triennial Contracting Party National Reports, there is inadequate implementation and compliance with most of these mechanisms, notably concerning required reporting under Article 3.2 of the Convention and the updating of the Information Sheet on Ramsar Wetlands (RIS). This limits the ability of the Convention to assess the status, and trends in status, of designated Wetlands of International Importance (Ramsar Sites), and to inform future decision-making and priority-setting for the wise use of all wetlands. As has been recognised by the Ramsar Convention, unless compliance with these mechanisms is improved, sufficient information will not be gathered through the mechanisms of Ramsar Convention to assess fully the Sustainable Development Goal 6.6.1 indicator supported by the Convention on change in the extent of water-related ecosystems over time.
Valuing wetlands
[J/OL].
MODIS Collection 5 global land cover:Algorithm refinements and characterization of new datasets
[J].DOI:10.1016/j.rse.2009.08.016 URL [本文引用: 4]
Land Cover CCI Product User Guide Version 2.0
[EB/OL].
Copernicus Global Land Service:Land Cover 100 m:Version 3 Globe 2015—2019:Algorithm Theoretical Basis Document
[R/OL].
Finer resolution observation and monitoring of global land cover:First mapping results with Landsat TM and ETM+ data
[J].DOI:10.1080/01431161.2012.748992 URL
GLC_FCS30:Global land-cover product with fine classification system at 30 m using time-series Landsat imagery
[J].Over past decades, a lot of global land-cover products have been released; however, these still lack a global land-cover map with a fine classification system and spatial resolution simultaneously. In this study, a novel global 30m land-cover classification with a fine classification system for the year 2015 (GLC_FCS30-2015) was produced by combining time series of Landsat imagery and high-quality training data from the GSPECLib (Global Spatial Temporal Spectra Library) on the Google Earth Engine computing platform. First, the global training data from the GSPECLib were developed by applying a series of rigorous filters to the CCI_LC (Climate Change Initiative Global Land Cover) land-cover and MCD43A4 NBAR products (MODIS Nadir Bidirectional Reflectance Distribution Function-Adjusted Reflectance). Secondly, a local adaptive random forest model was built for each 5 degrees x 5 degrees geographical tile by using the multi-temporal Landsat spectral and texture features and the corresponding training data, and the GLC_FCS30-2015 land-cover product containing 30 land-cover types was generated for each tile. Lastly, the GLC_FCS30-2015 was validated using three different validation systems (containing different land-cover details) using 44 043 validation samples. The validation results indicated that the GLC_FCS30-2015 achieved an overall accuracy of 82.5% and a kappa coefficient of 0.784 for the level-0 validation system (9 basic land-cover types), an overall accuracy of 71.4% and kappa coefficient of 0.686 for the UN-LCCS (United Nations Land Cover Classification System) level1 system (16 LCCS land-cover types), and an overall accuracy of 68.7% and kappa coefficient of 0.662 for the UN-LCCS level-2 system (24 fine land-cover types). The comparisons against other land-cover products (CCI_LC, MCD12Q1, FROM_GLC, and GlobeLand30) indicated that GLC_FCS30-2015 provides more spatial details than CCI_LC-2015 and MCD12Q1-2015 and a greater diversity of land-cover types than FROM_GLC-2015 and GlobeLand30-2010. They also showed that GLC_FCS30-2015 achieved the best overall accuracy of 82.5% against FROM_GLC-2015 of 59.1% and GlobeLand30-2010 of 75.9 %. Therefore, it is concluded that the GLC_FCS30-2015 product is the first global land-cover dataset that provides a fine classification system (containing 16 global LCCS land-cover types as well as 14 detailed and regional land-cover types) with high classification accuracy at 30 m. The GLC_FCS30-2015 global land-cover products produced in this paper are free access at https://doi.org/10.5281/zenodo.3986872 (Liu et al., 2020).
Global land cover mapping at 30 m resolution:A POK-based operational approach
[J].
Production of global daily seamless data cubes and quantification of global land cover change from 1985 to 2020 - iMap World 1.0
[J].
Stable classification with limited sample:Transferring a 30-m resolution sample set collected in 2015 to mapping 10-m resolution global land cover in 2017
[J].DOI:10.1016/j.scib.2019.03.002 URL
ESA WorldCover 10 m 2020 v100
[R/OL].
Dynamic World,Near real-time global 10 m land use land cover mapping
[J].
GWL_FCS30:A global 30 m wetland map with a fine classification system using multi-sourced and time-series remote sensing imagery in 2020
[J].
The global distribution and trajectory of tidal flats
[J].
The global mangrove watch:A new 2010 global baseline of mangrove extent
[J].This study presents a new global baseline of mangrove extent for 2010 and has been released as the first output of the Global Mangrove Watch (GMW) initiative. This is the first study to apply a globally consistent and automated method for mapping mangroves, identifying a global extent of 137,600 km 2. The overall accuracy for mangrove extent was 94.0% with a 99% likelihood that the true value is between 93.6–94.5%, using 53,878 accuracy points across 20 sites distributed globally. Using the geographic regions of the Ramsar Convention on Wetlands, Asia has the highest proportion of mangroves with 38.7% of the global total, while Latin America and the Caribbean have 20.3%, Africa has 20.0%, Oceania has 11.9%, North America has 8.4% and the European Overseas Territories have 0.7%. The methodology developed is primarily based on the classification of ALOS PALSAR and Landsat sensor data, where a habitat mask was first generated, within which the classification of mangrove was undertaken using the Extremely Randomized Trees classifier. This new globally consistent baseline will also form the basis of a mangrove monitoring system using JAXA JERS-1 SAR, ALOS PALSAR and ALOS-2 PALSAR-2 radar data to assess mangrove change from 1996 to the present. However, when using the product, users should note that a minimum mapping unit of 1 ha is recommended and that the error increases in regions of disturbance and where narrow strips or smaller fragmented areas of mangroves are present. Artefacts due to cloud cover and the Landsat-7 SLC-off error are also present in some areas, particularly regions of West Africa due to the lack of Landsat-5 data and persistence cloud cover. In the future, consideration will be given to the production of a new global baseline based on 10 m Sentinel-2 composites.
High-resolution mapping of global surface water and its long-term changes
[J].
Development and validation of a global database of lakes,reservoirs and wetlands
[J].DOI:10.1016/j.jhydrol.2004.03.028 URL
A global map of saltmarshes
[J].
Global wetland datasets:A review
[J].DOI:10.1007/s13157-017-0927-z URL
High-resolution mapping of losses and gains of Earth’s tidal wetlands
[J].
DOI:10.1126/science.abm9583
URL
[本文引用: 1]
\n Tidal wetlands are expected to respond dynamically to global environmental change, but the extent to which wetland losses have been offset by gains remains poorly understood. We developed a global analysis of satellite data to simultaneously monitor change in three highly interconnected intertidal ecosystem types—tidal flats, tidal marshes, and mangroves—from 1999 to 2019. Globally, 13,700 square kilometers of tidal wetlands have been lost, but these have been substantially offset by gains of 9700 km\n 2\n, leading to a net change of −4000 km\n 2\n over two decades. We found that 27% of these losses and gains were associated with direct human activities such as conversion to agriculture and restoration of lost wetlands. All other changes were attributed to indirect drivers, including the effects of coastal processes and climate change.\n
National wetland mapping in China:A new product resulting from object-based and hierarchical classification of Landsat 8 OLI images
[J].
Geographical characteristics of China’s wetlands derived from remotely sensed data
[J].
Continental-scale wetland mapping:A novel algorithm for detailed wetland types classification based on time series Sentinel-1/2 images
[J].
Sub-continental-scale mapping of tidal wetland composition for East Asia:A novel algorithm integrating satellite tide-level and phenological features
[J].
A new generation of the United States National Land Cover Database:Requirements,research priorities,design,and implementation strategies
[J].
China’s wetland change (1990—2000) determined by remote sensing
[J].DOI:10.1007/s11430-010-4002-3 URL [本文引用: 1]
大型国际重要湿地边界及遥感分类数据集(2001、2013)
[J].
The boundaries and remote sensing classification datasets on large wetlands of international importance in 2001 and 2013
[J].
Wetlands classification and assessment of Ramsar sites in China based on time series Moderate Resolution Imaging Spectroradiometer (MODIS) imagery
[J].
Remote observations in China’s Ramsar sites:Wetland dynamics,anthropogenic threats,and implications for sustainable development goals
[J].
The challenges of remote monitoring of wetlands
[J].
DOI:10.3390/rs70810938
URL
[本文引用: 1]
Wetlands are highly productive and support a wide variety of ecosystem goods and services. Various forms of global change impose compelling needs for timely and reliable information on the status of wetlands worldwide, but several characteristics of wetlands make them challenging to monitor remotely: they lack a single, unifying land-cover feature; they tend to be highly dynamic and their energy signatures are constantly changing; and steep environmental gradients in and around wetlands produce narrow ecotones that often are below the resolving capacity of remote sensors. These challenges and needs set the context for a special issue focused on wetland remote sensing. Contributed papers responded to one of three overarching questions aimed at improving remote, large-area monitoring of wetlands: (1) What approaches and data products are being developed specifically to support regional to global long-term monitoring of wetland landscapes? (2) What are the promising new technologies and sensor/multisensor approaches for more accurate and consistent detection of wetlands? (3) Are there studies that demonstrate how remote long-term monitoring of wetland landscapes can reveal changes that correspond with changes in land cover and land use and/or changes in climate?
Finer-resolution mapping of global land cover:Recent developments,consistency analysis,and prospects
[J].
Consistency analysis and accuracy assessment of three global 30-m land-cover products over the European Union using the LUCAS dataset
[J].
DOI:10.3390/rs12213479
URL
[本文引用: 1]
Land-cover plays an important role in the Earth’s energy balance, the hydrological cycle, and the carbon cycle. Therefore, it is important to evaluate the current global land-cover (GLC) products and to understand the differences between these products so that they can be used effectively in different applications. In this study, three 30-m GLC products, namely GlobeLand30-2010, GLC_FCS30-2015, and FROM_GLC30-2015, were evaluated in terms of areal consistency and spatial consistency using the Land Use/Cover Area frame statistical Survey (LUCAS) reference dataset over the European Union (EU). Given the limitations of the traditional confusion matrix used in accuracy assessment, we adjusted the confusion matrices from sample counts by accounting for the class proportions of the map and reported the standard errors of the descriptive accuracy measures in the accuracy assessment. The results revealed the following. (1) The overall accuracy of the GlobeLand30-2010 product was the highest at 88.90 ± 0.68%; this was followed by GLC_FCS30-2015 (84.33 ± 0.80%) and FROM_GLC2015 (65.31 ± 1.0%). (2) The consistency between the GLC_FCS30-2015 and GlobeLand30-2010 is higher than the consistency between other products, with an area correlation coefficient of 0.930 and a proportion of consistent pixels of 52.41%, respectively. (3) Across the area of the EU, the dominant land-cover types such as forest and cropland are the most consistent across the three products, whereas the spatial consistency for bare land, grassland, shrubland, and wetland is relatively low. (4) The proportion of pixels for which the consistency is low accounts for less than 16.17% of pixels, whereas the proportion of pixels for which the consistency is high accounts for about 39.12%. The disagreement between these products primarily occurs in transitional zones with mixed land cover types or in mountain areas. Overall, the GlobeLand30 and GLC-FCS30 products were found to be the most consistent and to have good classification accuracy in the EU, with the disagreement between the three 30-m GLC products mainly occurring in heterogeneous regions.
