Please wait a minute...
 
自然资源遥感  2022, Vol. 34 Issue (2): 251-260    DOI: 10.6046/zrzyyg.2021205
  技术应用 本期目录 | 过刊浏览 | 高级检索 |
基于多时相Sentinel-1A的沼泽湿地水面时空动态变化监测
韦嫦(), 付波霖(), 覃娇玲, 王雅南, 陈智瀚, 刘兵
桂林理工大学测绘地理信息学院,桂林 541000
Monitoring of spatial-temporal dynamic changes in water surface in marshes based on multi-temporal Sentinel-1A data
WEI Chang(), FU Bolin(), QIN Jiaoling, WANG Yanan, CHEN Zhihan, LIU Bing
College of Geomatics and Geoinformation, Guilin University of Technology, Guilin 541000, China
全文: PDF(5944 KB)   HTML  
输出: BibTeX | EndNote (RIS)      
摘要 

水是形成和维系湿地生态系统的重要因子,监测湿地水面积变化对湿地保护研究具有重要意义。以2018—2019年逐月的Sentinel-1A卫星数据为数据源,计算扎龙湿地年内和年际的合成孔径雷达(synthetic aperture Radar,SAR)后向散射系数(σ0)和相干系数(μ0)影像,根据彩色光学影像水体贴近程度赋予权重并构建提取湿地水面σ0μ0的加权影像,通过阈值分割法、随机森林算法提取湿地水体,实现湿地水域面积的动态变化监测,探究湿地水域年内和年际变化规律。结果表明: 基于随机森林算法的水体提取精度最高,代表月份平均差值绝对值为6.69 km2,基于μ0影像使用阈值分割方法的分类精度最低,平均差值绝对值为13.07 km2; 整体趋势上,扎龙湿地水域面积年内有明显的季节性变化,春末夏初时水域面积在1 300~1 600 km2浮动,夏末秋始时水域面积在700~900 km2浮动; 年际水域面积会随着气候、温度等条件差异有不同变化,2019年10月、11月因降水量大湿地水域面积比2018年多出约1 050 km2,基于有效数据计算,总体上2019年比2018年水域面积多出约550 km2

服务
把本文推荐给朋友
加入引用管理器
E-mail Alert
RSS
作者相关文章
韦嫦
付波霖
覃娇玲
王雅南
陈智瀚
刘兵
关键词 湿地水面年内年际变化Sentinel-1A后向散射系数相干系数阈值分割    
Abstract

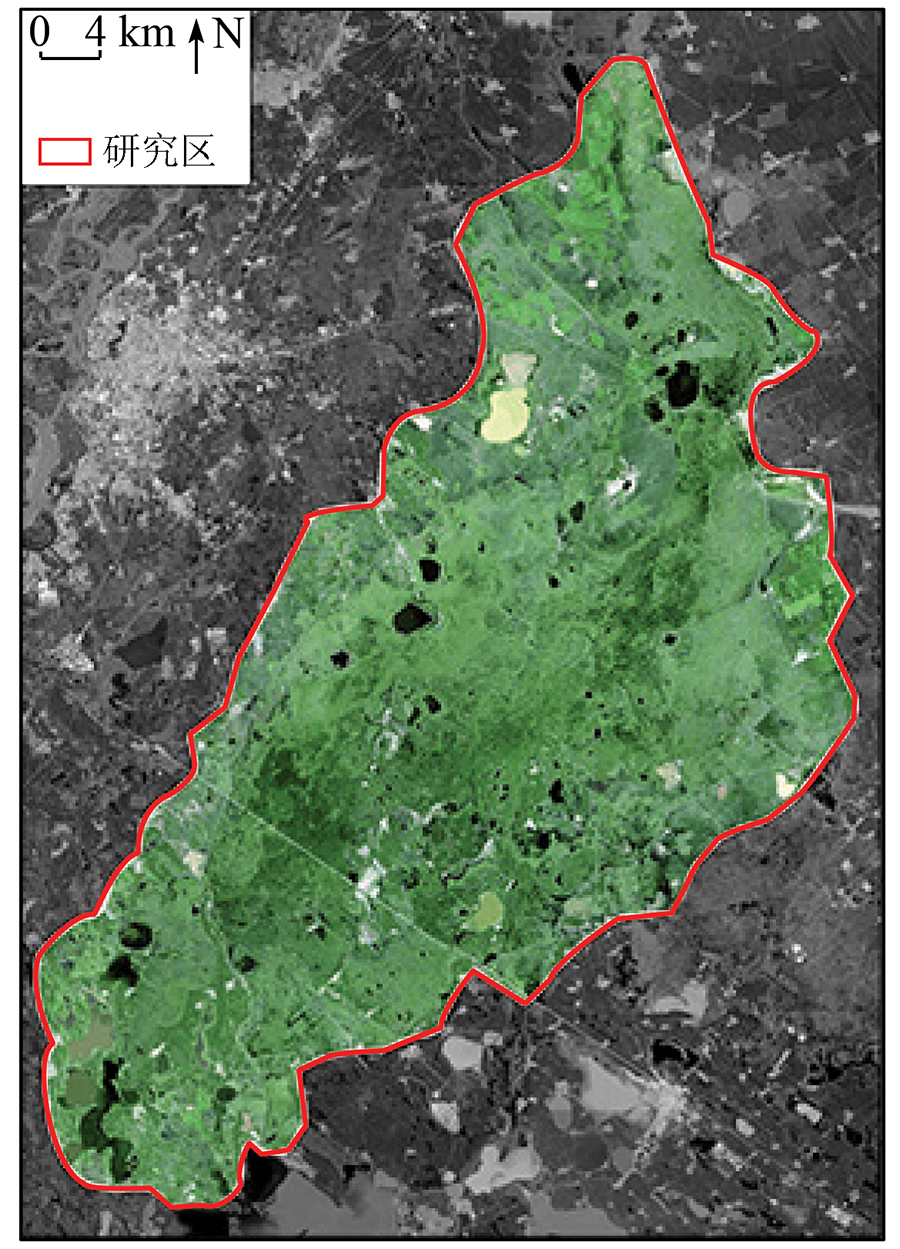
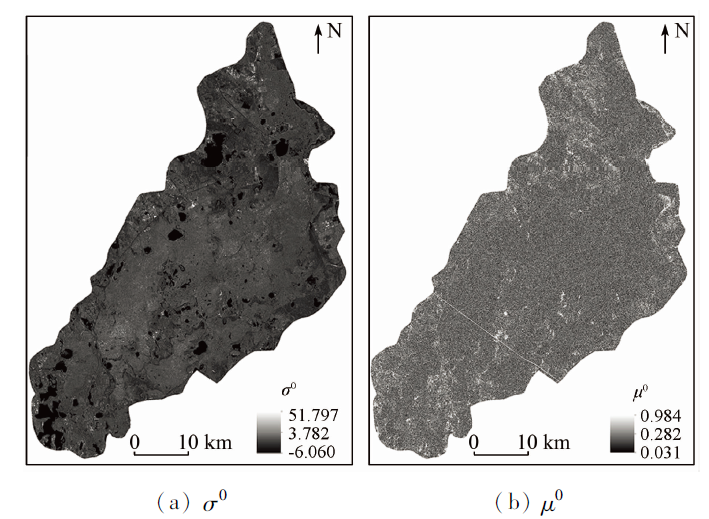
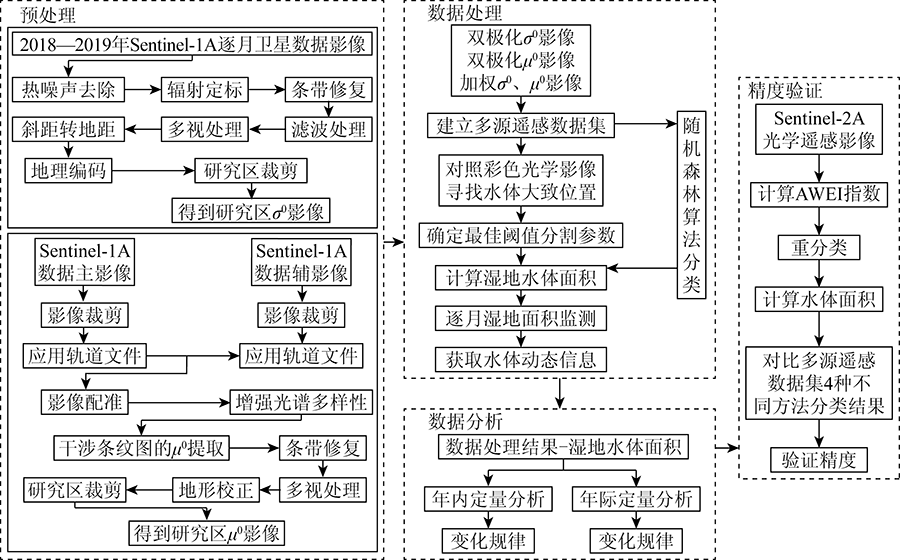
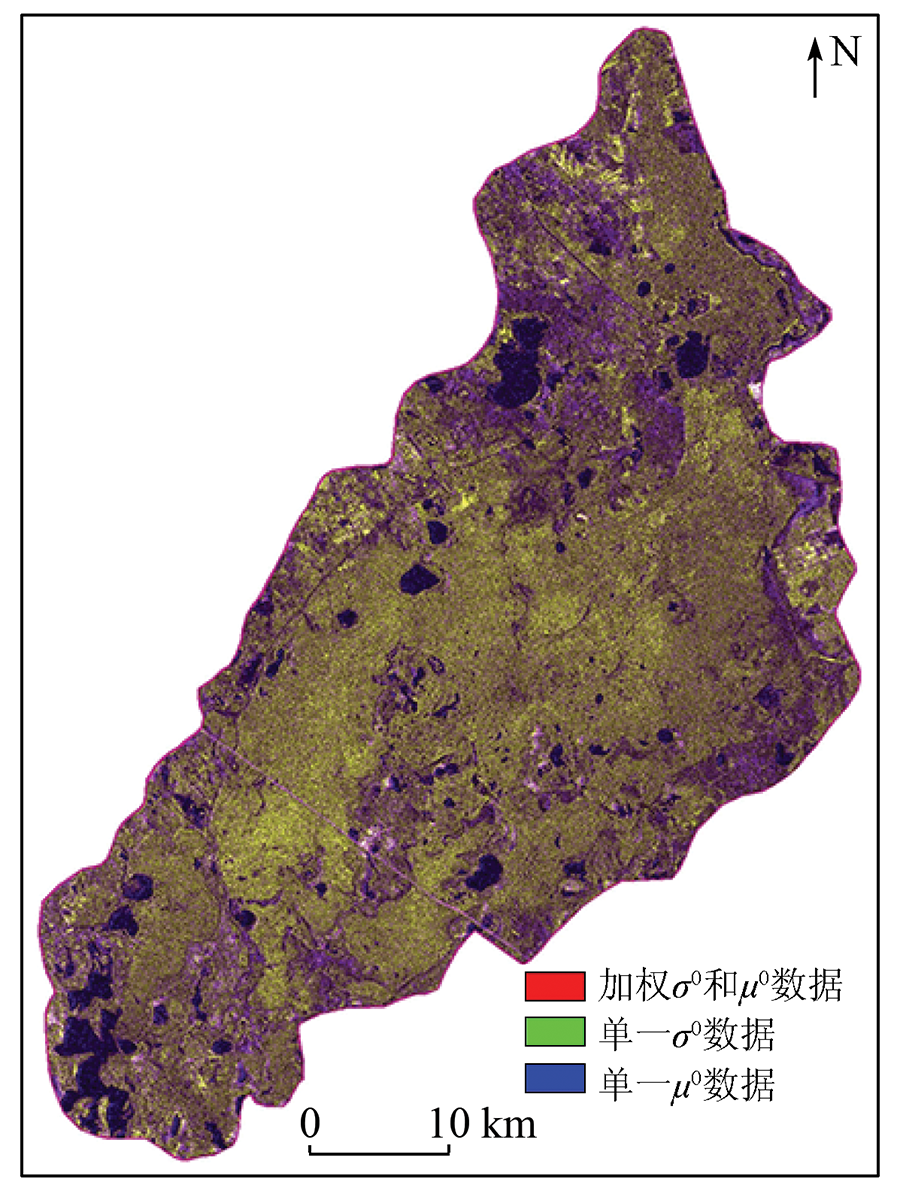
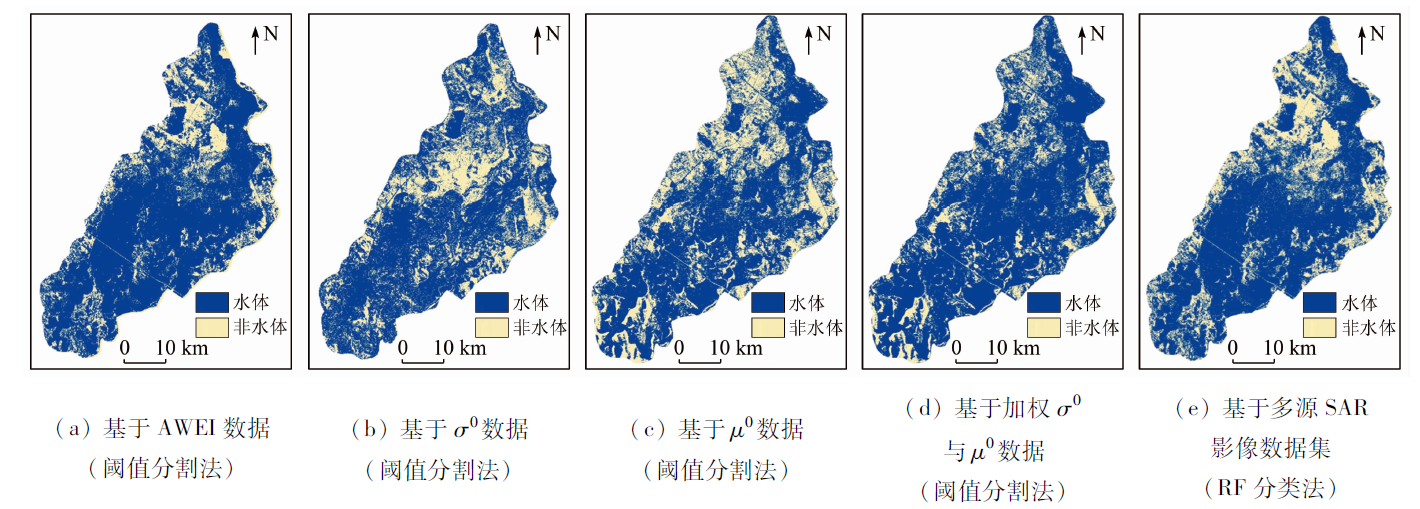
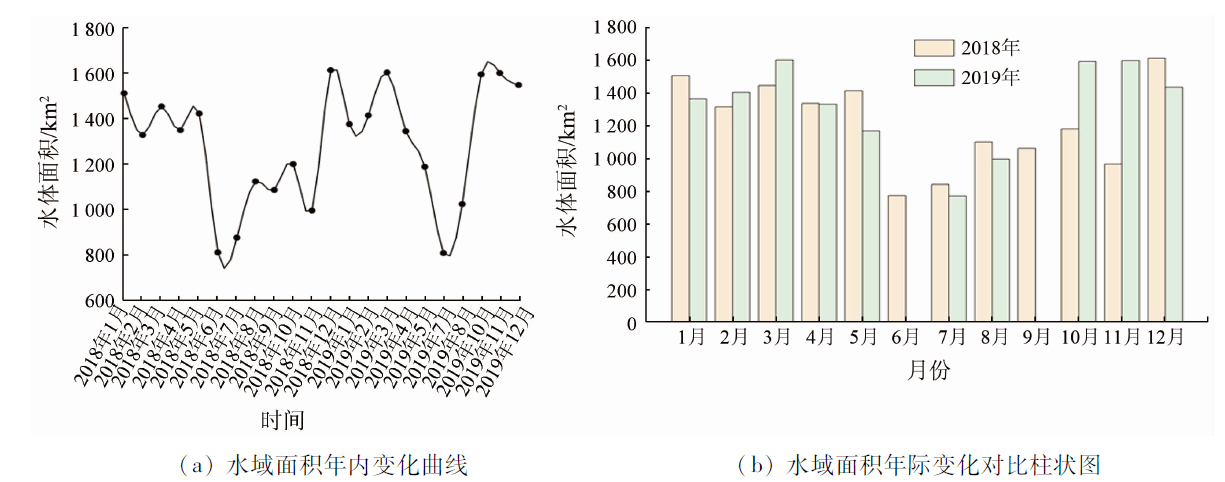
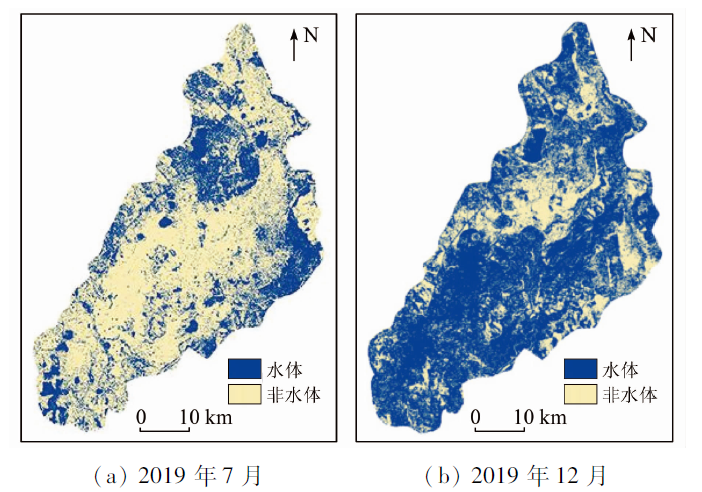
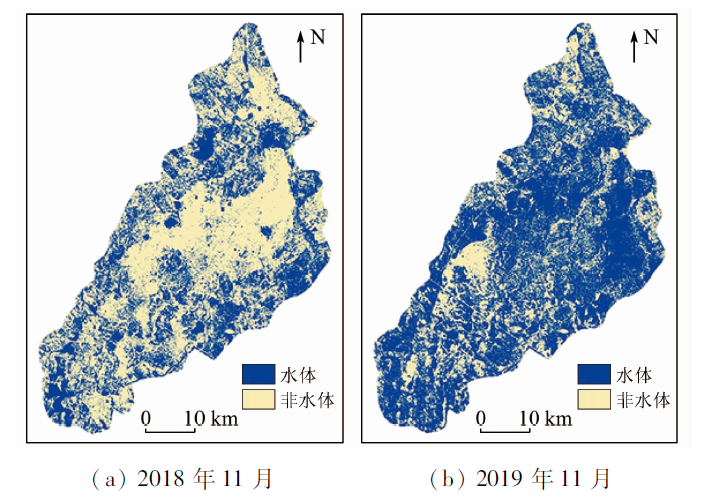
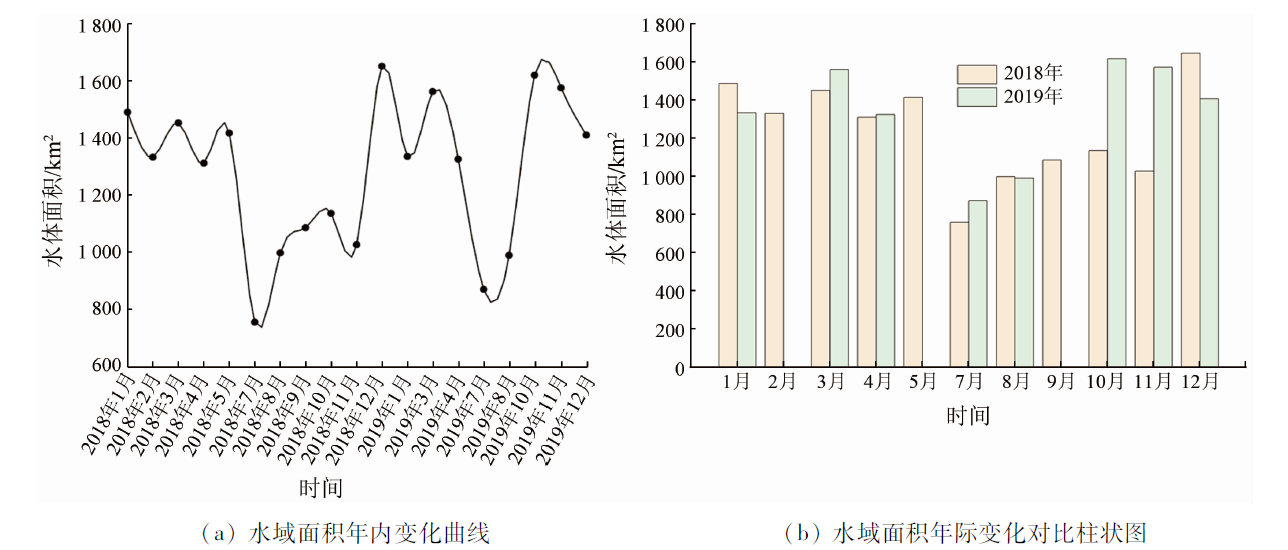
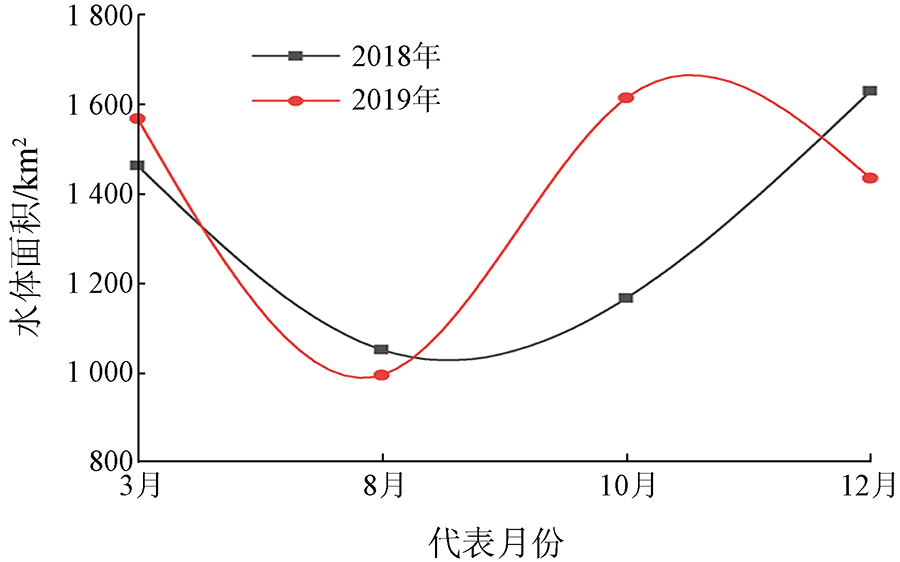
Water is an important factor in the formation and maintenance of wetland ecosystems. Monitoring the changes in the water area of wetlands is of great significance for wetland conservation. Taking Sentinel-1A data from 2018 to 2019 as the data source, this study calculated the intra- and inter-annual synthetic aperture radar (SAR) backscattering coefficient (σ0) and coherence coefficient (μ0) images of the Zhalong Wetland. Then, this study assigned weights according to the proximity to water bodies of color optical images and extracted the weighted images of σ0 and μ0. Finally, this study extracted the wetland water bodies using the threshold segmentation method and random forest algorithm. The purpose is to monitor the dynamic variations in the wetland water area and explore the intra- and inter-annual variation rules of the wetland water body. The results are as follows. The random forest algorithm yielded the highest extraction accuracy of water bodies, with an absolute value of the mean difference of representative months was 6.69 km2. The threshold segmentation method based on μ0 images yielded the lowest classification accuracy of water bodies, with an absolute value of the mean difference of 13.07 km2. Overall, the intra-annual water area of the Zhalong Wetland showed significant seasonal variations during 2018—2019. The water area fluctuated in the ranges of 1 300~1 600 km2 during late spring and early summer and 700~900 km2 during late summer and early autumn. The inter-annual water area varied with conditions such as climate and temperature. In particular, the wetland water area in October and November 2019 was approximately 1 050 km2 greater than that in 2018 due to large amounts of rainfall. As shown by the calculation based on effective data, the water area in 2019 was about 550 km2 greater than that in 2018 in the Zhalong Wetland.

Key wordsintra- and inter-annual variations of wetland water surface    Sentinel-1A    backscattering coefficient    coherence coefficient    threshold segmentation
收稿日期: 2021-06-30      出版日期: 2022-06-20
ZTFLH:  TP79  
基金资助:国家自然科学基金项目“基于主被动遥感的沼泽植被群丛时空分布与水文情势耦合研究”(41801071);广西自然科学基金项目“基于主被动遥感的北部湾红树林群丛时空分布与水文情势耦合研究”(2018GXNSFBA281015);广西科技计划项目(桂科AD20159037);桂林理工大学科研启动基金资助项目(GUTQDJJ2017096);广西八桂学者团队专项经费
通讯作者: 付波霖
作者简介: 韦 嫦(1997-),女,硕士研究生,研究方向为遥感与地理信息集成应用。Email: 1056930549@qq.com
引用本文:   
韦嫦, 付波霖, 覃娇玲, 王雅南, 陈智瀚, 刘兵. 基于多时相Sentinel-1A的沼泽湿地水面时空动态变化监测[J]. 自然资源遥感, 2022, 34(2): 251-260.
WEI Chang, FU Bolin, QIN Jiaoling, WANG Yanan, CHEN Zhihan, LIU Bing. Monitoring of spatial-temporal dynamic changes in water surface in marshes based on multi-temporal Sentinel-1A data. Remote Sensing for Natural Resources, 2022, 34(2): 251-260.
链接本文:  
https://www.gtzyyg.com/CN/10.6046/zrzyyg.2021205      或      https://www.gtzyyg.com/CN/Y2022/V34/I2/251
Fig.1  研究区地理位置
(底图为Sentinel-2A影像,其中研究区真彩色影像波段组合为B4(R),B3(G),B2(B))
月份 2018年
Sentinel-1A
2019年
Sentinel-1A
2019年
Sentinel-2A
1月 11日、23日 18日、30日
2月 4日、16日 11日、23日
3月 12日、24日 7日、19日 30日
4月 5日、17日 12日、24日
5月 11日、23日 18日、30日
6月 16日、28日
7月 10日、22日 17日、29日
8月 3日、15日 10日、22日 27日
9月 8日、20日
10月 14日、26日 9日、21日 26日
11月 7日、19日 2日、21日
12月 13日、25日 8日、20日 25日
Tab.1  影像数据具体信息
Fig.2  2019年8月数据预处理示例图
Fig.3  技术路线图
代表月份 加权影像 水体提取阈值分割范围
2018年3月 0.8 σ 0 + 0.2 μ 0 [0.001,0.180]
2018年8月 0.5 σ 0 + 0.5 μ 0 [0.010,0.085]
2018年10月 0.7 σ 0 + 0.3 μ 0 [0.005,0.155]
2018年12月 0.6 σ 0 + 0.4 μ 0 [0.006,0.250]
Tab.2  2018年加权σ0μ0数据波段运算公式及阈值参数
SAR影像数据集参数 类型 样本
数/棵
决策
树/棵
VV极化的σ0数据(波段1)、VH极化的σ0数据(波段2)、VV极化的μ0数据(波段3)、VH极化的μ0数据(波段4)、VV极化的加权σ0μ0数据(波段5) 水体 100 1 000
非水
100 1 000
Tab.3  2019年10月多源数据集参数及选取ROI样本信息
Fig.4  扎龙湿地彩色影像示例
Fig.5  2019年12月基于各数据的阈值分割法、RF分类法获取的扎龙湿地水体分布对比图
数据 2019年3月 2019年8月 2019年10月 2019年12月
面积 差值 面积 差值 面积 差值 面积 差值
AWEI数据 1 580.91 984.74 1 605.67 1 423.34
σ0数据 1 598.70 17.79 994.15 9.41 1 590.14 -15.53 1 432.09 8.75
μ0数据 1 561.70 -19.21 990.74 6.00 1 619.00 13.33 1 409.57 -13.77
加权σ0μ0数据 1 566.53 -14.38 996.37 11.63 1 613.01 7.34 1 434.72 11.38
RF分类结果图 1 575.27 -5.64 979.91 -4.83 1 610.59 4.92 1 411.98 -11.36
Tab.4  2019年基于不同处理方法得到的数据的水体提取结果比较
Fig.6  基于σ0数据提取的扎龙湿地水域面积变化趋势图(阈值分割法)
月份 2018年水体面积 2019年水体面积 年际差值
1月 1 503.50 1 361.28 -142.22
2月 1 311.79 1 401.55 89.76
3月 1 442.78 1 598.70 155.92
4月 1 333.78 1 329.30 -4.48
5月 1 410.17 1 165.58 -244.59
6月 770.51
7月 839.16 768.11 -71.05
8月 1 098.05 994.15 -103.9
9月 1 059.18
10月 1 177.69 1 590.14 412.45
11月 964.10 1 595.90 631.8
12月 1 609.32 1 432.09 -177.23
Tab.5  2018—2019年基于σ0数据提取的扎龙湿地水域面积(阈值分割法)
Fig.7  2019年年内扎龙湿地水体变化对比示例图
Fig.8  扎龙湿地年际水体变化对比示例图
月份 2018年水体面积 2019年水体面积 年际差值
1月 1 490.04 1 335.07 -154.97
2月 1 332.42
3月 1 452.73 1 561.70 108.97
4月 1 311.78 1 325.67 13.89
5月 1 416.75
6月
7月 756.98 871.37 114.39
8月 998.82 990.74 -8.08
9月 1 086.31
10月 1 136.89 1 619.00 482.11
11月 1 027.91 1 575.05 547.14
12月 1 649.70 1 409.57 -240.13
Tab.6  2018—2019年基于μ0数据提取的扎龙湿地水体面积(阈值分割法)
Fig.9  基于μ0数据提取的扎龙湿地水域面积变化趋势图(阈值分割法)
代表月份 2018年 2019年
3月 1 461.76 1 566.53
8月 1 052.46 996.37
10月 1 167.33 1 613.01
12月 1 628.46 1 434.72
Tab.7  基于加权σ0μ0数据提取的水体面积(阈值分割法)
Fig.10  扎龙湿地基于加权σ0μ0数据提取的年际水体面积折线图(阈值分割法)
代表月份 2018年湿地水体面积 2019年湿地水体面积
3月 1 461.64 1 575.27
8月 954.93 979.91
10月 1 187.23 1 610.59
12月 1 598.43 1 407.98
Tab.8  扎龙湿地基于随机森林算法提取水体面积
[1] 马玥. 基于多源遥感信息综合的湿地土地覆被分类研究[D]. 长春: 吉林大学, 2018.
Ma Y. Land cover classification of wetland based on multi-source remote sensing[D]. Changchun: Jilin University, 2018.
[2] 张鹏. 大庆市湿地动态变化分析[D]. 哈尔滨: 东北农业大学, 2018.
Zhang P. Dynamic change analysis of Daqing wetland[D]. Harbin: Northeast Agricultural University, 2018.
[3] 刘言. 湿地水文连通机理与模式分析——以莫莫格国家级自然保护区为例[D]. 长春: 吉林大学, 2020.
Liu Y. Mechanism and pattern analysis of wetland hydrological connectivity:Taking Momoge National Natural as an example[D]. Changchun: Jilin University, 2020.
[4] 王前进, 王希群, 陆诗雷, 等. 生态补偿的经济学理论基础及中国的实践[J]. 林业经济, 2019, 41(1):3-23.
Wang Q J, Wang X Q, Lu S L, et al. The basis of economic theory on the ecological compensation and its practice in China[J]. Forestry Economy, 2019, 41(1): 3-23.
[5] 李丹, 吴保生, 陈博伟, 等. 基于卫星遥感的水体信息提取研究进展与展望[J]. 清华大学学报(自然科学版), 2020, 60(2):147-161.
Li D, Wu B S, Chen B W, et al. Review of water body information extraction based on satellite remote sensing[J]. Journal of Tsinghua University (Natural Science Edition), 2020, 60(2):147-161.
[6] 甄佳宁. 基于多时相遥感的长春湿地动态变化研究[D]. 长春: 吉林大学, 2016.
Zhen J N. The research of wetland dynamic change in Changchun based on multi-temporal remote sensing[D]. Changchun: Jilin University, 2016.
[7] Jin H R, Huang C Q, Megan W L, et al. Monitoring of wetland inundation dynamics in the Delmarva Peninsula using Landsat time-series imagery from 1985 to 2011[J]. Remote Sensing of Environment, 2017, 190:26-41.
doi: 10.1016/j.rse.2016.12.001
[8] 常文涛, 陈欢, 常伟纲. 结合时间序列Sentinel-1数据和面向对象的湿地信息提取方法[J]. 北京测绘, 2020, 34(3):365-370.
Chang W T, Chen H, Chang W G. Time series Sentinel-1 data and object-oriented wetland information extraction method[J]. Beijing Surveying and Mapping, 2020, 34(3):365-370.
[9] 徐怡波. 基于ENVISAT ASAR数据的洞庭湖湿地遥感监测研究[D]. 南京: 南京林业大学, 2010.
Xu Y B. Study on the remote sensing monitoring of wetland in the Dongting Lake using ENVISAT ASAR data[D]. Nanjing: Nanjing Forestry University, 2010.
[10] 付波霖, 蓝斐芜, 邓腾芳, 等. 基于DInSAR的洪河国家级自然保护区沼泽水位相对变化量监测研究[J]. 湿地科学, 2021, 19(1):27-39.
Fu B L, Lan F W, Deng T F, et al. Monitoring of relative variation of water level of marshes in Honghe National Nature Reserve using DInSAR technique[J]. Wetland Science, 2021, 19(1): 27-39.
[11] 贺广均. 联合SAR与光学遥感数据的山区积雪识别研究[D]. 南京: 南京大学, 2015.
He G J. Snow recognition in mountain areas based on SAR and optical remote sensing data[D]. Nanjing: Nanjing University, 2015.
[12] 关韵桐. 基于SAR与光学数据的高原湿地土壤水分反演研究[D]. 昆明: 云南师范大学, 2019.
Guan Y T. Inversion of soil moisture in plateau wetland based on SAR and optical data[D]. Kunming: Yunnan Normal University, 2019.
[13] Mizuochia H, Hiyama T, Ohta T, et al. Development and evaluation of a lookup-table-based approach to data fusion for seasonal wetlands monitoring: An integrated use of AMSR series,MODIS,and Landsat[J]. Remote Sensing of Environment, 2017, 199: 370-388.
doi: 10.1016/j.rse.2017.07.026
[14] 常文涛, 王浩, 宁晓刚, 等. 融合Sentinel-2红边波段和Sentinel-1雷达波段影像的扎龙湿地信息提取[J]. 湿地科学, 2020, 18(1):10-19.
Chang W T, Wang H, Ning X G, et al. Extraction of Zhalong wetlands information based on images of Sentinel-2 red-edge bands and Sentinel-1 Radar bands[J]. Wetland Science, 2020, 18(1): 10-19.
[15] 李哲, 宫兆宁, 刘先林, 等. 基于面向对象多端元混解模型的植被覆盖度反演及其时空分布研究[J]. 遥感技术与应用, 2018, 33(6):1149-1158.
Li Z, Gong Z N, Liu X L, et al. Vegetation coverage retrieval and spatio-temporal distribution based on object-oriented multi-terminal mixed model[J]. Remote Sensing Technology and Application, 2018, 33(6):1149-1158.
[16] 刘瑶, 余自强, 范杰平, 等. 鄱阳湖丰水期水体后向散射特性研究[J]. 华中师范大学学报(自然科学版), 2019, 53(2):283-289.
Liu Y, Yu Z Q, Fan J P, et al. The characters of backscattering coefficient during flood period in Poyang Lake[J]. Journal of Central China Normal University (Natural Science Edition), 2019, 53(2):283-289.
[17] 贾亮亮, 汪小钦, 王峰. 基于波段运算和纹理特征的高分一号多光谱数据云检测[J]. 遥感信息, 2018, 33(5):62-68.
Jia L L, Wang X Q, Wang F. Cloud detection based on band operation texture feature for GF-1 multispectral data[J]. Remote Sensing Information, 2018, 33(5):62-68.
[18] 王婕. 基于分类导向的三维联合头部姿态估计与人脸关键点定位[D]. 合肥: 中国科学技术大学, 2017.
Wang J. Joint 3D head pose and face landmarks regression based on classification-guided method[D]. Hefei: University of Science and Technology of China, 2017.
[19] Gudina L F, Henrik M, Rasmus F, et al. Automated water extraction index: A new technique for surface water mapping using Landsat imagery[J]. Remote Sensing of Environment, 2014, 140:23-35.
doi: 10.1016/j.rse.2013.08.029
[20] 王一帆, 徐涵秋. 基于客观阈值与随机森林Gini指标的水体遥感指数对比[J]. 遥感技术与应用, 2020, 35(5):1089-1098.
Wang Y F, Xu H Q. Comparison of remote sensing water indices based on objective threshold value and the random forest gini coefficient[J]. Remote Sensing Technology and Application, 2020, 35(5):1089-1098.
[1] 何彬方, 姚筠, 冯妍, 刘惠敏, 戴娟. 基于Sentinel-1A的安徽省2020年梅雨期洪水淹没监测[J]. 自然资源遥感, 2023, 35(1): 140-147.
[2] 李叶繁, 王琳, 张冬珠. 光谱特征和空间卷积相协同的近岸海域养殖塘遥感信息提取[J]. 自然资源遥感, 2022, 34(4): 42-52.
[3] 史珉, 宫辉力, 陈蓓蓓, 高明亮, 张舜康. Sentinel-1A京津冀平原区2016—2018年地面沉降InSAR监测[J]. 自然资源遥感, 2021, 33(4): 55-63.
[4] 白俊龙, 王章琼, 闫海涛. K-means聚类引导的无人机遥感图像阈值分类方法[J]. 自然资源遥感, 2021, 33(3): 114-120.
[5] 孙超, 陈振杰, 王贝贝. 基于SAR时间序列的建设用地扩展监测——以常州市新北区为例[J]. 国土资源遥感, 2020, 32(4): 154-162.
[6] 刘警鉴, 李洪忠, 华璀, 孙毓蔓, 陈劲松, 韩宇. 基于Sentinel-1A数据的临高县早稻面积提取[J]. 国土资源遥感, 2020, 32(1): 191-199.
[7] 白泽朝, 汪宝存, 靳国旺, 徐青, 张红敏, 刘辉. Sentinel-1A数据矿区地表形变监测适用性分析[J]. 国土资源遥感, 2019, 31(2): 210-217.
[8] 陈继伟, 曾琪明, 焦健, 赵斌臣. Sentinel-1A卫星TOPS模式数据的SBAS时序分析方法——以黄河三角洲地区为例[J]. 国土资源遥感, 2017, 29(4): 82-87.
[9] 章钊颖, 鲁奕岑, 吴国周, 王永利. 基于多时相Sentinel-1A SAR数据草原地区降水量反演[J]. 国土资源遥感, 2017, 29(4): 156-160.
[10] 杜伟娜, 徐爱功, 宋耀鑫, 孙华生. 新型SAR传感器一级地距产品绝对辐射定标方法[J]. 国土资源遥感, 2016, 28(4): 30-34.
[11] 李华胜, 黄平平, 苏莹. 一种提取遥感影像中道路信息的方法[J]. 国土资源遥感, 2015, 27(2): 56-62.
[12] 龙晓君, 何政伟, 刘严松, 夏福瑞, 薛东剑, 李喆.
西藏羌多地区遥感蚀变与构造信息提取及成矿预测
[J]. 国土资源遥感, 2010, 22(2): 63-67.
[13] 高帅, 牛铮, 刘晨洲. 基于RADARSAT SAR估测热带人工林叶面积指数研究[J]. 国土资源遥感, 2008, 20(4): 35-38.
[14] 陈权, 李震, 王磊. 环境小卫星S波段SAR监测土壤水分变化应用分析[J]. 国土资源遥感, 2005, 17(2): 12-15.
[15] 王臣立, 牛铮, 郭治兴, 丛丕福, 邓小炼. Radarsat SAR的森林生物物理参数信号响应及其蓄积量估测[J]. 国土资源遥感, 2005, 17(2): 24-28.
Viewed
Full text


Abstract

Cited

  Shared   
  Discussed   
京ICP备05055290号-2
版权所有 © 2015 《自然资源遥感》编辑部
地址:北京学院路31号中国国土资源航空物探遥感中心 邮编:100083
电话:010-62060291/62060292 E-mail:zrzyyg@163.com
本系统由北京玛格泰克科技发展有限公司设计开发