Please wait a minute...
 
自然资源遥感  2023, Vol. 35 Issue (4): 43-52    DOI: 10.6046/zrzyyg.2022310
  技术方法 本期目录 | 过刊浏览 | 高级检索 |
居民碳排放的遥感监测与分析
田钊(), 梁艾琳()
南京信息工程大学遥感与测绘工程学院,南京 210044
Remote sensing-based monitoring and analysis of residential carbon emissions
TIAN Zhao(), LIANG Ailin()
School of Remote Sensing & Geomatics Engineering, Nanjing University of Information Science & Technology, Nanjing 210044, China
全文: PDF(5800 KB)   HTML  
输出: BibTeX | EndNote (RIS)      
摘要 

近年来,我国对居民碳排放的研究多集中于经济水平和直接能源消耗方面,在居民区面积方面涉及较少,且研究大多依赖传统的地表实测数据。为了提高数据精度、更有针对性地制定政策,该文利用遥感影像时效性强、覆盖范围广、制约性小等特点,选取中国区域为研究对象,分析了2019年中国居民区面积和居民碳排放的相关性。在确定两者显著性后,结合国内生产总值(gross domestc product,GDP)这一影响因素建立了居民碳排放与居民区面积和GDP的多元线性回归模型。结果显示: 居民碳排放与居民区面积和GDP之间存在线性相关,随着经济水平的发展,居民区面积的扩建是居民碳排放量增加的主要推动力,GDP对居民碳排放量增加的驱动效应有所下降。因此,在考虑经济发展的同时需要合理控制居民区面积,从而能够更精细化地制定减排政策,实现国家未来的绿色低碳目标。

服务
把本文推荐给朋友
加入引用管理器
E-mail Alert
RSS
作者相关文章
田钊
梁艾琳
关键词 居民碳排放居民区面积遥感技术线性回归GDP    
Abstract

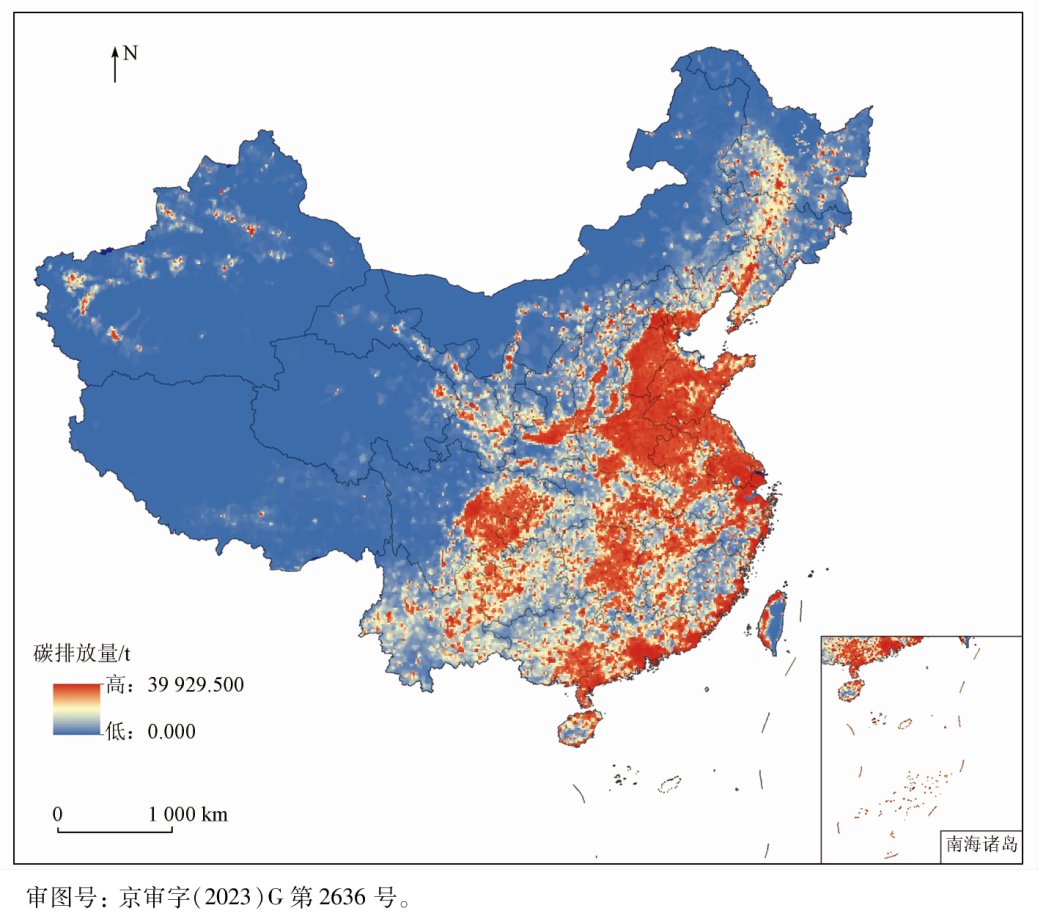
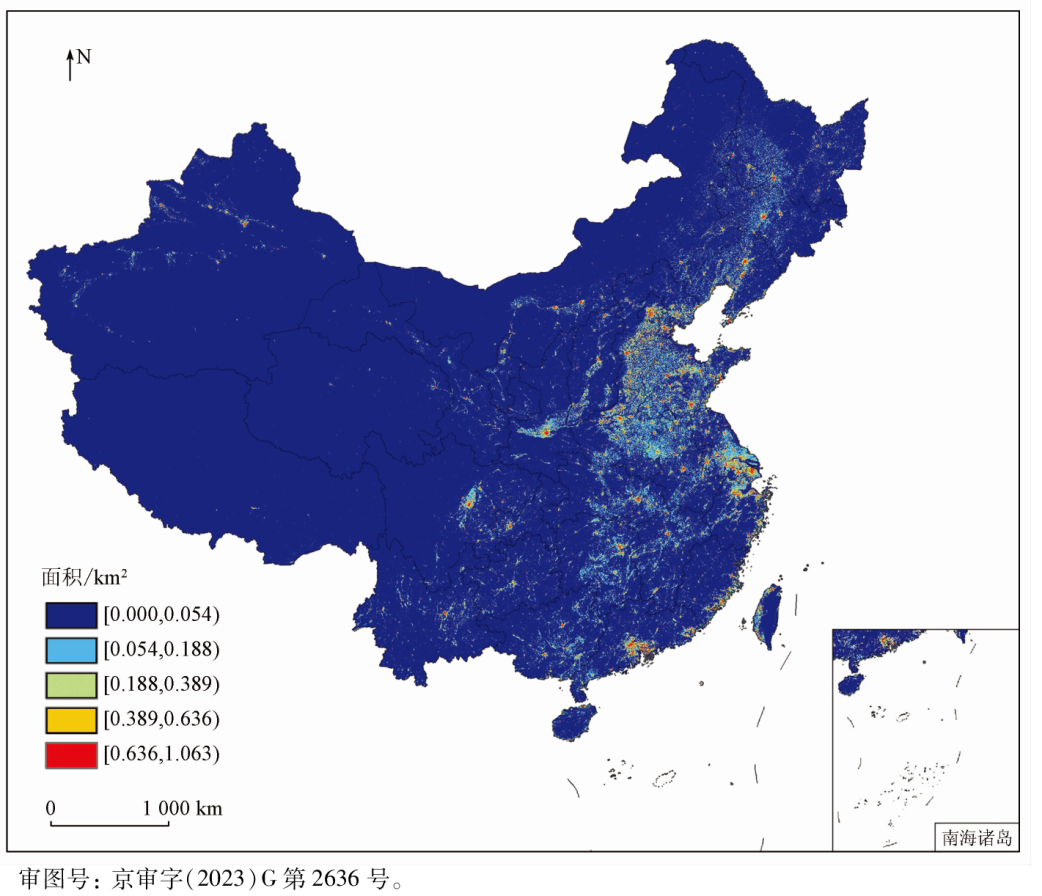
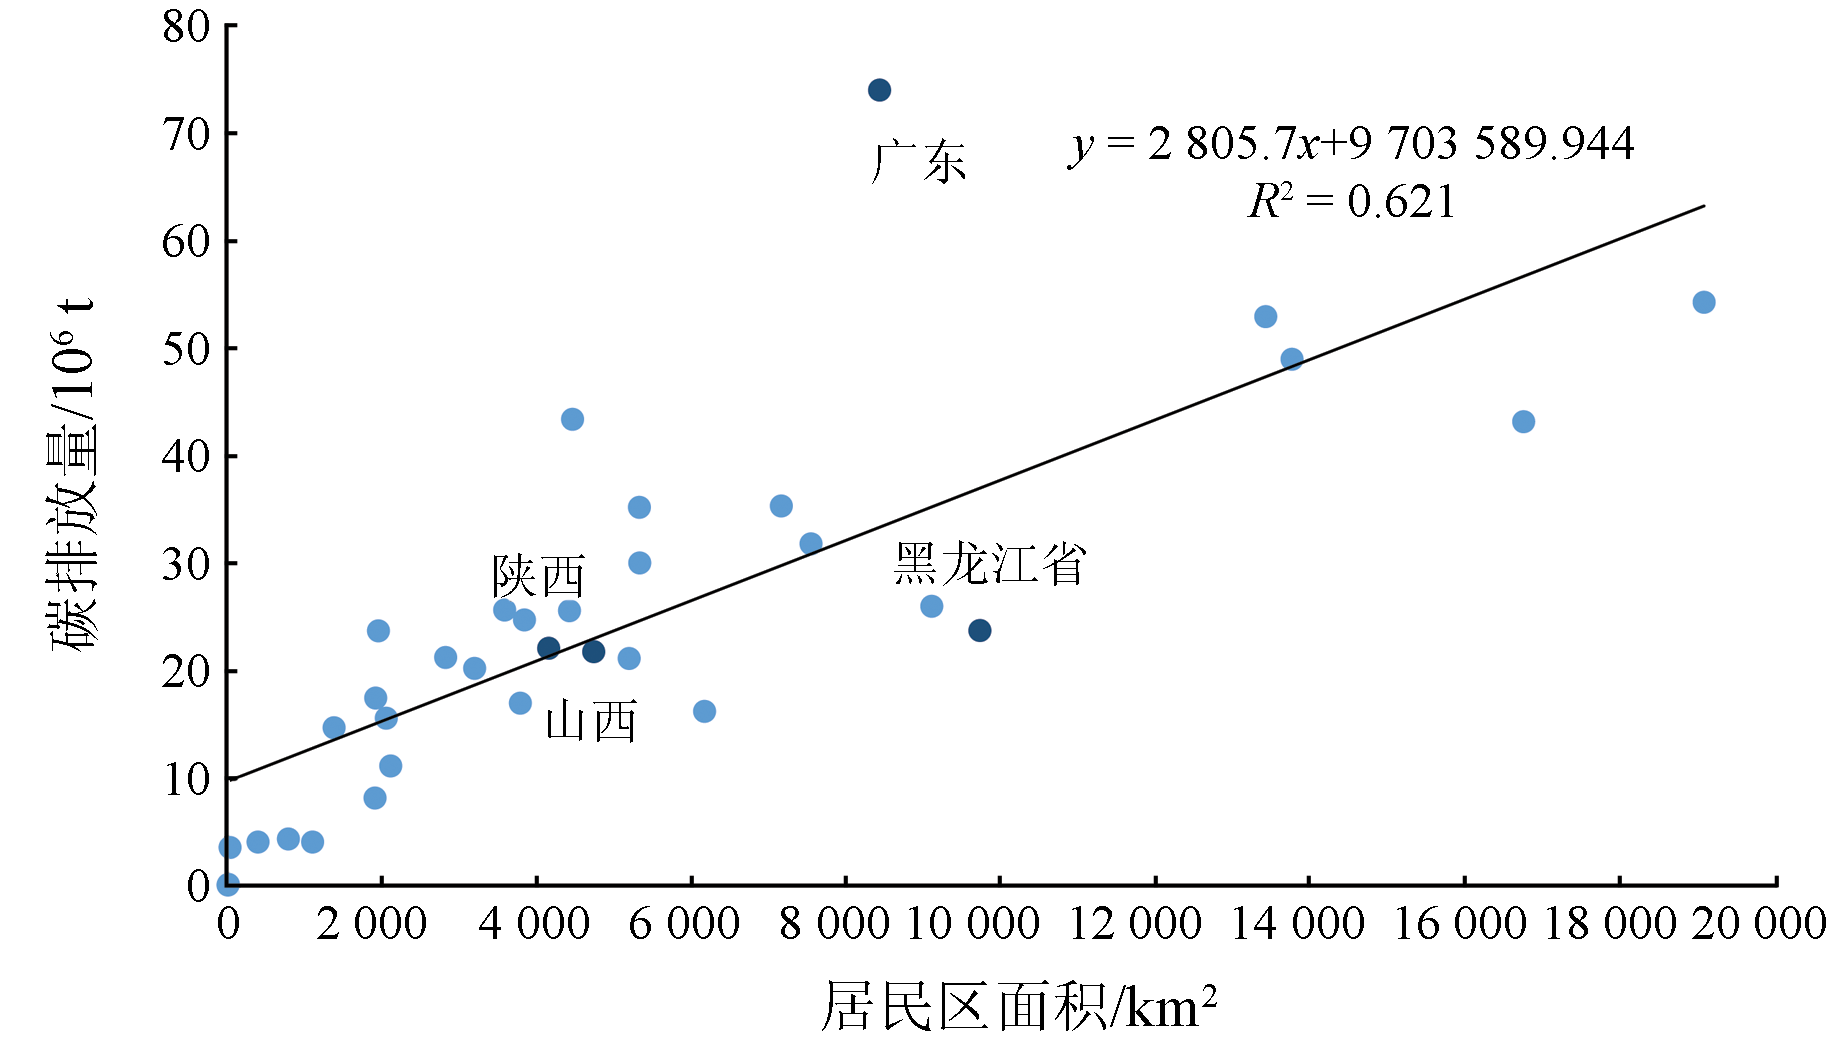
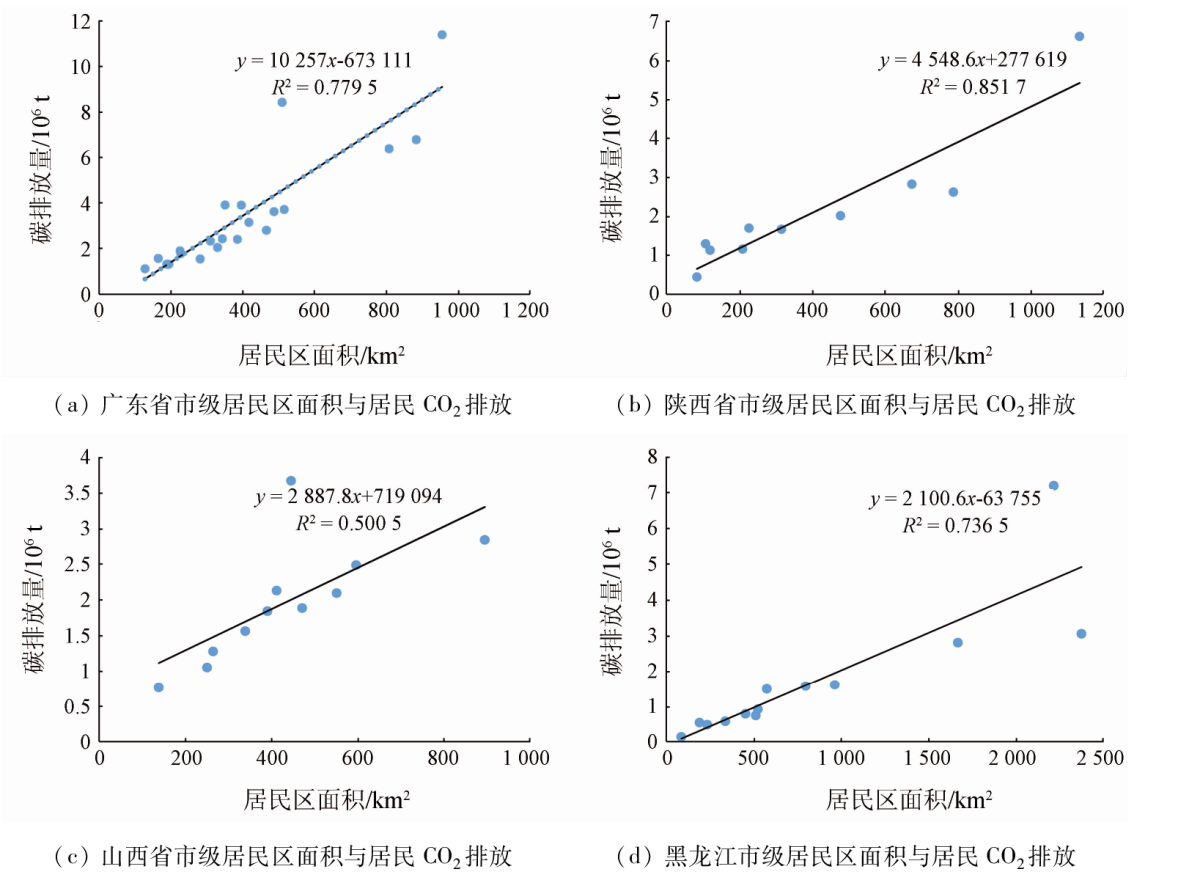
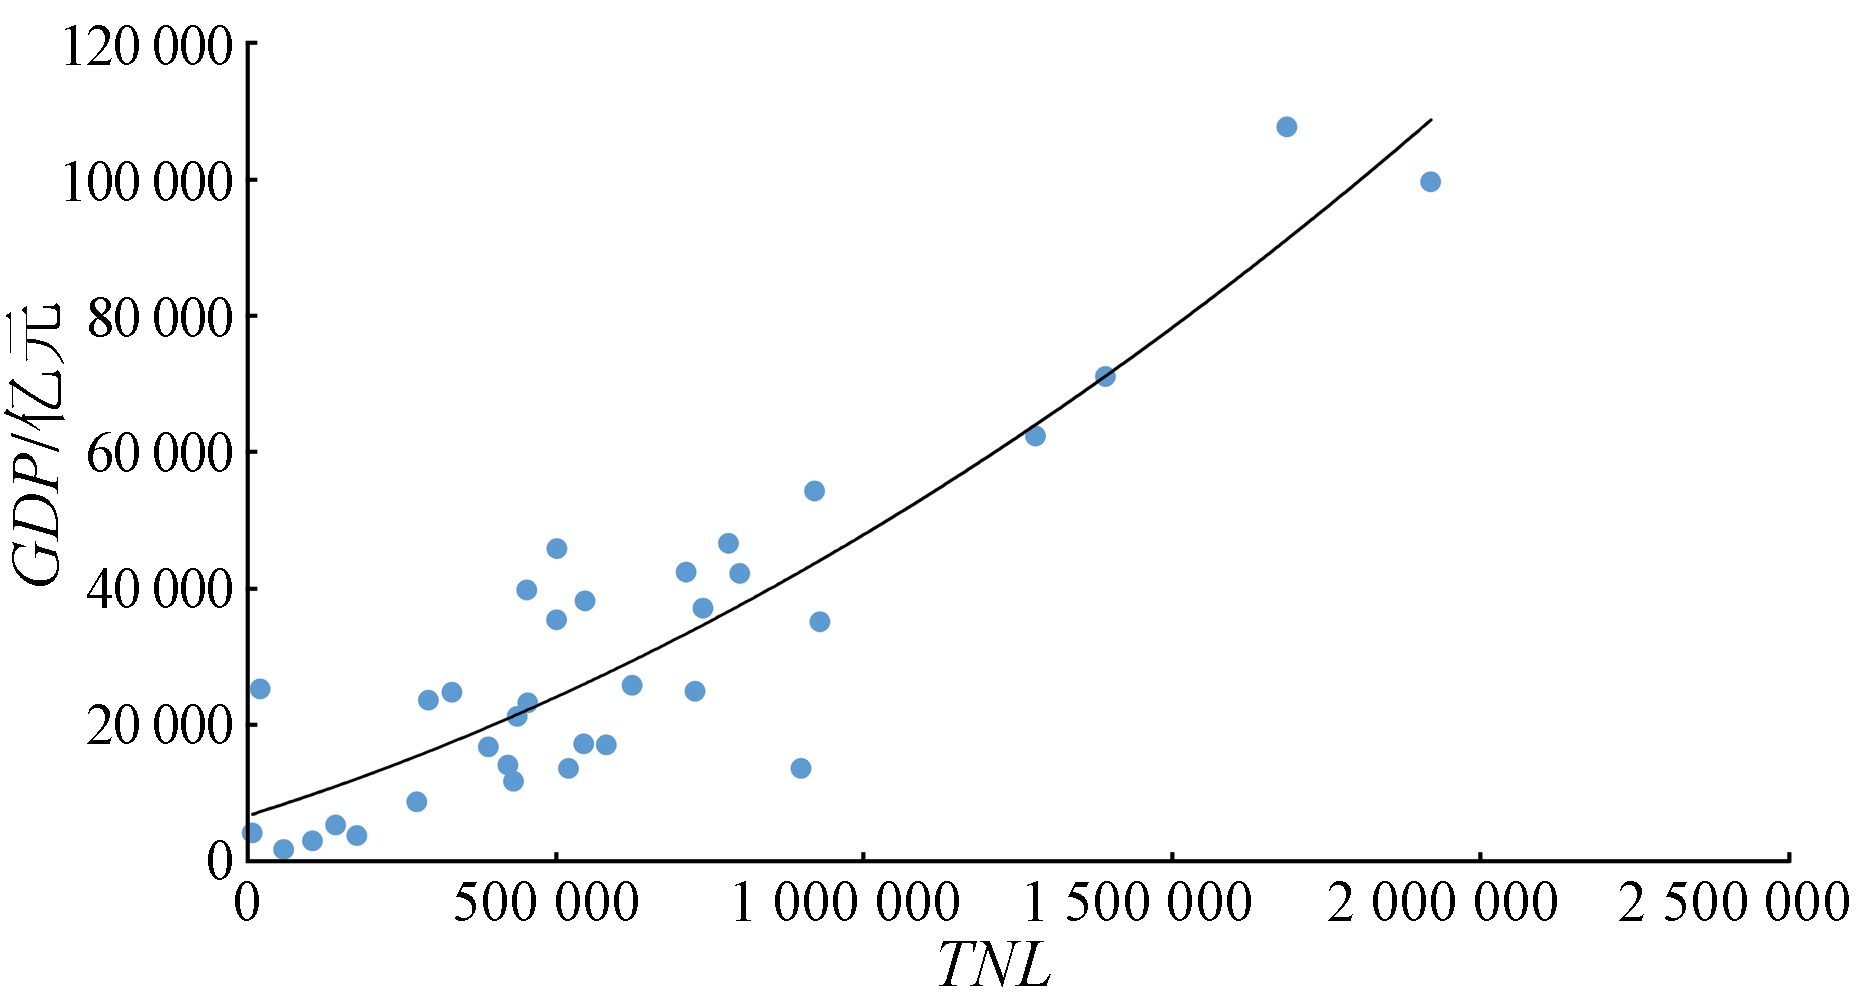
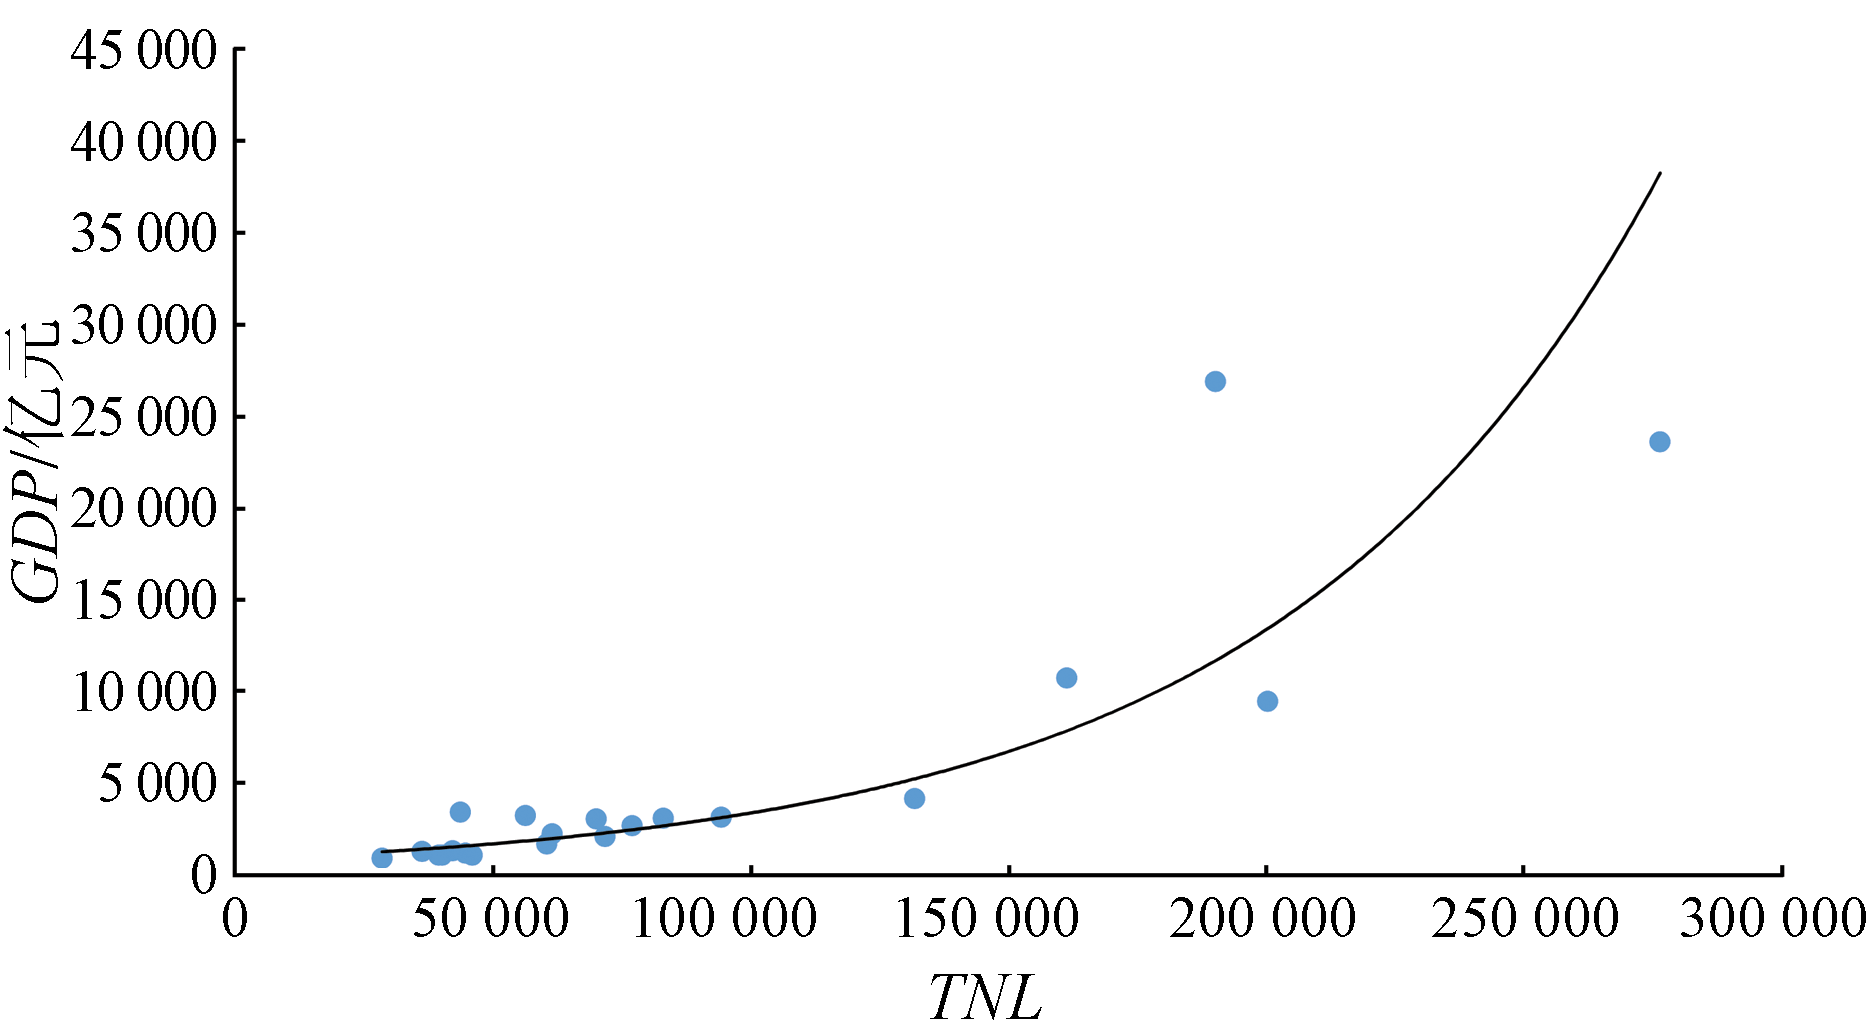
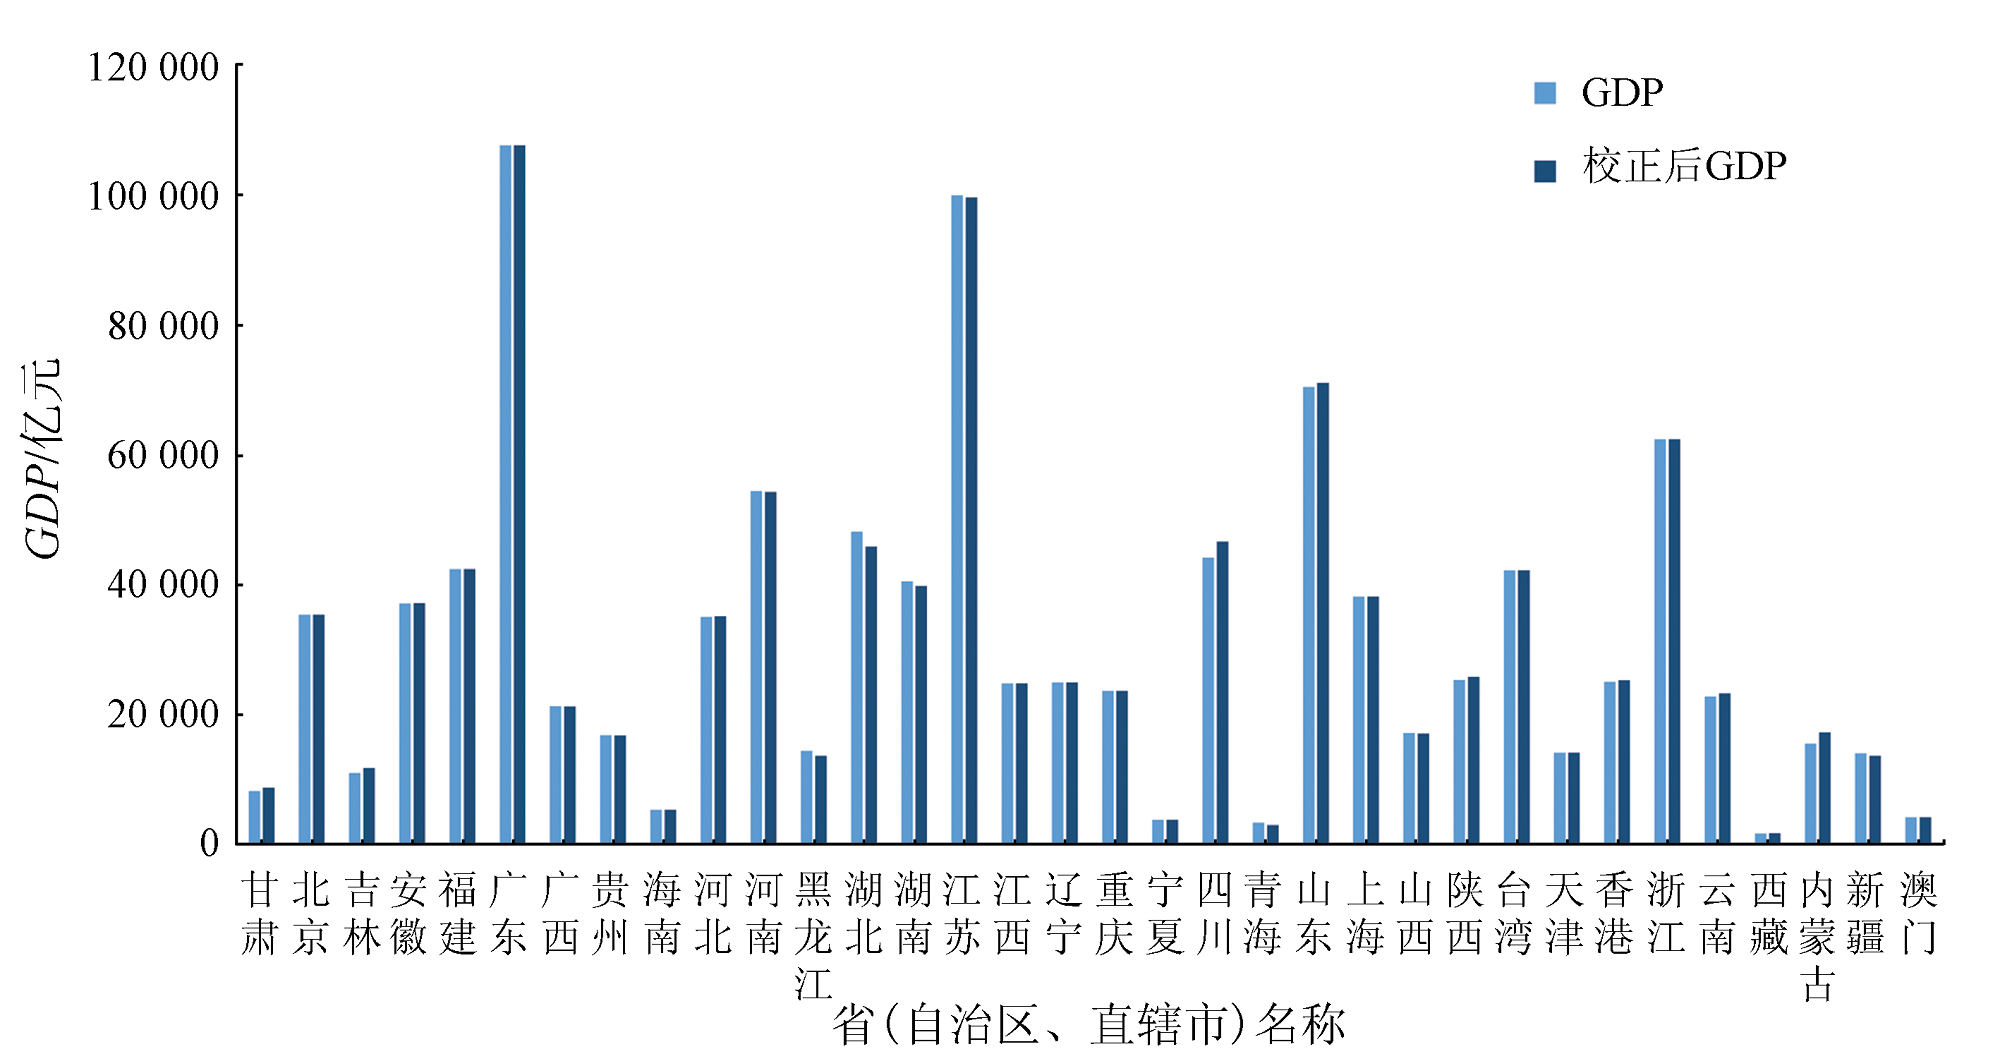
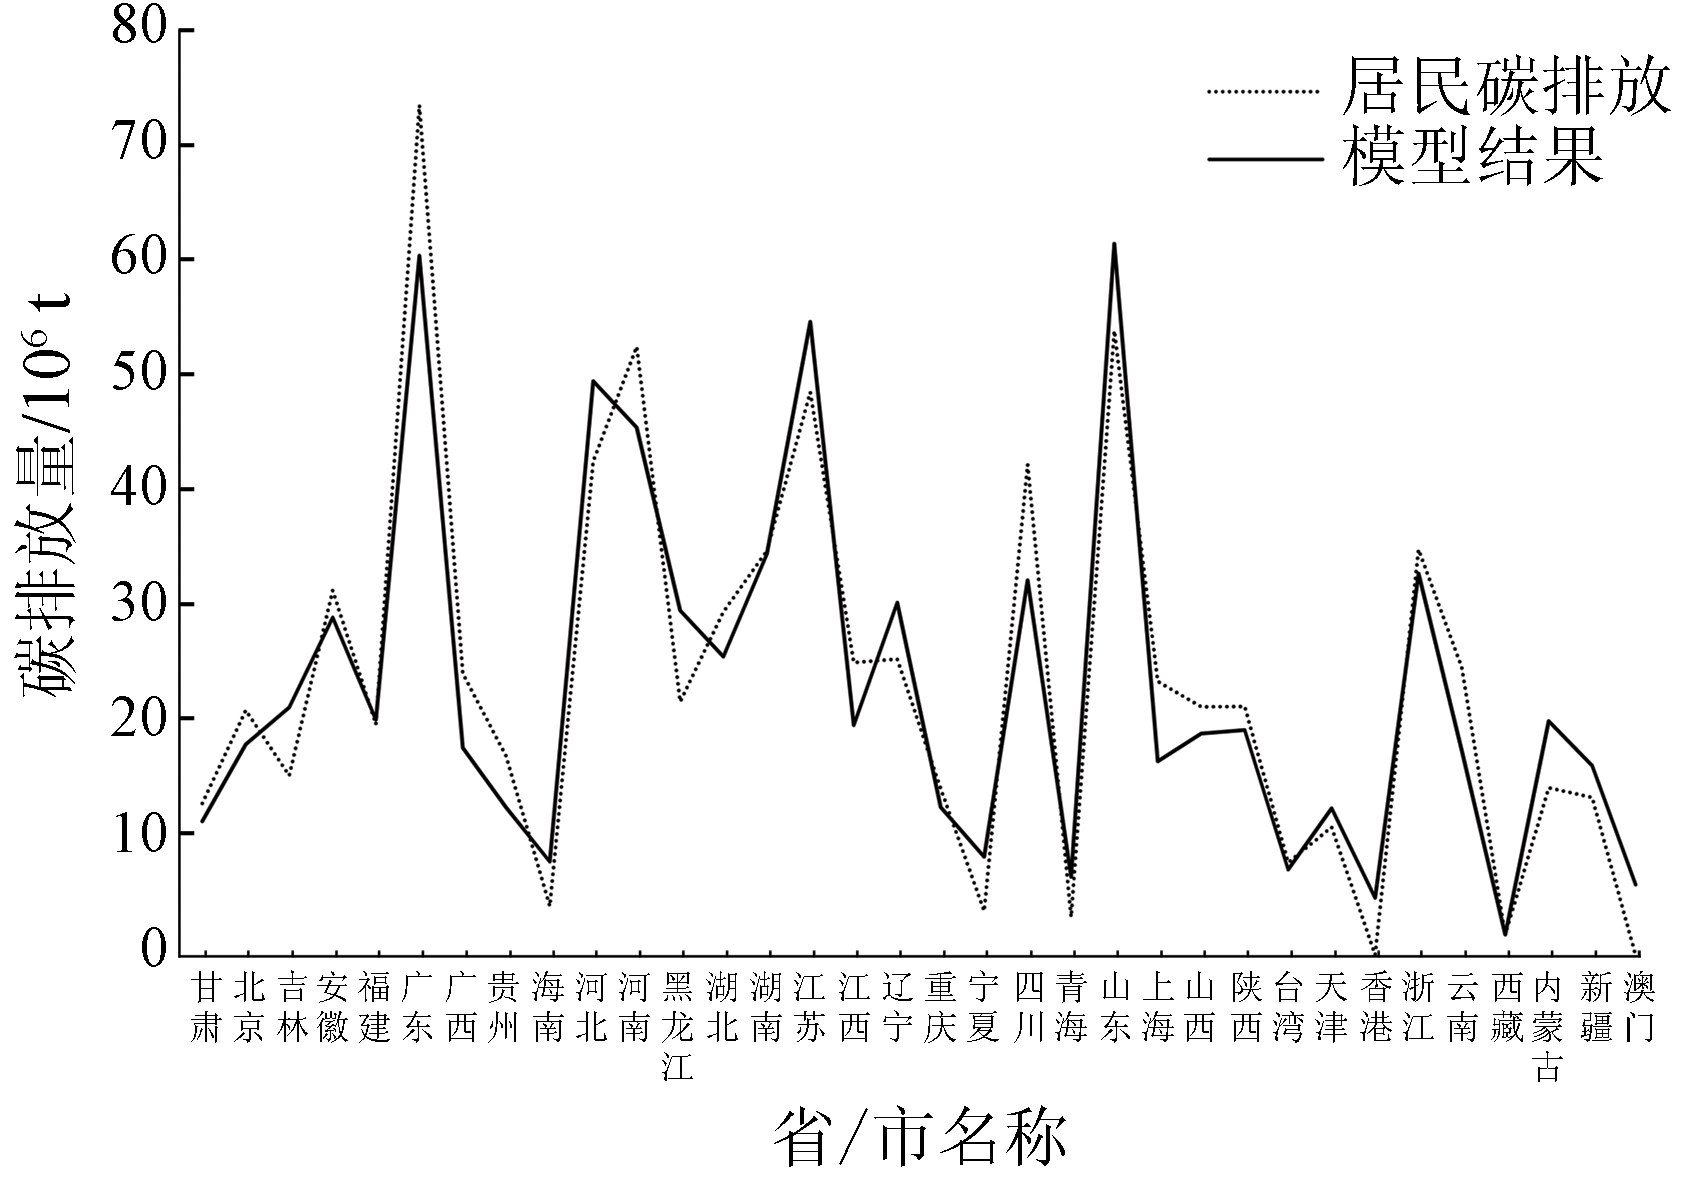
In recent years, the research on residents’ carbon emissions has mostly focused on the economic level and direct energy consumption, and less involved in the area of residential areas, and most of the research has relied on traditional surface measured data. In order to improve data accuracy and make more targeted policies, this paper selected China as the research object by taking advantage of the features of strong timeliness, wide coverage and small constraints of remote sensing images, and analyzed the correlation between residential area and residential carbon emissions in China in 2019. After determining the significance of the two, combined with the influencing factor of GDP, a multiple linear regression model was established between residents’ carbon emissions and residential area and GDP. The results show that there is a linear correlation between residents’ carbon emissions and the area of residential areas and GDP. With the development of economic level, the expansion of residential area is the main driving force for the increase of residential carbon emissions, and the driving effect of GDP on the increase of residential carbon emissions has decreased. Therefore, it is necessary to reasonably control the expansion of residential areas while considering economic development, so as to make more refined emission reduction policies and achieve the country's future green and low-carbon goals.

Key wordsresidential carbon emissions    residential area    remote sensing technology    linear regression    GDP
收稿日期: 2022-07-27      出版日期: 2023-12-21
ZTFLH:  TP79  
基金资助:江苏省基础研究计划(自然科学基金)青年基金项目“星载CO2-IPDA的高精度探测方法研究”(BK20190779);国家自然科学基金青年科学基金项目“基于星载多波长差分吸收激光雷达的二氧化碳高精度反演方法研究”(42001273)
通讯作者: 梁艾琳(1991-),女,博士,讲师,主要从事环境遥感领域研究。Email: ireneliang@nuist.edu.cn
作者简介: 田钊(1999-),男,硕士研究生,主要研究方向为测绘遥感与碳排放领域。Email: Tzhao1999@163.com
引用本文:   
田钊, 梁艾琳. 居民碳排放的遥感监测与分析[J]. 自然资源遥感, 2023, 35(4): 43-52.
TIAN Zhao, LIANG Ailin. Remote sensing-based monitoring and analysis of residential carbon emissions. Remote Sensing for Natural Resources, 2023, 35(4): 43-52.
链接本文:  
https://www.gtzyyg.com/CN/10.6046/zrzyyg.2022310      或      https://www.gtzyyg.com/CN/Y2023/V35/I4/43
Fig.1  中国居民碳排放分布示意图
Fig.2  中国居民区面积分布示意图
省(自治区、直辖市) 碳排放量/t 居民区面积/km2 省(自治区、直辖市) 碳排放量/t 居民区面积/km2
甘肃 13 223 574.000 2 058.908 重庆 14 508 318.760 1 384.728
北京 21 268 528.530 2 826.019 宁夏 3 940 642.663 1 106.026
吉林 15 637 185.780 6 171.864 四川 42 500 763.240 4 463.696
安徽 31 621 887.420 7 549.304 青海 3 421 548.663 399.819
福建 20 063 517.890 3 201.937 山东 54 052 669.620 19 091.455
广东 73 539 100.640 8 441.027 上海 23 771 177.490 1 955.184
广西 24 451 589.250 3 846.033 山西 21 586 369.170 4 746.097
贵州 17 284 229.880 1 919.981 陕西 21 588 825.170 4 163.300
海南 4 352 481.453 791.205 台湾 8 129 353.272 1 913.283
河北 42 773 490.350 16 757.354 天津 11 183 955.830 2 114.388
河南 52 696 895.880 13 424.795 香港 169 055.536 15.656
黑龙江 22 016 581.500 9 734.911 浙江 35 167 736.360 7 163.604
湖北 29 786 741.440 5 335.333 云南 24 984 211.160 3 588.350
湖南 35 040 778.890 5 328.253 西藏 1 893 136.813 41.076
江苏 48 748 844.030 13 764.077 内蒙古 14 579 287.550 5 196.512
江西 25 398 795.790 4 426.416 新疆 13 741 231.130 3 791.730
辽宁 25 696 782.040 9 110.471 澳门 109 775.838 10.552
Tab.1  中国各省(自治区、直辖市)居民碳排放与居民区面积统计表
自变量 回归系数 t p R2 F 德宾-沃森
常数 9 703 589.944 3.585 0.001** 0.621 F(1,32)=52.380
P=0.000
2.089
居民区面积 2 805.682 7.237 0.000**
Tab.2  OLS回归分析结果
Fig.3  中国各省(自治区、直辖市)居民区面积与居民CO2排放趋势图
Fig.4  部分省辖各市居民区面积与居民碳排放趋势图
拟合模型 公式 可拟合度R2
线性函数 G D P =0.051TNL+343.091 0.797
二次多项式函数 G D P =1.293 ×10⁻⁸ T N L 2+0.028TNL+6 710.071 0.816
指数函数 G D P = 7 646.177 e 1.701 × 10 - 6 T N L 0.587
Tab.3  中国各省(自治区、直辖市)不同模型的对比
自变量 回归系数 t p R2 Beta
TNL 0.028 2.145 0.040* 0.816 0.498
TNL2 1.293×10⁻⁸ 7.237 0.000** 0.418
Tab.4  二次多项式模型的拟合结果
Fig.5  中国各省(自治区、直辖市)GDP与TNL趋势图
自变量 回归系数 t p R2 Beta
TNL 1.374 2×10⁻⁵ 10.462 0.000** 0.852 0.923
常数 856.462 6.953 0.000**
Tab.5  广东省各市指数模型的拟合结果
Fig.6  广东省GDP与TNL趋势图
Fig.7  校正GDP与实际GDP对比图
自变量 回归系数 t p R2 F 德宾-沃森
常数 5 439 354.454 2.009 0.043* 0.703 F(2,31)=36.752,
F=0.000
2.032
x 1(居民区面积) 2 255.327 5.710 0.000**
x 2(GDP) 184.146 3.063 0.005**
Tab.6  整体模型OLS回归结果
尺度 模型 R2
中国省(自治区、直辖市)级 Y=2 255.327 x 1+184.146 x 2+5 439 354.454 0.703
广东省市级 Y=5 640.426 x 1+215.392 x 2+104 706.689 1 0.961
黑龙江省市级 Y=1 027.658 x 1+831.069 x 2-82 248.171 0.932
陕西省市级 Y=2 607.585 x 1+338.204 x 2+223 457.023 0.954
山西省市级 Y=2 234.288 x 1+673.122 x 2-47 130.692 0.964
Tab.7  不同尺度模型结果
Fig.8  各省/市居民碳排放真实值与拟合值的对比
Fig.9  各市居民碳排放真实值与拟合值的对比
[1] 孙洁, 王鹏飞. 基于STIRPAT模型研究南京碳排放的影响因素[J]. 物流科技, 2022, 45(2):117-122.
Sun J, Wang P F. Study on influencing factors of CO2 emission in Nanjing based on STIRPAT model[J]. Logistics Sci-Tech, 2022, 45(2):117-122.
[2] 杜威. 基于LMDI分解模型的中国居民生活间接碳排放特征分析[J]. 中国人口·资源与环境, 2016, 26(s2):5-9.
Du W. Analysis of characteristics of Chinese residents' indirect carbon emissions in daily life based on LMDl decomposition model[J]. China Population Resources and Environment, 2016, 26(s2):5-9.
[3] Huo T F, Ma Y L, Yu T, et al. Decoupling and decomposition analysis of residential building carbon emissions from residential income evidence from the provincial level in China[J]. Environmental Impact Assessment Review, 2021(86):106487.
[4] 佟昕, 陈凯, 李刚. 中国碳排放影响因素分析和趋势预测——基于STIRPAT和GM(1,1)模型的实证研究[J]. 东北大学学报(自然科学版), 2015, 36(2):297-300.
doi: 10.12068/j.issn.1005-3026.2015.02.031
Tong X, Chen K, Li G. Influencing factors analysis and trend forecasting of China’s carbon emissions—empirical study based on STIRPAT and GM(1,1) models[J]. Journal of Northeastern University(Nature Science), 2015, 36(2):297-300.
[5] 刘金培, 宋晓霞, 陈华友, 等. 中国人均碳排放影响因素的长期均衡与因果动态关系研究——基于结构突变ARDL-VECM模型的实证分析[J]. 运筹与管理, 2019, 28(9):57-65.
doi: 10.12005/orms.2019.0199
Liu J P, Song X X, Chen H Y, et al. Study on the Long-term equilibrium and causality of the influencing factors of China’s per capita carbon based on structural break ARDL and VECM model[J]. Operations Research and Management Science, 2019, 28(9):57-65.
[6] Zhang, et al. High-resolution global carbon emission grid 2019,in prep[DB]. http://gidmodel.org.cn/.
[7] Marconcini M, Metz-Marconcini A, Esch T, et al. Understanding current trends in global urbanisation-the world settlement footprint suite[J]. GI_Forum, 2021(1):33-38.
[8] 于博, 杨旭, 吴相利. 哈长城市群县域碳排放空间溢出效应及影响因素研究——基于NPP-VIIRS夜间灯光数据的实证[J]. 环境科学学报, 2020, 40(2):697-706.
Yu B, Yang X, Wu X L. Study on spatial spillover effects and influencing factors of carbon emissions in county areas of Ha-Chang city group:Evidence from NPP-VIIRS nightlight data[J]. Acta Scientiae Circumstantiae, 2020, 40(2):697-706.
[9] 顾鹏程, 王世新, 周艺, 等. 基于时间序列DMSP/OLS夜间灯光数据的GDP预测模型[J]. 中国科学院大学学报, 2019, 36(2):188-195.
doi: 10.7523/j.issn.2095-6134.2019.02.006
Gu P C, Wang S X, Zhou Y, et al. Estimation of GDP based on long time series of DMSP/OLS nighttime light images[J]. Journal of University of Chinese Academy of Sciences, 2019, 36(2):188-195.
doi: 10.7523/j.issn.2095-6134.2019.02.006
[10] 李峰, 卫爱霞, 米晓楠, 等. 基于NPP-VIIRS夜间灯光数据的河北省GDP空间化方法[J]. 信阳师范学院学报(自然科学版), 2016, 29(1):152-156.
Li F, Wei A X, Mi X N, et al. An approach of GDP spatialization in Hebei Province using NPP-VIIRS nighttime light data[J]. Journal of Xinyang Normal University (Natural Science Edition), 2016, 29(1):152-156.
[11] 杨青林, 赵荣钦, 邢月. 中国城市碳排放的空间分布特征研究[J]. 环境经济研究, 2017, 2(1):70-81.
Yang Q L, Zhao R Q, Xing Y, et al. Spatial distribution characteristics of carbon emissions in China’ s cities[J]. Journal of Environmental Economics, 2017, 2(1):70-81.
[12] 景真燕. 城市住宅碳排放影响因素分析及改进对策研究——以重庆市为例[D]. 重庆:重庆交通大学, 2016.
Jing Z Y. Study on the impact of urban eesidential carbon emissions factors and countermeasures—taking Chongqing as an example[J]. Chongqing:Chongqing Jiaotong University, 2016.
[13] 尹茁. 基于夜光遥感数据的GDP时空预测分析[D]. 阜新: 辽宁工程技术大学, 2021.
Yi Z. Spatiotemporal prediction analysis of GDP based on night-light remote sensing data[D]. Fuxin: Liaoning Technical University, 2021.
[14] 马瑞雪, 付波霖, 何宏昌, 等. 基于夜光遥感的GDP空间化建模及动态分析——以河南省为例[J]. 桂林理工大学学报, 2020, 40(3):557-567.
Ma R X, Fu B L, He H C, et al. GDP spatial model and dynamic analysis based on night-time light imagery:A case from Henan[J]. Journal of Guilin University of Technology, 2020, 40(3):557-567.
[15] Liu J, Tong D, Zheng Y, et al. Carbon and air pollutant emissions from China’s cement industry 1990-2015:Trends,evolution of technologies,and drivers[J]. Atmospheric Chemistry and Physics, 2021, 21(3):1627-1647.
[16] Marconcini M, Metz-Marconcini A, Üreyen S, et al. Outlining where humans live,the world settlement footprint 2015[J]. Scientific Data, 2020, 7(1):242.
doi: 10.1038/s41597-020-00580-5 pmid: 32686674
[1] 刘亚林. 基于真实感场景影像的天陇铁路勘察遥感解译与分析[J]. 自然资源遥感, 2022, 34(3): 227-234.
[2] 杜懿, 王大洋, 王大刚. GPM卫星降水产品空间降尺度研究——以贵州省为例[J]. 自然资源遥感, 2021, 33(4): 111-120.
[3] 王正, 贾公旭, 张清凌, 黄粤. COVID-19疫情背景下2020年第一季度广东省二、三产业GDP空间分布变化分析[J]. 自然资源遥感, 2021, 33(3): 184-193.
[4] 古海玲, 陈超, 芦莹, 褚衍丽. 基于卫星遥感技术的区域经济发展模型构建[J]. 国土资源遥感, 2020, 32(2): 226-232.
[5] 王琳, 李迅, 包云轩, 邵艺. 遥感技术在交通气象灾害监测中的应用进展[J]. 国土资源遥感, 2018, 30(4): 1-7.
[6] 赖家明, 杨武年. 基于RS的川西天然林区近29年植被覆盖动态变化[J]. 国土资源遥感, 2018, 30(4): 132-138.
[7] 杨雨薇, 戴晓爱, 牛育天, 刘汉湖, 杨晓霞, 兰燕. 基于CASI数据的黑河绿洲区叶面积指数反演[J]. 国土资源遥感, 2017, 29(4): 179-184.
[8] 侯爱华, 高伟, 王中挺, 汪霖. 利用高分一号卫星监测开封地区PM2.5[J]. 国土资源遥感, 2017, 29(4): 161-165.
[9] 李峰, 米晓楠, 刘军, 刘小阳. 基于NPP-VIIRS夜间灯光数据的北京市GDP空间化方法[J]. 国土资源遥感, 2016, 28(3): 19-24.
[10] 余德清, 余姝辰, 贺秋华, 李长安, 魏传义. 联合历史地图与遥感技术的洞庭湖百年萎缩监测[J]. 国土资源遥感, 2016, 28(3): 116-122.
[11] 李宗光, 胡德勇, 李吉贺, 岑建. 基于夜间灯光数据的连片特困区GDP估算及其空间化[J]. 国土资源遥感, 2016, 28(2): 168-174.
[12] 许剑辉, 舒红, 李杨. 基于MODIS雪盖数据的北疆雪深多元非线性回归克里金插值[J]. 国土资源遥感, 2015, 27(3): 84-91.
[13] 严婷婷, 边红枫, 廖桂项, 盛连喜, 张吉顺, 高明辉. 森林湿地遥感信息提取方法研究现状[J]. 国土资源遥感, 2014, 26(2): 11-18.
[14] 聂洪峰, 童立强, 李建存, 郭兆成, 郑雄伟, 程洋. 基于遥感技术的“6·5”重庆武隆鸡尾山崩滑灾害特征及应急救援工程布置研究[J]. 国土资源遥感, 2014, 26(1): 115-121.
[15] 刘德长, 叶发旺, 赵英俊, 杨旭, 伊丕源, 董秀珍. 地质找矿中遥感信息的综合研究与深化应用——以铀矿为例[J]. 国土资源遥感, 2011, 23(3): 14-19.
Viewed
Full text


Abstract

Cited

  Shared   
  Discussed   
京ICP备05055290号-2
版权所有 © 2015 《自然资源遥感》编辑部
地址:北京学院路31号中国国土资源航空物探遥感中心 邮编:100083
电话:010-62060291/62060292 E-mail:zrzyyg@163.com
本系统由北京玛格泰克科技发展有限公司设计开发