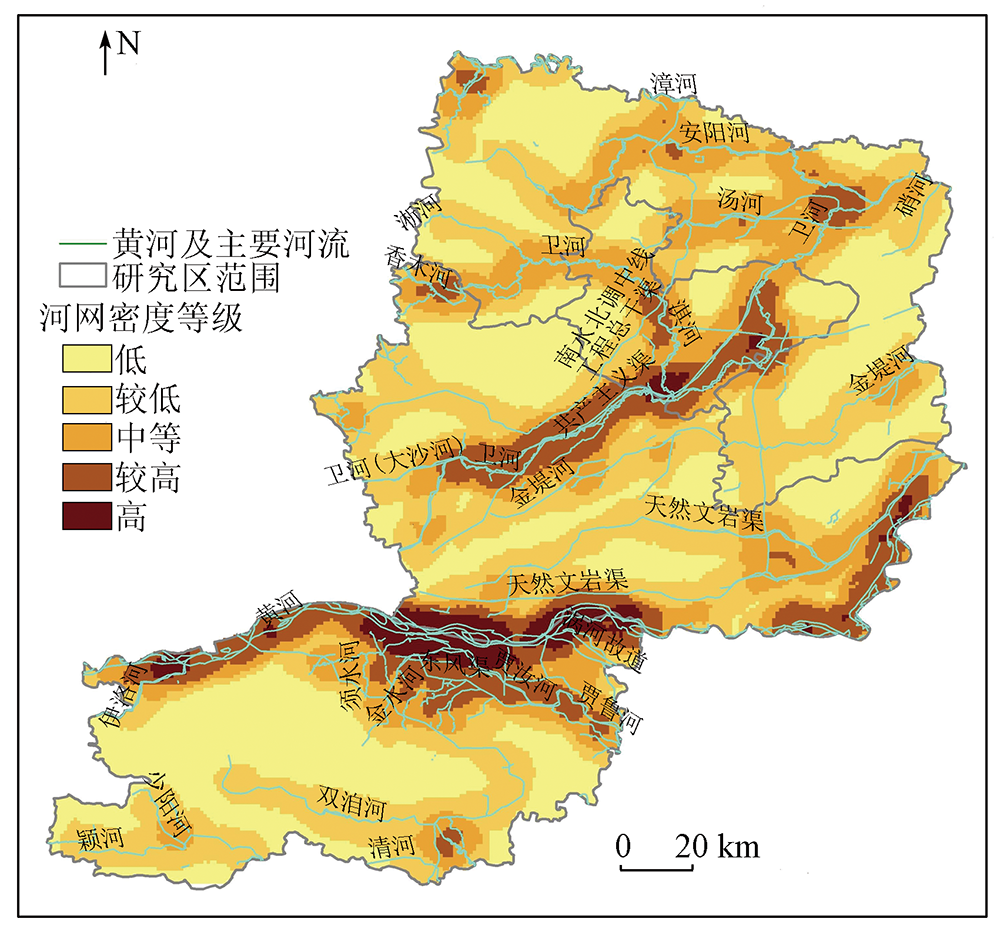
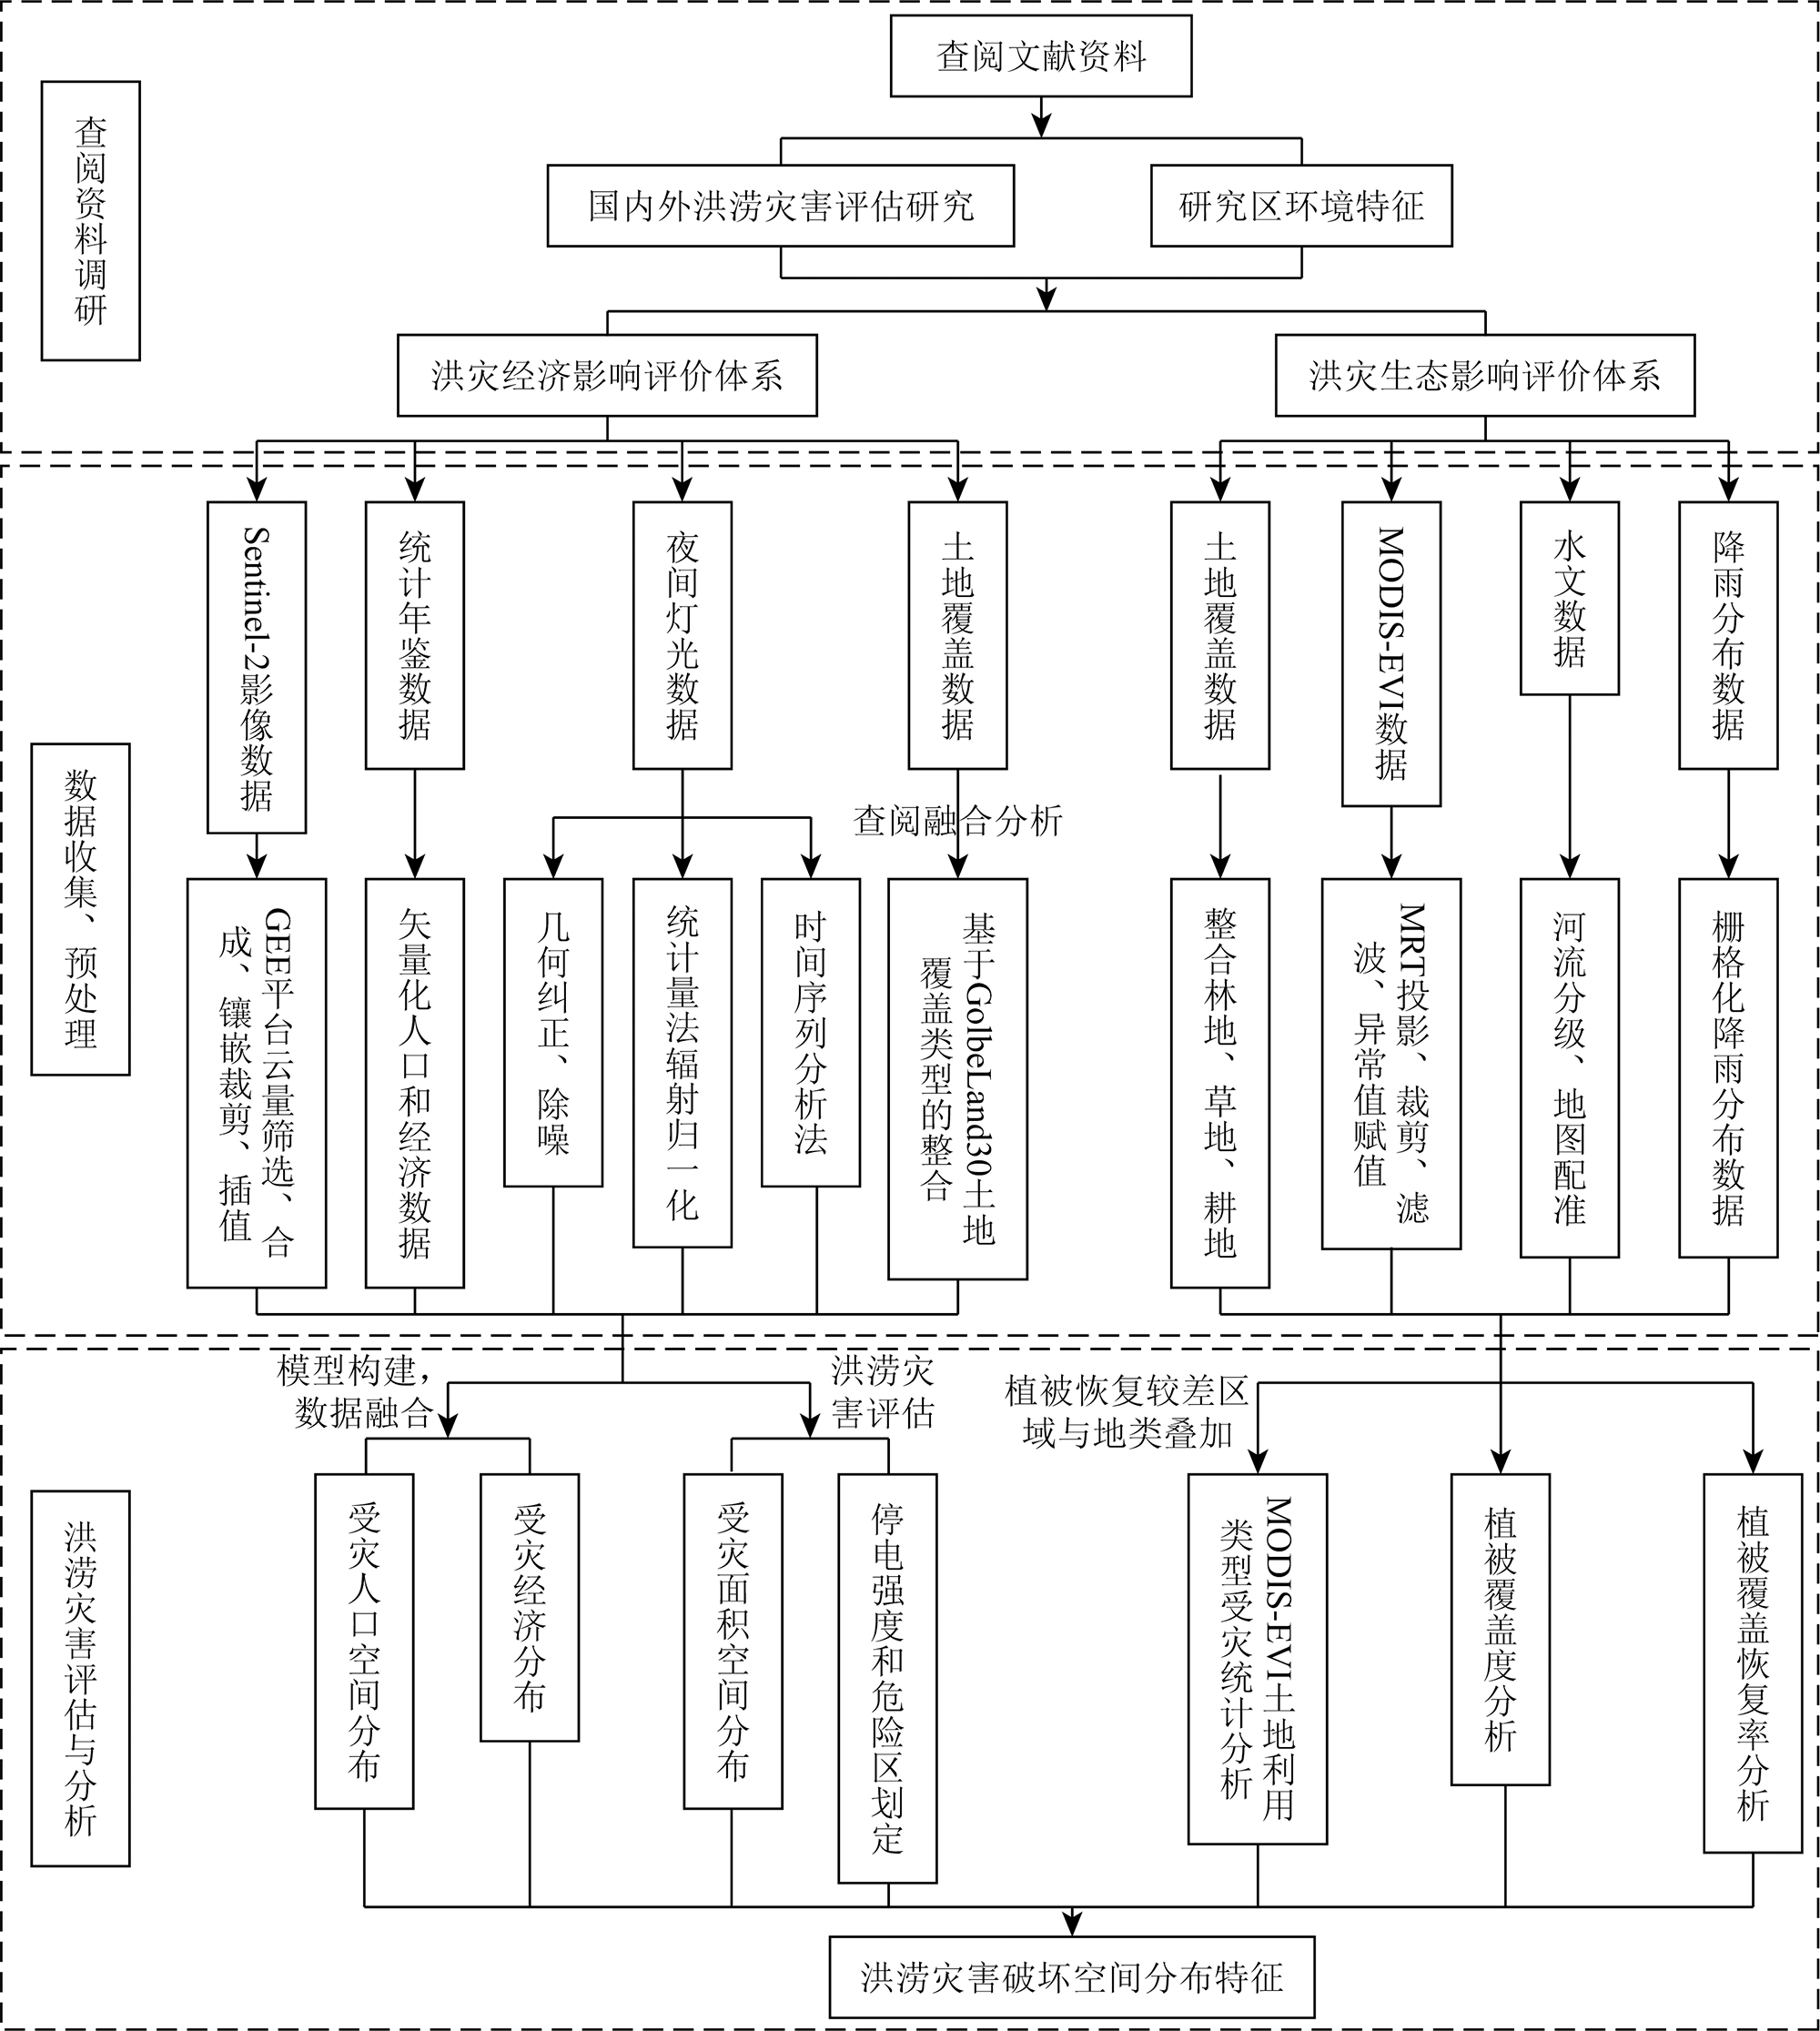
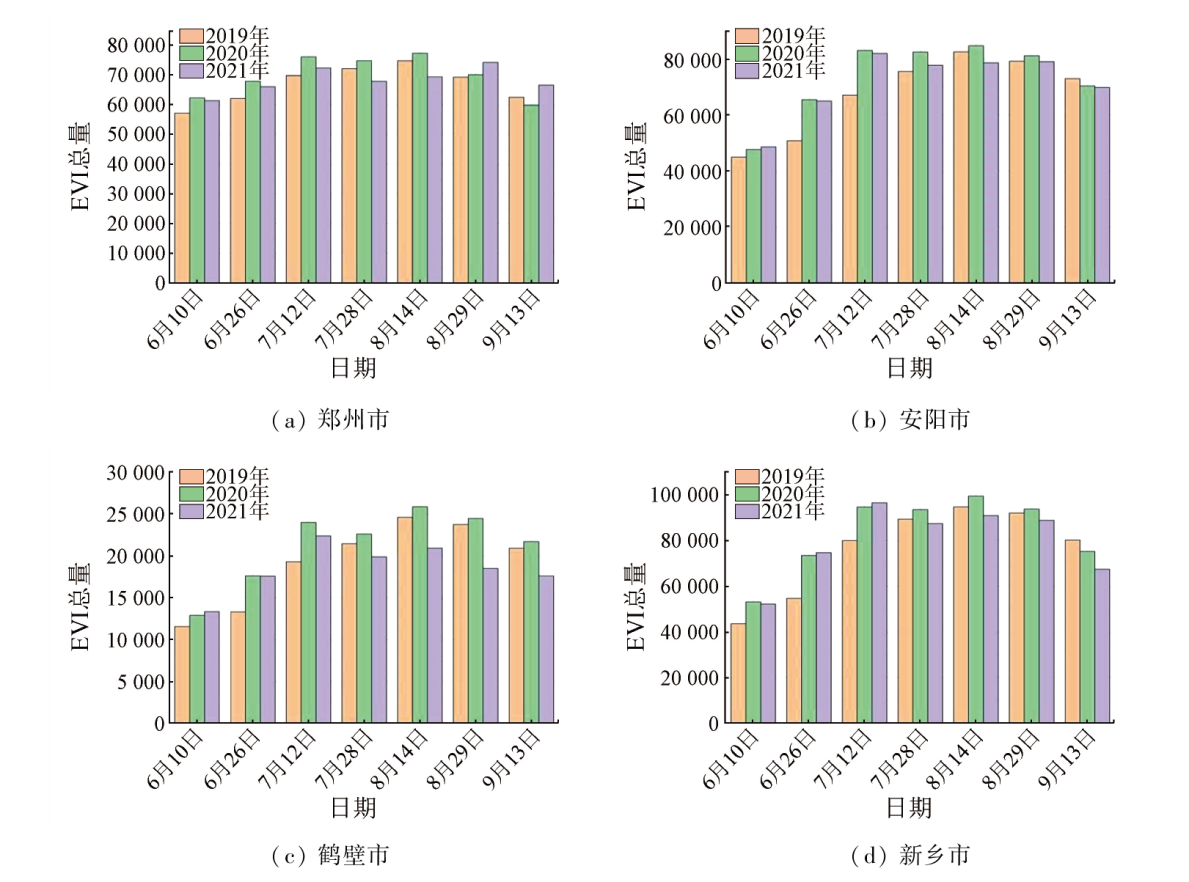
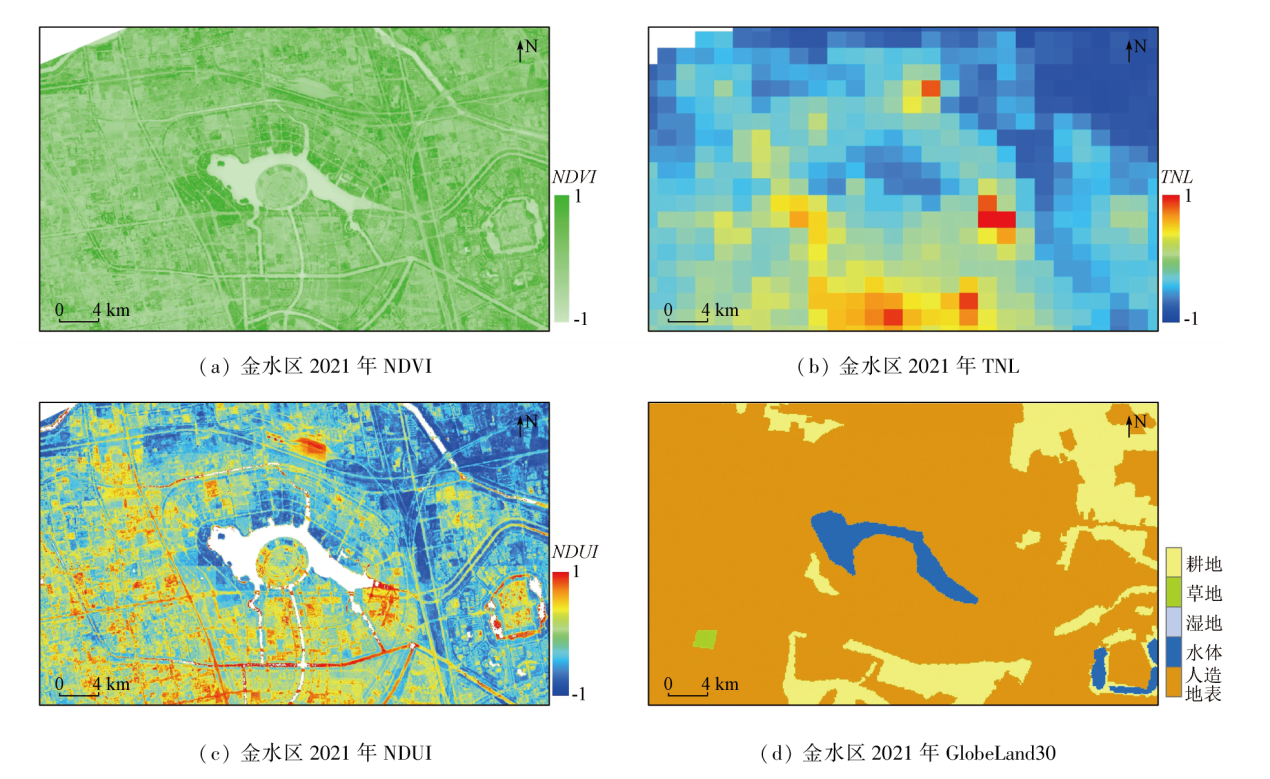
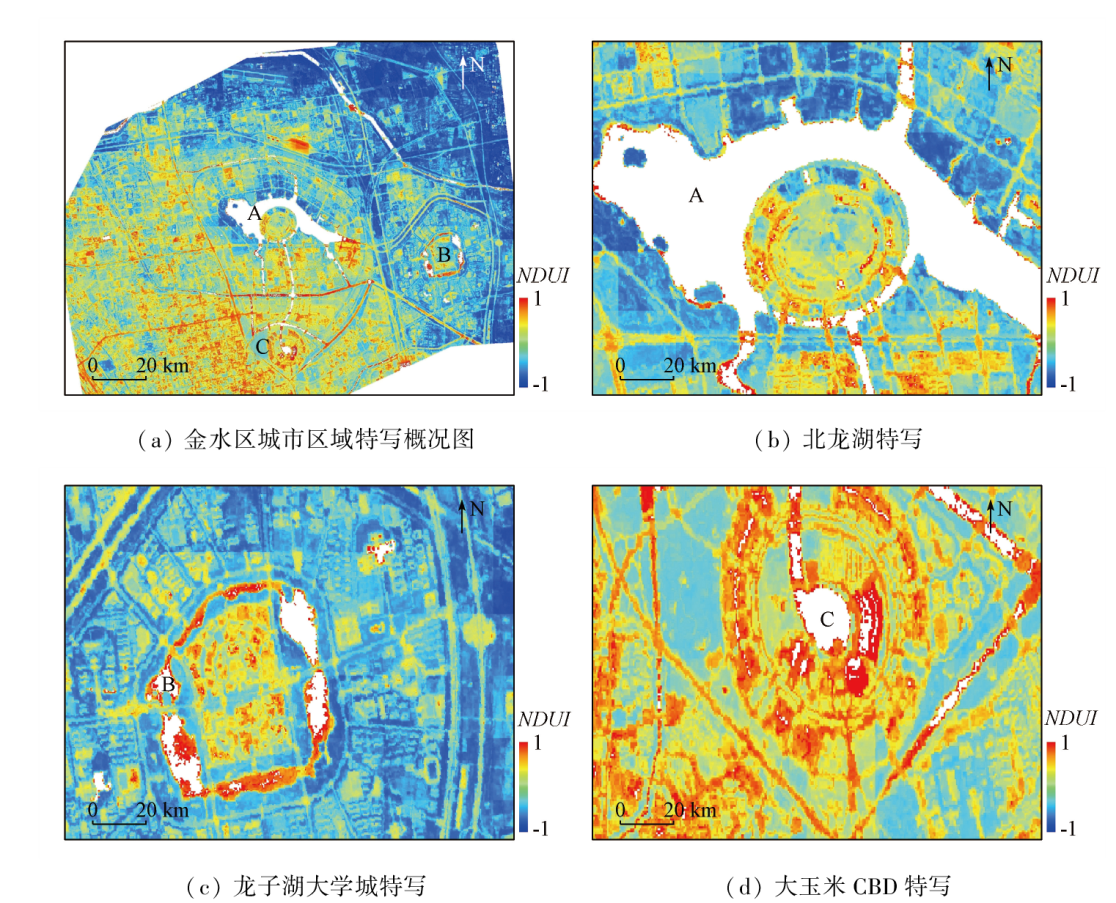
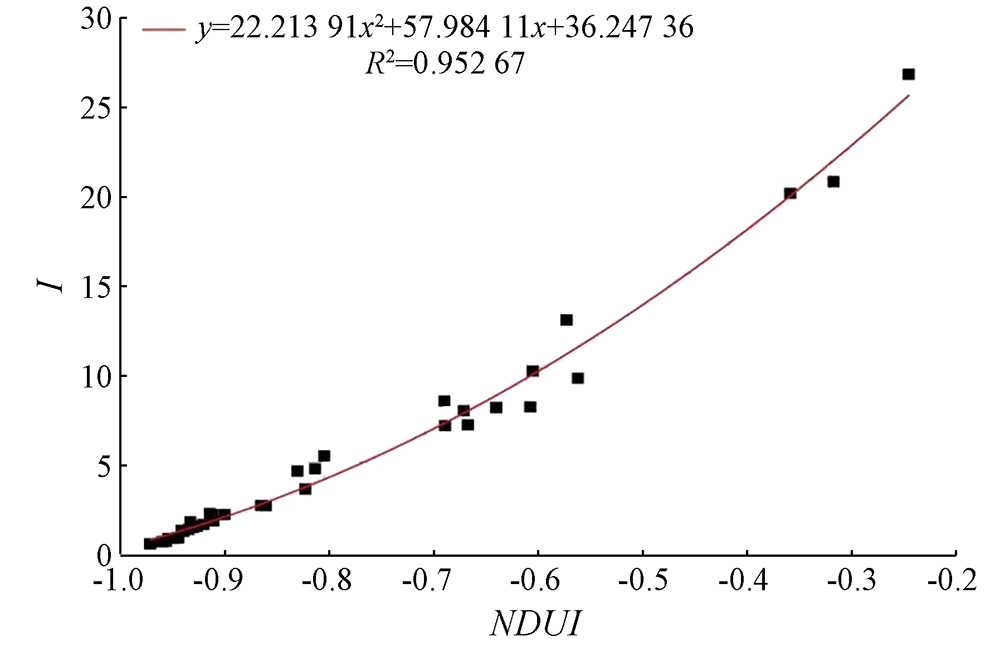
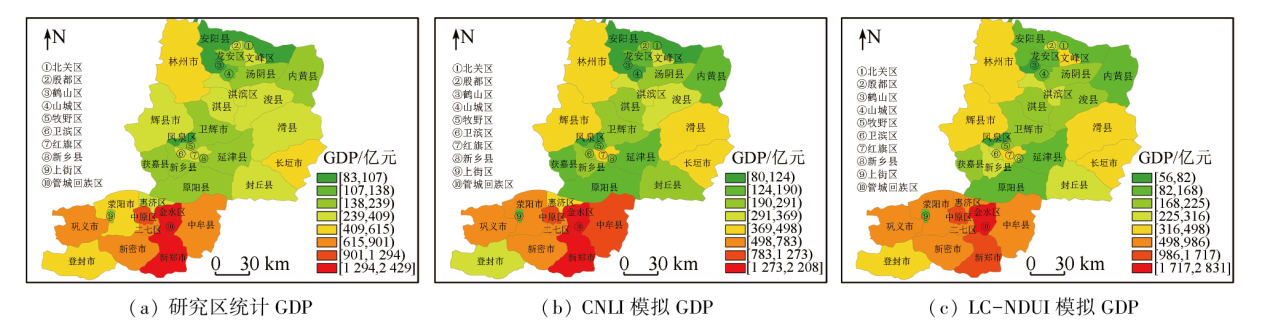
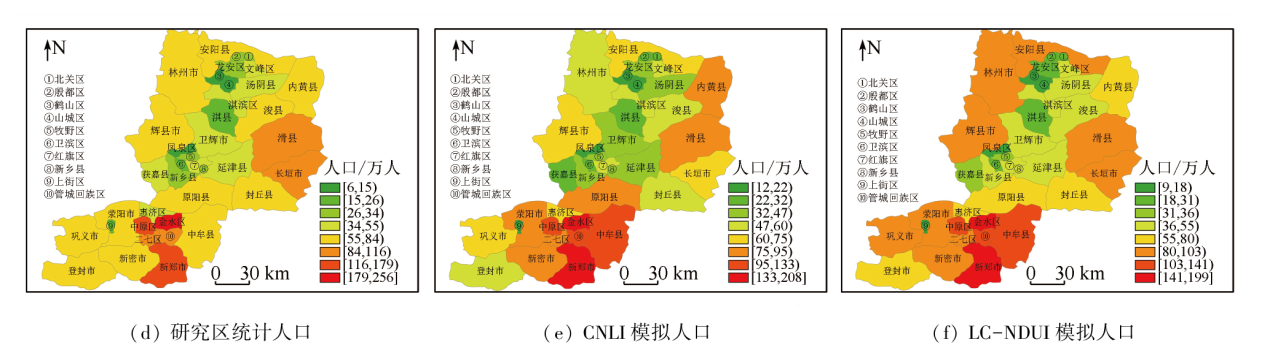
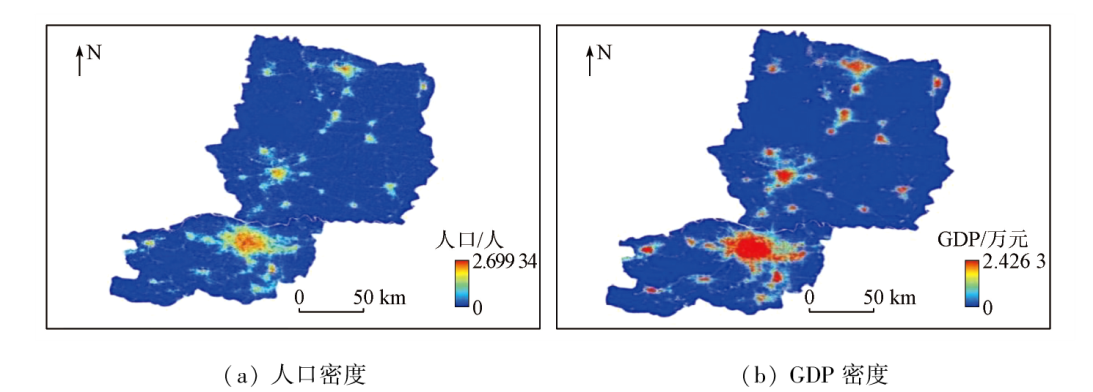
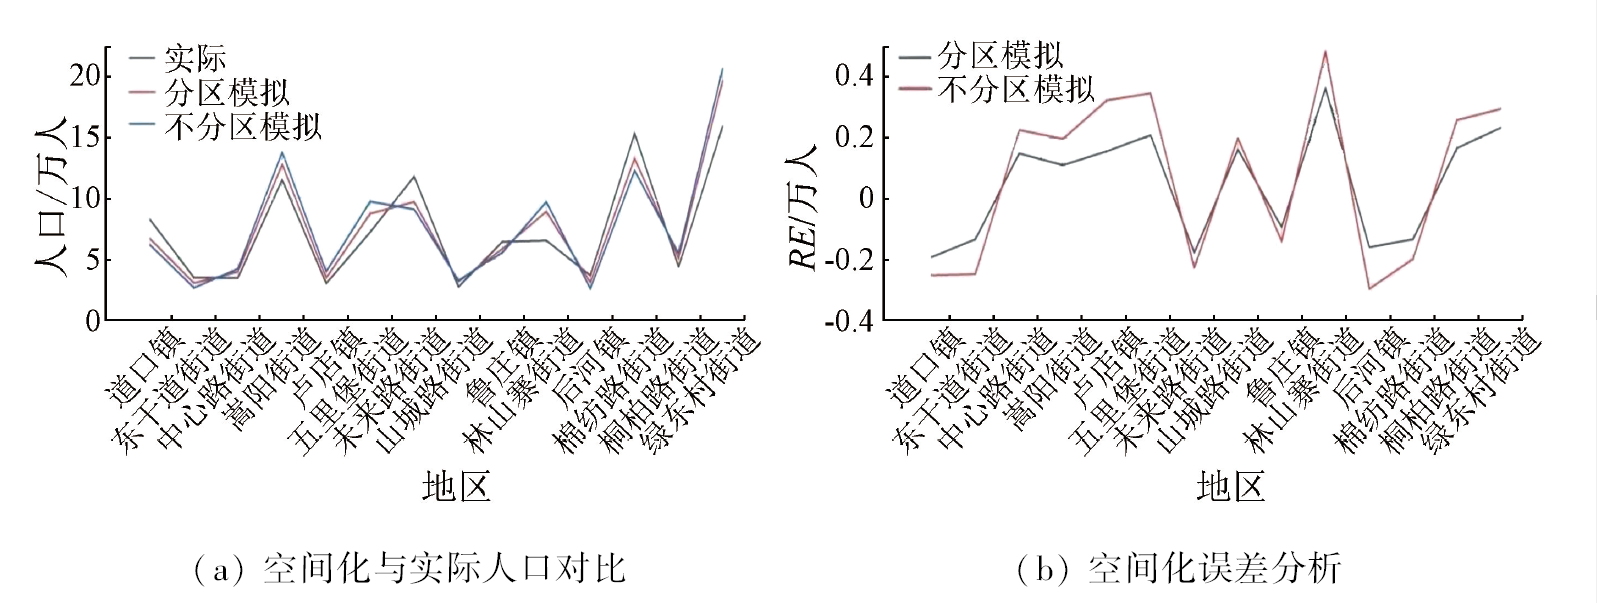
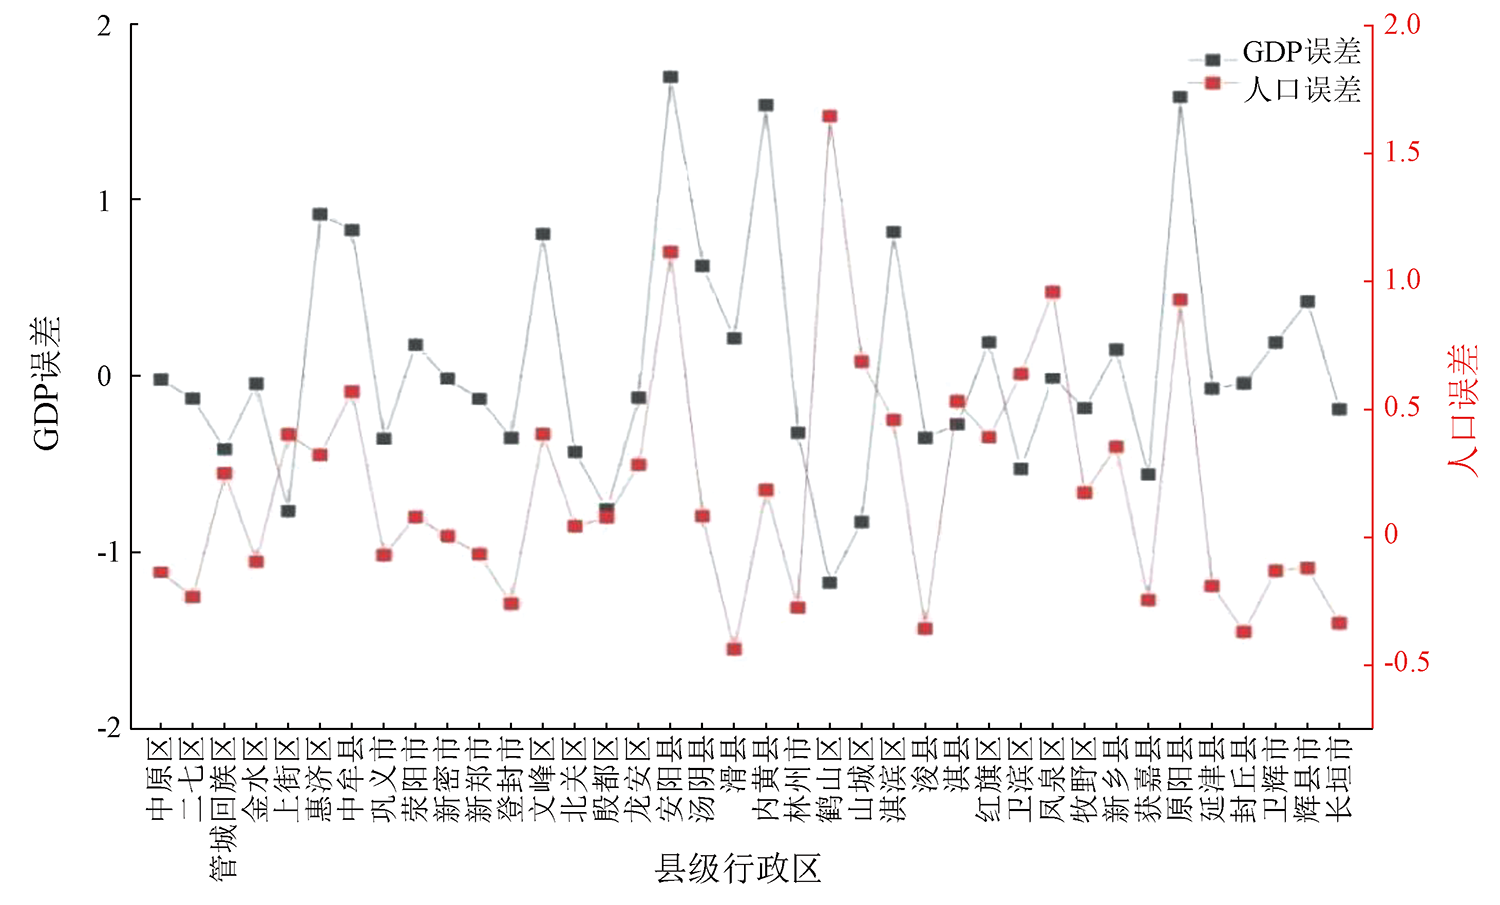
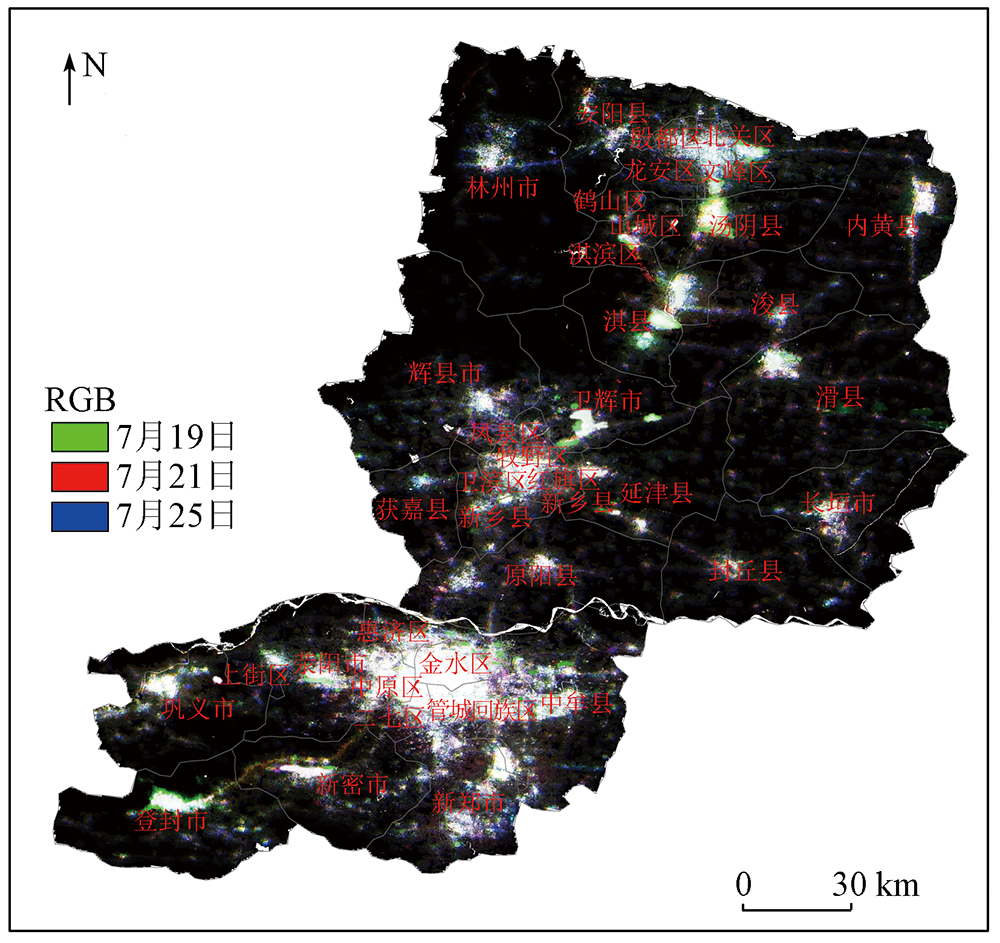
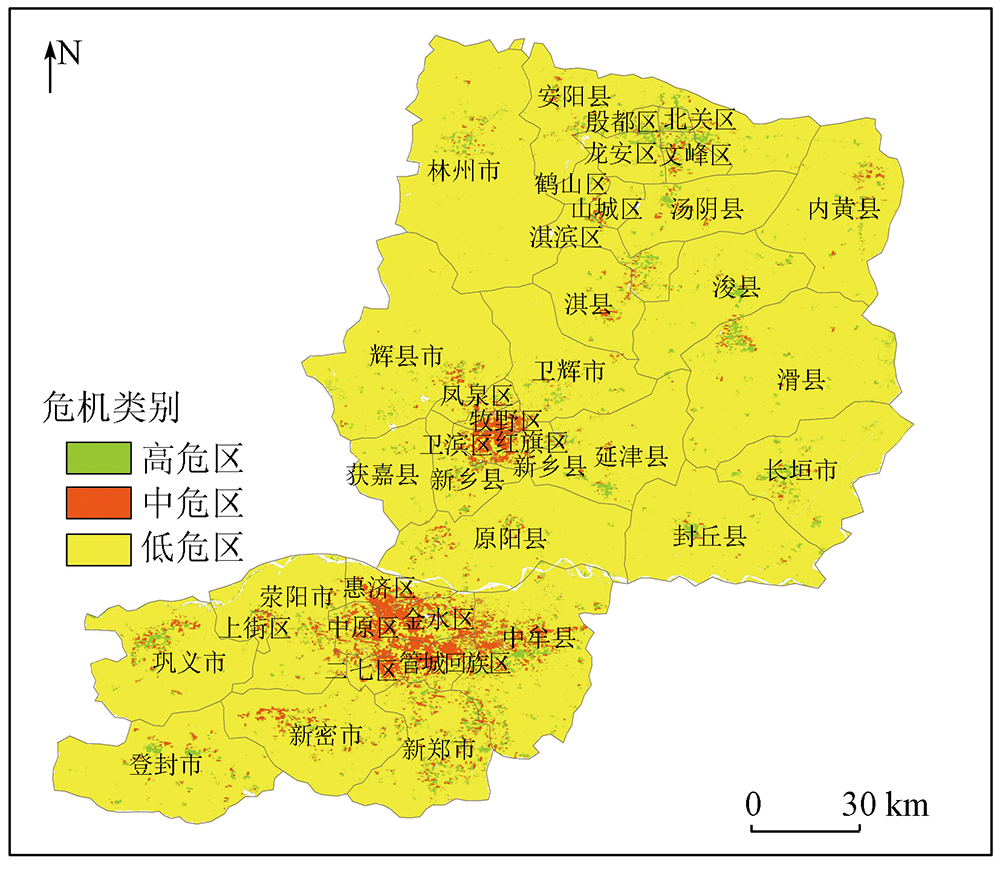
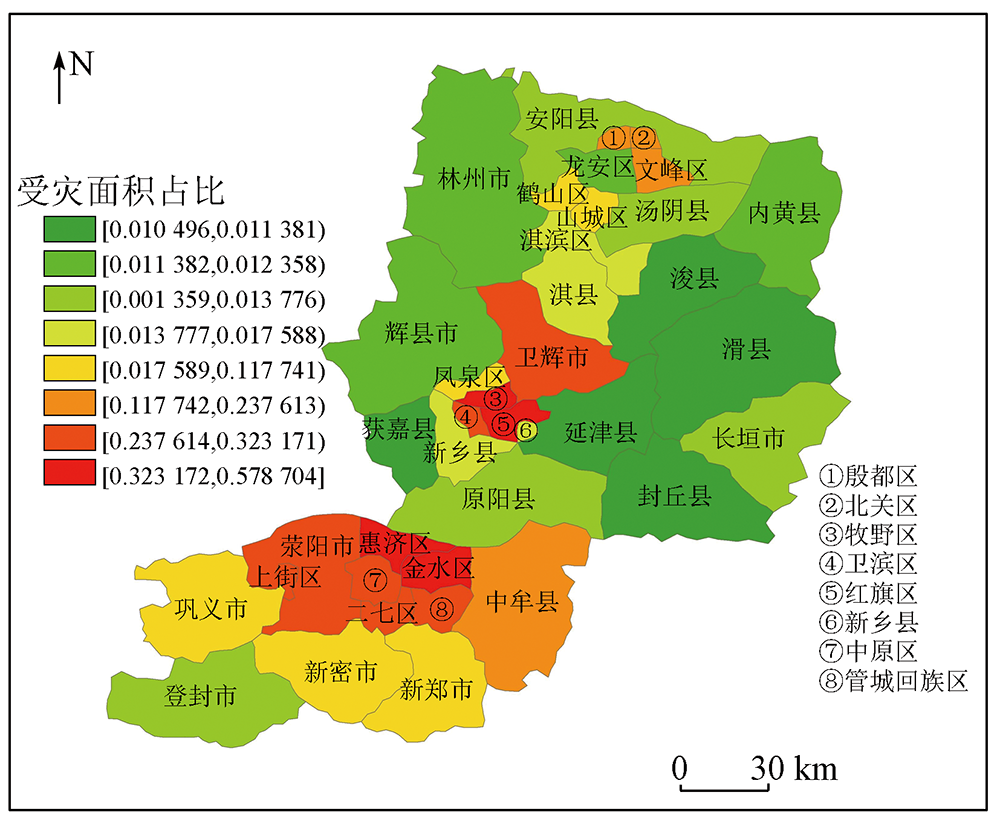
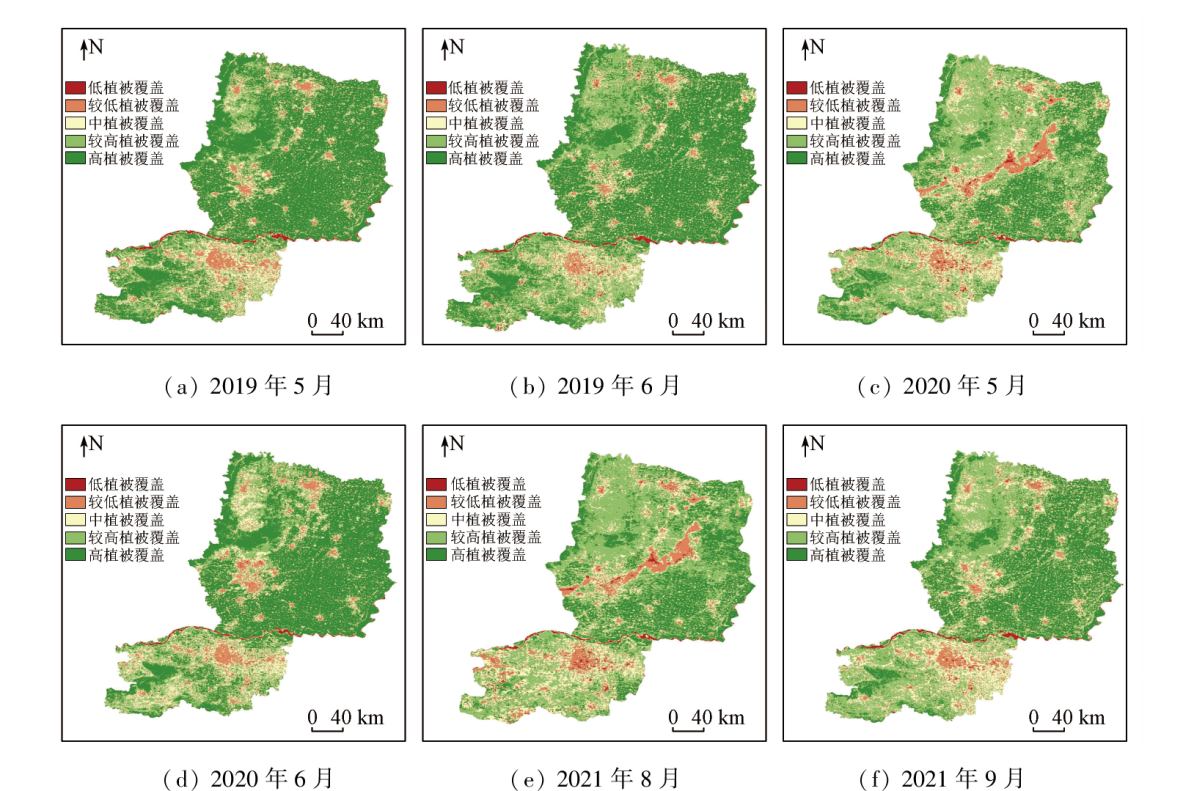
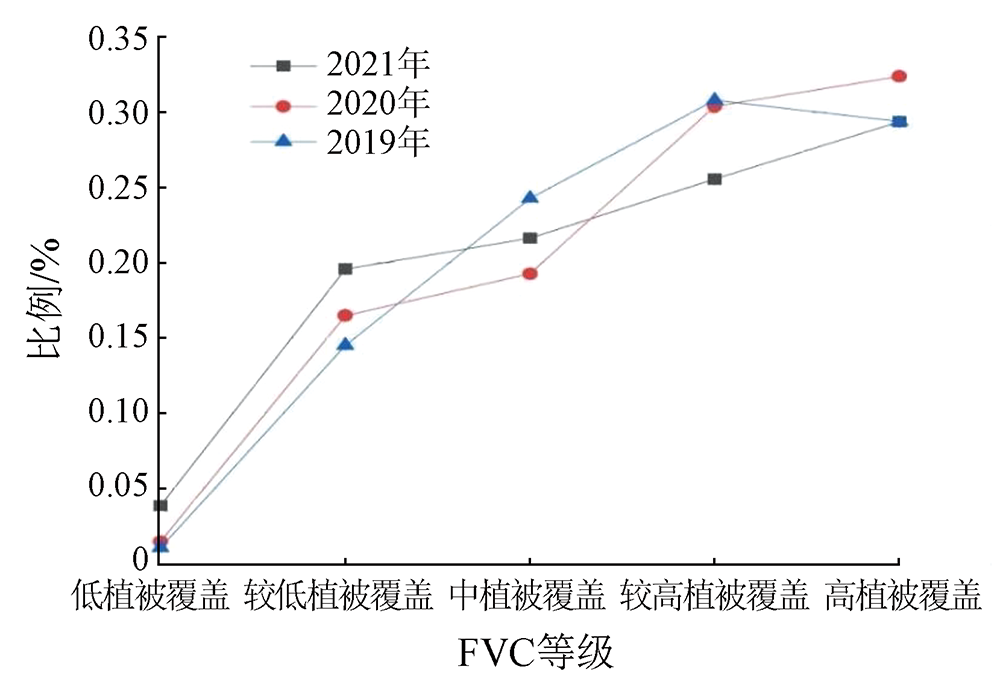
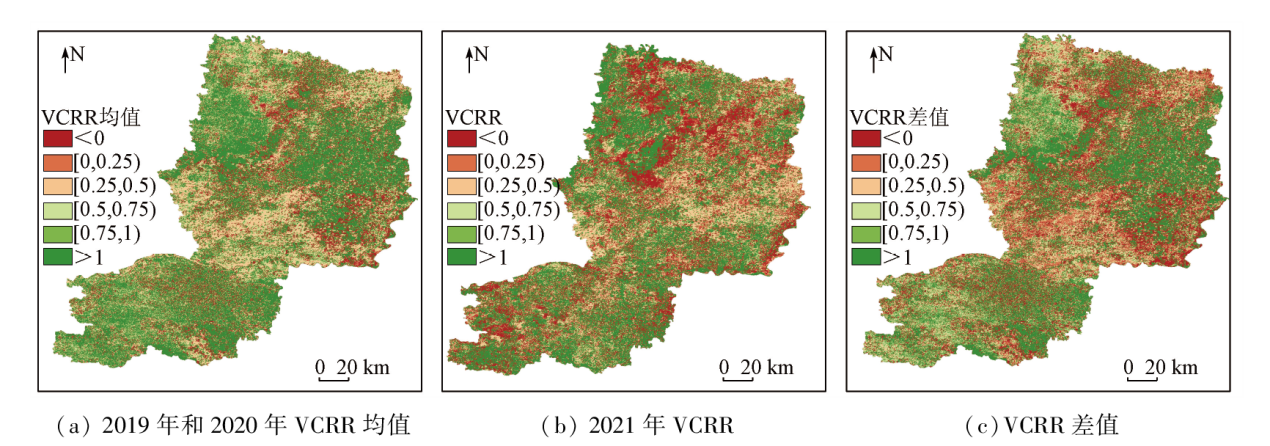
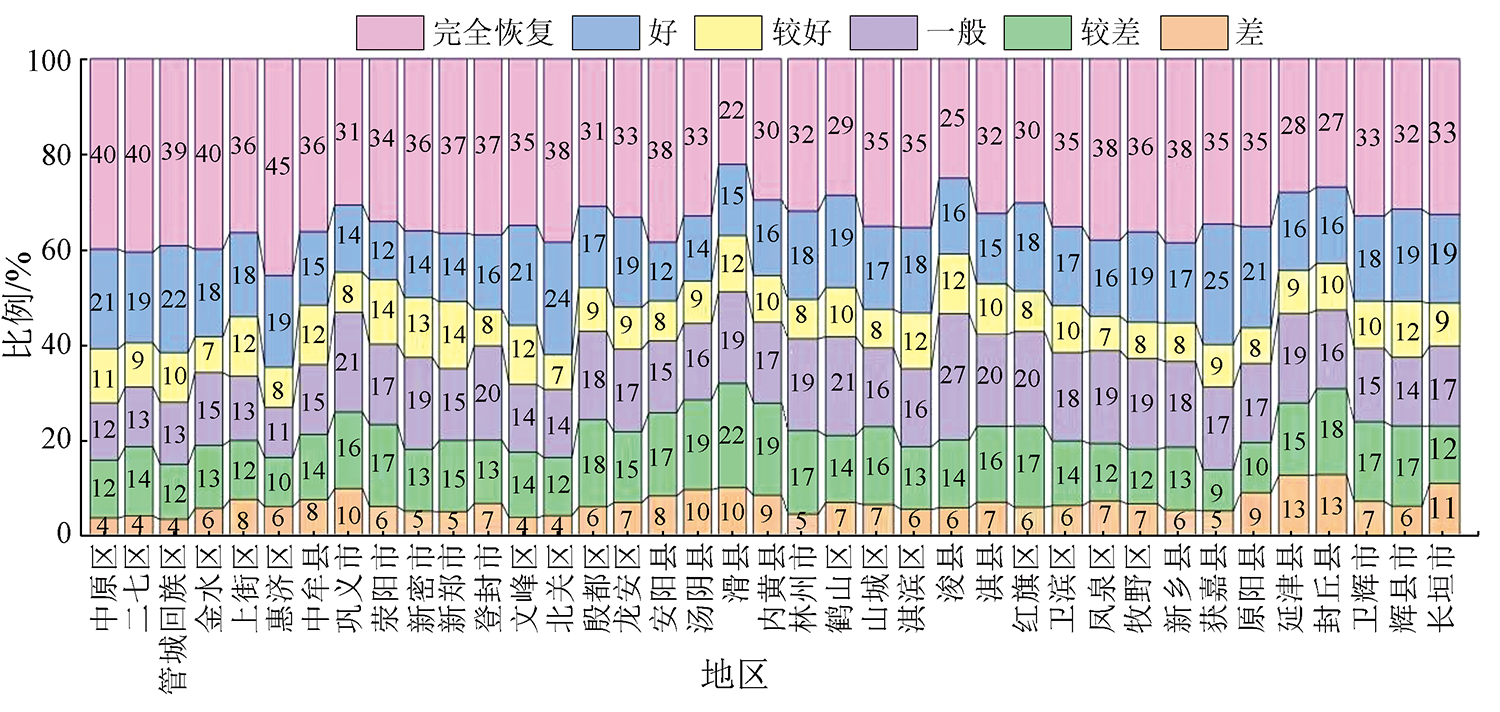
Quantitative post-flood recovery assessment based on vegetation and lighting indices is critical for assessing economic reconstruction and ecological restoration in afflicted areas. This study investigated the “7.20” rainstorm disaster area in Henan. Based on the daily and monthly NPP-VIIRS data, Sentinel-NDVI and MODIS-EVI data, and statistical yearbook data, this study characterized the spatial intricacies within urban areas by constructing a normalized difference urban index (NDUI). Then, it simulated the population and GDP distributions by employing a regression model. Finally, this study assessed the post-flood recovery from two distinct aspects: nighttime light data and vegetation cover data. The results are as follows: ① High- and medium-risk zones covered an area of 1 429.04 km2, accounting for 6.06% of the total study area. High-risk zones were primarily distributed in western Zhengzhou, eastern Xinxiang, eastern Anyang, and northern Hebi, with Zhengzhou suffering the most severe impact; ② In terms of the vegetation cover recovery rate (VCRR), low overall vegetation recovery was observed in Weihui and Linzhou cities and Qixian and Huaxian counties, with VCRRs mostly below 0. This indicates a deteriorating vegetation cover trend; ③ The fitting between NDUI and socio-economic statistical data yielded accuracy exceeding 0.8, suggesting that the NDUI can be applied to precise location-based rescue and targeted post-disaster reconstruction in the aftermath of floods. Additionally, the assessment results based on NPP-VIIRS and MODIS-EVI data were highly complementary, implying that the flood research based on the integration of the two types of data enjoys high application value for post-disaster rescue and recovery assessment.
黎孟琦, 李功权, 谢志辉. 整合多源遥感数据的洪涝灾害评估恢复——以河南“7·20”暴雨灾害为例[J]. 自然资源遥感, 2024, 36(1): 250-266.
LI Mengqi, LI Gongquan, XIE Zhihui. Post-flood recovery assessment based on multi-source remote sensing data:A case study of the “7·20” rainstorm in Henan. Remote Sensing for Natural Resources, 2024, 36(1): 250-266.
Qiu C, Liu H B, Wan C C, et al. Tempo-spatial variation and cause analysis of rainstorms and related flood disasters in Shandong from 1984 to 2019[J]. Journal of Catastrophology, 2022, 37(4): 57-63.
[2]
Pandey B, Joshi P K, Seto K C. Monitoring urbanization dynamics in India using DMSP/OLS night time lights and SPOT-VGT data[J]. International Journal of Applied Earth Observation and Geoinformation, 2013, 23:49-61.
doi: 10.1016/j.jag.2012.11.005
[3]
Joshi P K, Bairwa B M, Sharma R, et al. Assessing urbanization patterns over India using temporal DMSP-OLS night-time satellite data[J]. Current science, 2011, 100(10):1479-1482.
Li B, Yan Q, Zhang L, et al. Flood monitoring and analysis over the middle reaches of Yangtze River basin with MODIS time-series imagery[J]. Geomatics and Information Science of Wuhan University, 2013, 38(7):789-793,883-884.
Xu C, Jiang W G, Wan L D, et al. Research of flood submerged frequency in Dongting Lake region based on time series dataset of MODIS[J]. Journal of Catastrophology, 2016, 31(1):96-101.
Zhang N, Wang P, Sang H Y, et al. Study of sub-pixel mapping flood submerged range based on MODIS data[J]. Science of Surveying and Mapping, 2019, 44(2):164-170.
Rao P Z, Jiang W G, Wang X Y, et al. Flood disaster analysis disasters based on MODIS data:Taking the flood in Dongting Lake area in 2017 as an example[J]. Journal of Catastrophology, 2019, 34(1):203-207.
Tian Y G, Liao X L, Zhang C X. Method on crop inundated time extraction after rainstorm using time series MODIS images[J]. Remote Sensing Technology and Application, 2012, 27(5):778-783.
Li F, Mi X N, Liu J, et al. Spatialization of GDP in Beijing using NPP-VIIRS data[J]. Land and resources remote sensing, 2016, 28(3):19-24.doi: 10.6046/gtzyyg.2016.03.04.
Pan J H, Hu Y X. Spatial identification of multidimensional poverty in China based on nighttime light remote sensing data[J]. Economic Geography, 2016, 36 (11):124-131.
Li G. GIS assisted on assessment of direct economic losses from typhoon in Zhejiang Province[D]. Nanjing: Nanjing University of Information Science and Technology, 2014.
[12]
Li S, Goldberg M D, Sjoberg W, et al. Assessment of the catastrophic Asia floods and potentially affected population in summer 2020 using VIIRS flood products[J]. Remote Sensing, 2020, 12(19):3176.
doi: 10.3390/rs12193176
[13]
Sun D, Li S, Zheng W, et al. Mapping floods due to Hurricane Sandy using NPP VIIRS and ATMS data and geotagged Flickr imagery[J]. International Journal of Digital Earth, 2016, 9(5): 427-441.
doi: 10.1080/17538947.2015.1040474
He Y R, Wang X R, Chai C F, et al. Flood damage assessment and visualization based on NPP-VIIRS nighttime light remote sensing[J]. Journal of Natural Disasters, 2022, 31(3):93-105.
Zhang B J. Analysis of the inter-annual variation of nighttime lights in the most affected area of Wenchuan earthquake from 2003 to 2013[J]. Journal of Catastrophology, 2018, 33 (1): 12-18,22.
Guan J Y, Li D, Wang Y F, et al. DMSP-OLS and NPP-VIIRS night light image correction in China[J]. Bulletin of Surveying and Mapping, 2021(9):1-8.
doi: 10.13474/j.cnki.11-2246.2021.0264
[17]
Jakubauskas M E, Legates D R, Kastens J H. Harmonic analysis of time-series AVHRR NDVI data[J]. Photogrammetric Engineering and Remote Sensing, 2001, 67(4):461-470.
Wang X L, Shi S H. Spatio-temporal changes of vegetation in the Yellow River Basin and related effect of landform based on GEE[J]. Journal of Geo-Information Science, 2022, 24(6):1087-1098.
Hong Y, Zhao Y B, Wang Y S, et al. Temporal and spatial variation characteristics of vegetation restoration based on MODIS-NDVI Wenchuan earthquake region in ten years[J]. Science Technology and Engineering, 2019, 19(16):64-74.
[21]
Zhao M, Cheng W, Zhou C, et al. GDP spatialization and economic differences in South China based on NPP-VIIRS nighttime light imagery[J]. Remote Sensing, 2017, 9(7): 673.
doi: 10.3390/rs9070673
 2024, Vol. 36
  ), 李功权(