|
|
 |
|

|
|
|
A method based on harmonic model for generating synthetic GF-1 images |
Jian LIAO1,2, Xingfa GU1, Yulin ZHAN1( ), Yazhou ZHANG1,2, Xinyu REN1,2, Shuaiyi SHI1,2 ), Yazhou ZHANG1,2, Xinyu REN1,2, Shuaiyi SHI1,2 |
1. Institute of Remote Sensing and Digital Earth Chinese Academy of Science, Beijing 100094, China
2. University of Chinese Academy of Sciences, Beijing 100049, China |
|
|
|
|
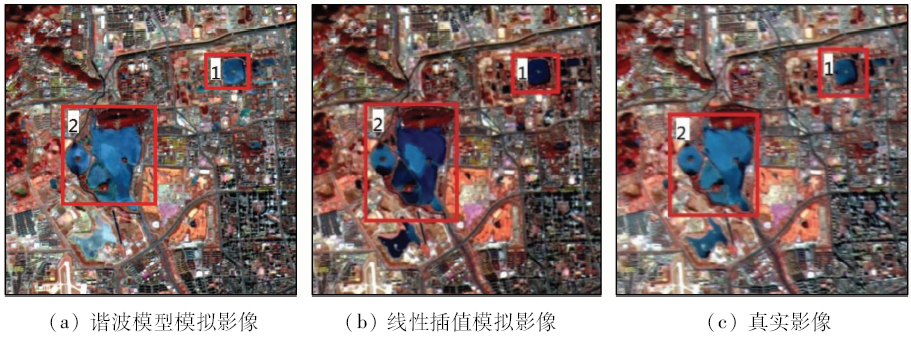
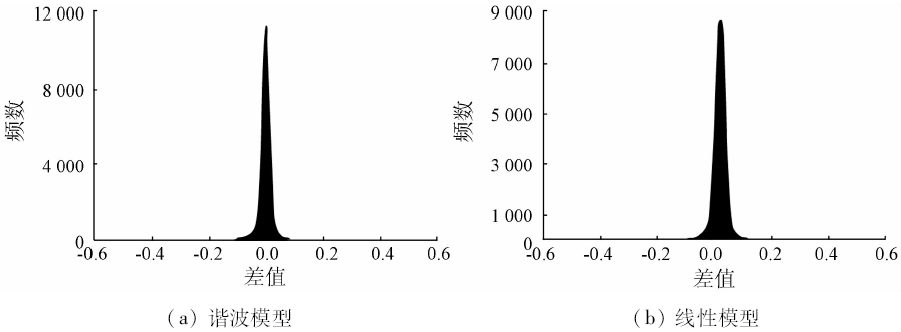
Abstract Remote sensing technology has been applied more widely and deeply with its development and, meanwhile, it has been asked for obtaining higher and higher spatial and temporal resolution. However, it is very difficult to overcome the contradiction between spatial resolution and temporal resolution of remote sensing images. Considering the influence of cloud, frog, snow and shadow, obtaining clear image with high spatial and high temporal resolution is impractical. To solve this problem, the authors proposed a method based on harmonic model for generating synthetic GF-1 images, which can take advantage of all available clear history images of GF-1 satellites to simulate the surface reflectance data at any specified date, so that obtaining time serial satellite images at any temporal frequency theoretically and overcoming the limits of methods based on fusion models for synthesizing satellite images become possible. Synthetic GF-1 images generated based on the harmonic model which will firstly establish a model parameterized by Julia date for every pixel of every band using all clear GF-1 time serial images since GF-1 satellite was launched and then the synthetic image at the specified day with the models would be generated. Finally, to illustrate the availability of harmonic model based method, the authors applied visual assessment and quantitative assessment. The synthetic images generated by this method were very visually similar to the real images and provide good result in quantitative assessment. Most difference of pixel values between synthetic image and real image ranged -0.03~0.03, and the root mean square error (RMSE) between synthetic image and real image ranged 0.02~0.05. The method based on harmonic model showed relatively high accuracy and stability, and effectively improved the temporal resolution of GF-1 images and could be applied in real production environment.
|
| Keywords
GF-1 satellite
image synthesizing
harmonic model
synthesize
|
|
|
|
Corresponding Authors:
Yulin ZHAN
E-mail: zhanyl@radi.ac.cn
|
|
Issue Date: 10 September 2018
|
|
|
| [1] |
佃袁勇 . 基于遥感影像的变化检测研究[D]. 武汉:武汉大学, 2005.
|
| [1] |
Dian Y Y . Research on Change Detection in Remote Sensing Imagery[D]. Wuhan:Wuhan University, 2005.
|
| [2] |
Hansen M C, Roy D P, Lindquist E , et al. A method for integrating MODIS and Landsat data for systematic monitoring of forest cover and change in the Congo Basin[J]. Remote Sensing of Environment, 2008,112(5):2495-2513.
doi: 10.1016/j.rse.2007.11.012
url: http://linkinghub.elsevier.com/retrieve/pii/S0034425707004774
|
| [3] |
Griffiths P, Linden S V D,Kuemmerle T,et al.A pixel-based Landsat compositing algorithm for large area land cover mapping[J]. IEEE Journal of Selected Topics in Applied Earth Observations and Remote Sensing, 2013,6(5):2088-2101.
doi: 10.1109/JSTARS.2012.2228167
url: http://ieeexplore.ieee.org/document/6415303/
|
| [4] |
Cihlar J, Manak D, D’Iorio M .Evaluation of compositing algorithms for AVHRR data over land[J]. IEEE Transactions on Geoscience and Remote Sensing, 1994,32(2):427-437.
doi: 10.1109/36.295057
url: http://ieeexplore.ieee.org/document/295057/
|
| [5] |
Holben B N . Characteristics of maximum-value composite images from temporal AVHRR data[J]. International Journal of Remote Sensing, 1986,7(11):1417-1434.
doi: 10.1080/01431168608948945
url: http://www.tandfonline.com/doi/abs/10.1080/01431168608948945
|
| [6] |
Luo Y, Trishchenko A P, Khlopenkov K V . Developing clear-sky,cloud and cloud shadow mask for producing clear-sky composites at 250-meter spatial resolution for the seven MODIS land bands over Canada and North America[J]. Remote Sensing of Environment, 2008,112(12):4167-4185.
doi: 10.1016/j.rse.2008.06.010
url: http://linkinghub.elsevier.com/retrieve/pii/S0034425708002174
|
| [7] |
Roy D P, Ju J C, Kline K , et al. Web-enabled Landsat data (WELD):Landsat ETM+ composited mosaics of the conterminous United States[J]. Remote Sensing of Environment, 2010,114(1):35-49.
doi: 10.1016/j.rse.2009.08.011
url: http://linkinghub.elsevier.com/retrieve/pii/S0034425709002545
|
| [8] |
Stoms D M, Bueno M J, Davis F W . Viewing geometry of AVHRR image composites derived using multiple criteria[J]. Photogrammetric Engineering and Remote Sensing, 1997,63(6):681-689.
doi: 10.1016/S0924-2716(97)00008-7
url: http://europepmc.org/abstract/AGR/IND20583997
|
| [9] |
White J C, Wulder M A, Hobart G W , et al. Pixel-based image compositing for large-area dense time series applications and science[J]. Canadian Journal of Remote Sensing, 2014,40(3):192-212.
doi: 10.1080/07038992.2014.945827
url: http://www.tandfonline.com/doi/full/10.1080/07038992.2014.945827
|
| [10] |
邬明权, 牛铮, 王长耀 . 多源遥感数据时空融合模型应用分析[J]. 地球信息科学学报, 2014,16(5):776-783.
doi: 10.3724/SP.J.1047.2014.00776
|
| [10] |
Wu M Q, Niu Z, Wang C Y . Assessing the accuracy of spatial and temporal image fusion model of complex area in South China[J]. Journal of Geo-Information Science, 2014,16(5):776-783.
|
| [11] |
Davis J C . Statistics and Data Analysis in Geology[M]. 2nd ed.New York:Wiley, 1986: 646.
|
| [12] |
Rayner J N . An Introduction to Spectral Analysis[M]. London:Pion Ltd., 1971: 174.
|
| [13] |
Zhu Z, Woodcock C E . Continuous change detection and classification of land cover using all available Landsat data[J]. Remote Sensing of Environment, 2014,144:152-171.
doi: 10.1016/j.rse.2014.01.011
url: http://linkinghub.elsevier.com/retrieve/pii/S0034425714000248
|
| [14] |
Zhu Z, Woodcock C E, Holden C , et al. Generating synthetic Landsat images based on all available Landsat data:Predicting Landsat surface reflectance at any given time[J]. Remote Sensing of Environment, 2015,162:67-83.
doi: 10.1016/j.rse.2015.02.009
url: http://linkinghub.elsevier.com/retrieve/pii/S0034425715000590
|
| [15] |
Verbesselt J, Zeileis A, Herold M . Near real-time disturbance detection using satellite image time series[J]. Remote Sensing of Environment, 2012,123:98-108.
doi: 10.1016/j.rse.2012.02.022
url: http://linkinghub.elsevier.com/retrieve/pii/S0034425712001150
|
|
Viewed |
|
|
|
Full text
|
|
|
|
|
Abstract
|
|
|
|
|
Cited |
|
|
|
|
| |
Shared |
|
|
|
|
| |
Discussed |
|
|
|
|
 2018,
Vol. 30
2018,
Vol. 30